

The December Marketplace
“The year ended the way it started, with inflation taking the headlines,” said Jonna Parker, Team Lead, Fresh at IRI. “According to the December IRI primary shopper survey, 93% believe groceries cost somewhat or a lot more than last year and 97% are somewhat or a lot concerned about it — lower-income households in particular. Consumers are noticing higher prices for all areas of the store, but especially called out fresh areas, such as eggs, milk, produce, meat and poultry. Whether these are perceptions or reality, consumers will adjust shopping behaviors based on what they believe, which is what makes the market even more unpredictable.”
Amid the continued disruption, IRI, 210 Analytics and International Fresh Produce Association remain committed to bringing the industry the latest trends and analysis in fresh produce.
The survey found that inflationary pressure on income is real: 43% of consumers say their current financial situation is worse than last year. Additionally, 31% expect it to be worse a year from now versus 27% who believe it will be better. This has prompted a host of money-saving measures when buying groceries among 82% of Americans, such as buying what’s on sale (53%), cutting back on non-essentials (45%), looking for coupons (35%) and switching to store brand items (31%).
The December IRI survey also noted a sharp uptick in the estimated share of meals prepared at home. The share of home-prepared meals started to rise in September and jumped from 78.9% in November to 81.5% in December. Holiday occasions as well as the recent increase in flu and COVID cases could be influencing factors.
“Along with the increase in home-prepared meals came a drop in the share of households who purchased restaurant meals, from 80% in November to 76% in December,” Parker said. “Cutting back on restaurant spending is also a popular way to save for many, according to the December IRI survey.”
Takeout (52%) and eating on premise (46%) were the most common ways to purchase restaurant meals, with delivery more popular among younger consumers. Lunch is one of the areas where consumers are looking to save on restaurant meals. Among people working away-from-home, 38% packed lunch more often. At the same time, 25% looked for lower-cost options and 25% for what’s on sale when deciding what to take to work for lunch. One in five also reduced their spend by cutting back on snacks, treats and desserts in lunches.
“In-store merchandising and recipe ideation often go after dinner,” said Joe Watson, IFPA’s VP, Retail, Foodservice and Wholesale. “Between more people working from home versus pre-pandemic and people identifying lunch as an occasion to save, retailers have an opportunity to go after fast, healthy and cost-effective solutions. Salads, sandwiches, fruit and vegetable snacks – they all fit the bill.”
2022 in Review
High inflation, continued supply chain challenges and fluctuating restaurant engagement resulted in another year of record food and beverage sales, reaching $753 billion in 2022. However, unit sales dropped for the second year in a row, though remained ahead of 2019. Unlike volume, units are measured consistently across all categories.
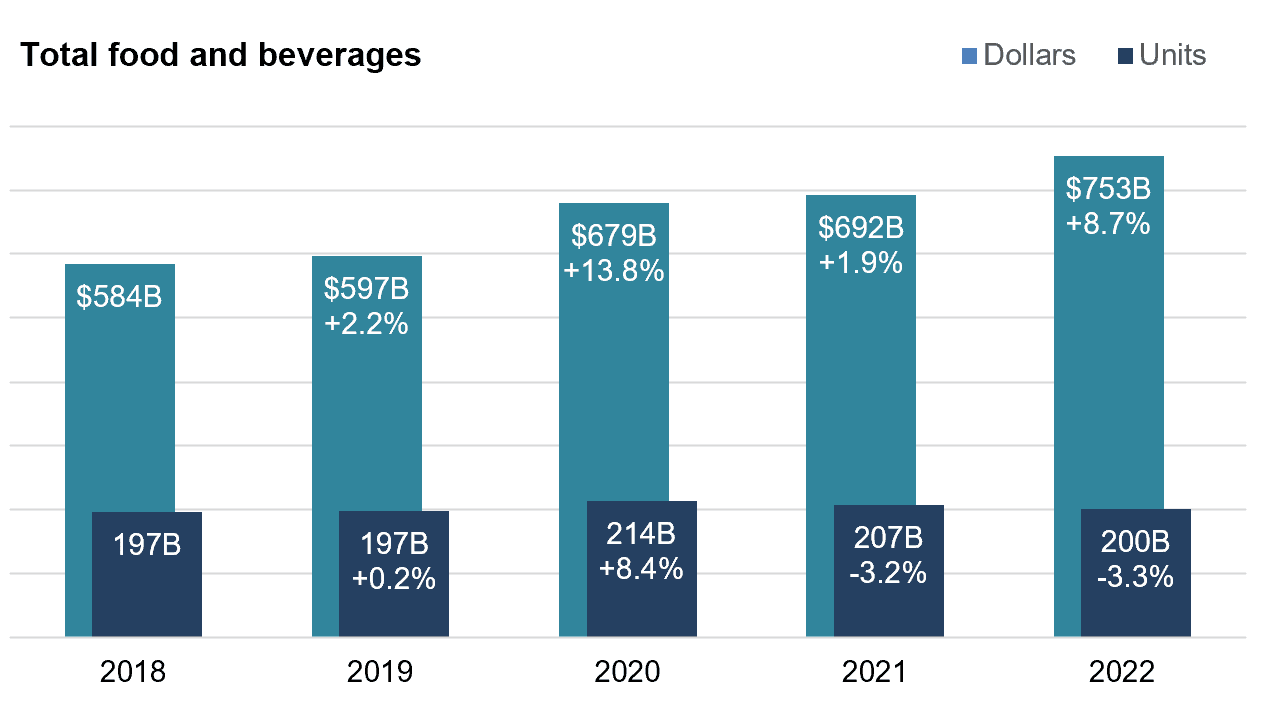
Source: IRI, Integrated Fresh, MULO, Total US, 2018-2022
“Fresh produce also set new records in dollar sales, but saw units down 3.6% — about the same decrease as measured in 2021,” Watson said.
Volume (in pounds) is still well ahead of 2019, the pre-pandemic normal.
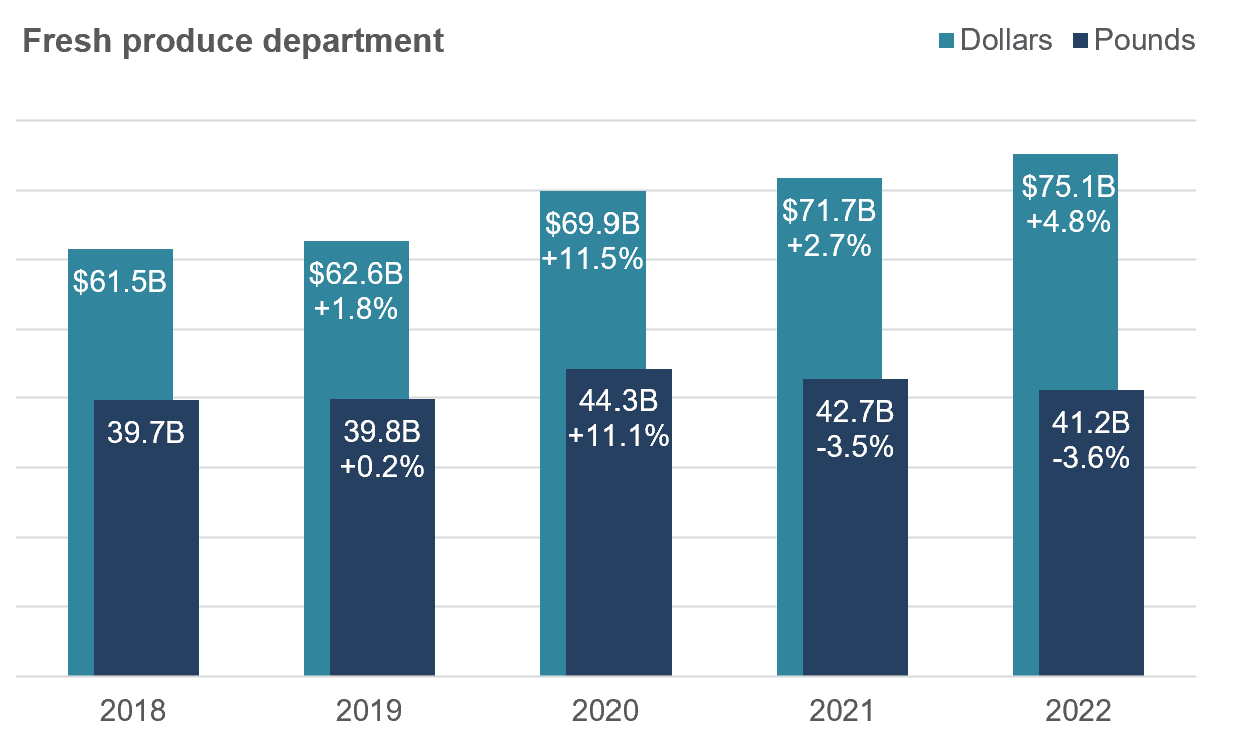
Source: IRI, Integrated Fresh, MULO, Total US, 2018-2022
Inflation Insights
The price per unit across all foods and beverages in the IRI-measured multi-outlet stores, including supermarkets, club, mass, supercenter, drug and military, increased 12.8% in December (the four weeks ending 12/25/2022). The fourth quarter inflation averaged 13.5% per unit, which was down about a half point from the third quarter. Compared with December 2019, prices across all foods and beverages were up +27.5%.
| Average price/unit vs. YA | 2018 | 2019 | 2020 | 2021 | 2022 | Q1 2022 | Q2 2022 | Q3 2022 | Q4 2022 | Dec 22 |
| Total food and beverages | +1.5% | +2.0% | +5.1% | +5.4% | +12.5% | +10.0% | +12.0% | +14.1% | +13.5% | +12.8% |
Fresh produce prices were also up over 2021, but a relatively low +8.7% on a per-pound basis. This is far below the total store average as fresh fruit prices started to moderate in the third and fourth quarters of the year.
| Price per volume (lbs) | Price/volume | Change vs. 2021 | Change vs. 2019 |
| Total fresh produce December 2022 | $1.90 | +4.3% | +17.1% |
| Total fresh produce 2022 | $1.83 | +8.7% | +16.1% |
| Fresh fruit December 2022 | $1.77 | +1.5% | +17.2% |
| Fresh fruit latest 2022 | $1.69 | +9.5% | +18.8% |
| Fresh vegetables December 2022 | $1.99 | +6.9% | +17.9% |
| Fresh vegetables 2022 | $1.94 | +7.9% | +13.6% |
December 2022 Sales
The four December 2022 weeks brought $64.4 billion in total food and beverage sales — an increase of 11% versus last year. Perishables, including produce, seafood, meat, bakery and deli, had a slightly below-average dollar performance that was largely related to below-average inflation. Center store item sales increased nearly 14%. When comparing December sales to past years, units were still ahead of pre-pandemic 2019, especially in frozen.
| December 2022 | % sales change versus year ago | |||||||
| Dollar size | Dollars vs. 2021 | Dollars vs. 2020 | Dollars vs. 2019 | Units vs. 2021 | Units vs. 2020 | Units vs. 2019 | ||
| Total food and beverages | $64.4B | +11.0% | +19.2% | +31.3% | -1.6% | -2.7% | +3.0% | |
| Total perishables | $28.0B | +9.9% | +17.8% | +29.8% | -1.2% | -2.7% | +4.0% | |
| Total grocery (center store) | $32.4B | +13.7% | +23.4% | +36.5% | -1.8% | -2.5% | +2.6% | |
December 2022 fresh produce sales reached $5.5 billion, surpassing the record set the prior year by +4.4%. “Fresh produce units and volume had been trending closer and closer to year ago levels each month,” Parker said, “and December closed out the year in a strong way. Fruit sales were up in units and vegetables up in pounds as celebrations remained home-centric.”
| December 2022 | $ size | $ growth vs. ‘21 | $ growth vs. ‘19 | Unit growth vs. ‘21 | Unit growth vs. ‘19 | Volume growth vs. ‘21 | Volume growth vs. ‘19 |
| Total fresh produce | $5.446B | +4.4% | +25.2% | +0.0% | +8.6% | +0.1% | +6.9% |
| Fresh fruit | $2.445B | +1.3% | +25.6% | +1.1% | +11.8% | -0.2% | +7.2% |
| Fresh vegetables | $2.892B | +7.3% | +25.8% | -0.9% | +6.6% | +0.3% | +6.7% |
The last two weeks leading up to the holiday were big for fresh produce, topping $1.5 billion. “The 4.3% increase in pound sales in the holiday week is a very encouraging sign for continued wins in 2023,” Watson noted. “New Year’s sales are not yet included in these December numbers and we have Valentine’s Day around the corner. That was traditionally one of the biggest restaurant days of the year, but one where retail has made significant inroads in the past few years.
| Produce department | Dollar sales | $ vs. YA | lbs vs. YA |
| December 2022 | $5.446B | +4.4% | +0.1% |
| w.e. 12/4/2022 | $1.263B | +3.3% | -1.7% |
| w.e. 12/11/2022 | $1.298B | +3.6% | -1.1% |
| w.e. 12/18/2022 | $1.315B | +2.6% | -1.8% |
| w.e. 12/25/2022 | $1.571B | +7.7% | +4.3% |
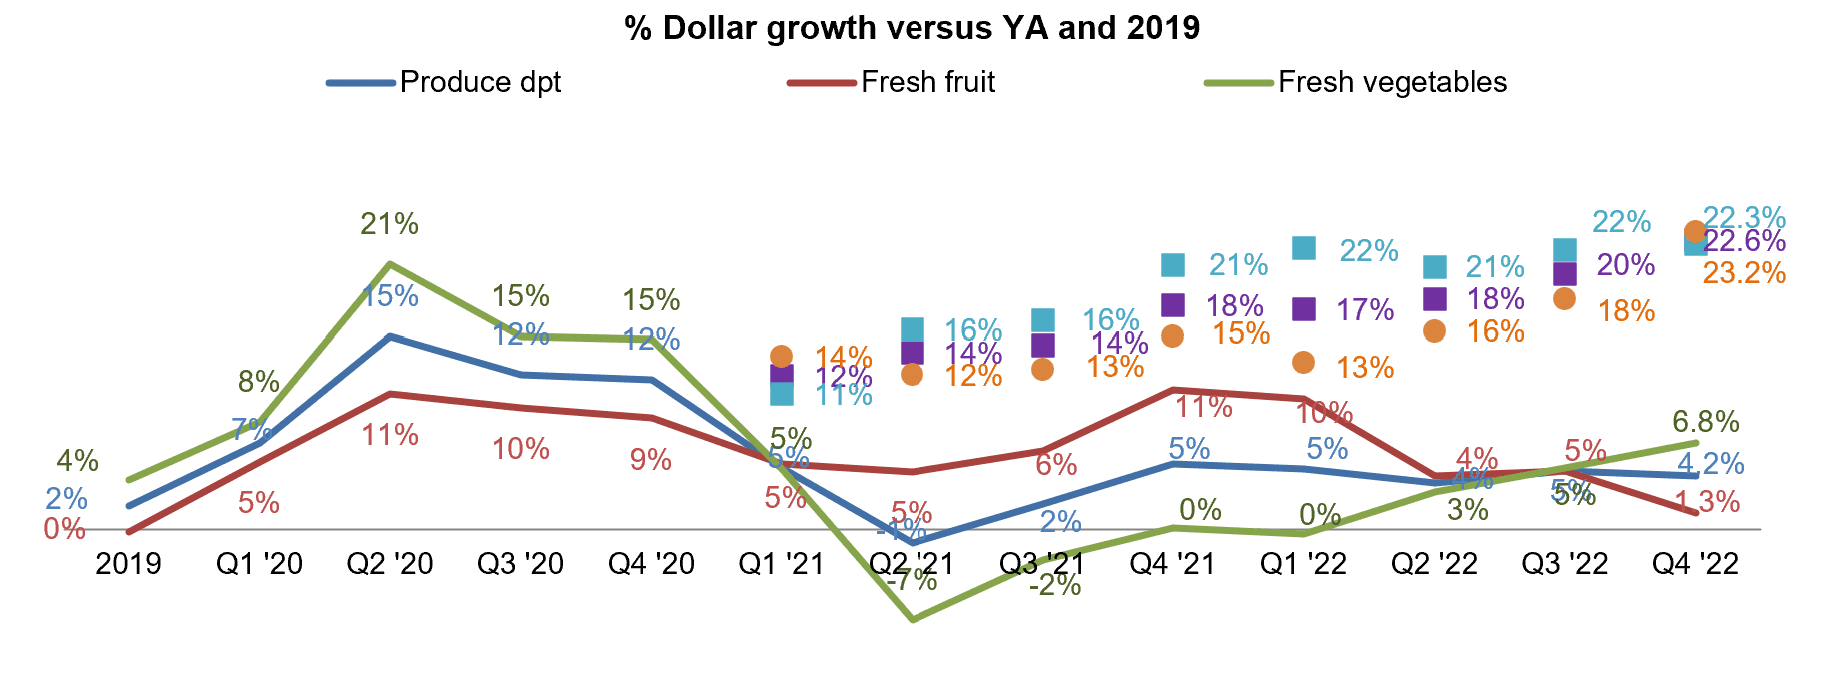
“Growth for fruit is slowing down due to moderating levels of inflation,” said Watson. “The percentage increase versus 2019 demonstrates why we have seen record dollar sales in 2020, 2021 and 2022.”
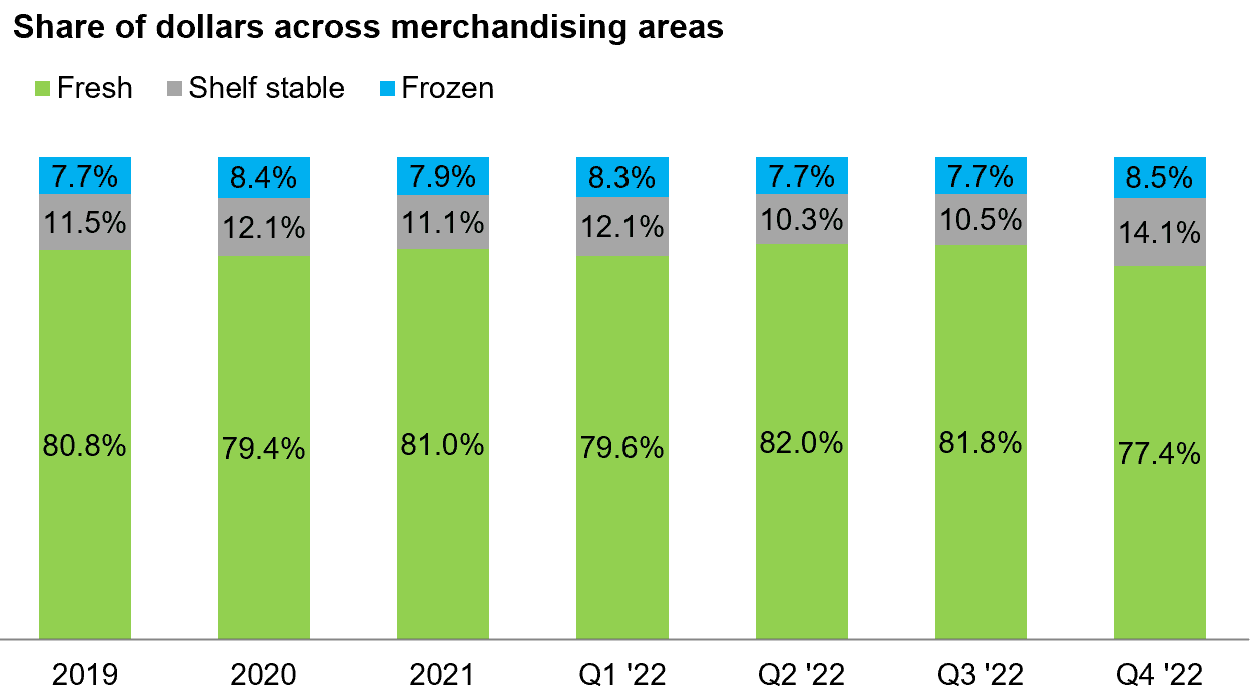
Fresh Produce Share of Total Fruits and Vegetables
“Despite the strong December results when comparing sales to last year and 2019, the growth in fresh produce dollars was far below the levels seen in canned and frozen,” Watson commented.
| December 2022 | Dollar sales | Dollar sales gains vs. 2021 | Dollar sales gains vs. 2019 | Average price per unit | Increase price vs. YA |
| Fresh produce department | $5.4B | +4.4% | +25.2% | $1.90 | +4.3% |
| Frozen fruits and vegetables | $643M | +19.0% | +36.4% | $2.11 | +20.9% |
| Shelf stable fruits | $398M | +13.2% | +33.8% | $2.64 | +18.8% |
| Shelf stable vegetables | $615M | +21.5% | +27.1% | $1.35 | +18.5% |
Winter holiday buying patterns, such as canned green beans, cranberries and corn, in combination with the below-average rate of inflation for fresh produce meant a fourth quarter drop in the share of fresh fruit and vegetables (77.4%) versus the share represented by frozen (8.5%) and shelf-stable (14.1%). Prices for frozen fruit and vegetables increased more than 20% in Q4. Fresh produce sales represented 77% of total pounds sold across the three zones.
Fresh Produce Dollars versus Volume
Fresh produce pound sales have trailed behind year ago levels since March 2021, but volume moved within 1.6% of year ago levels in the fourth quarter of 2022.
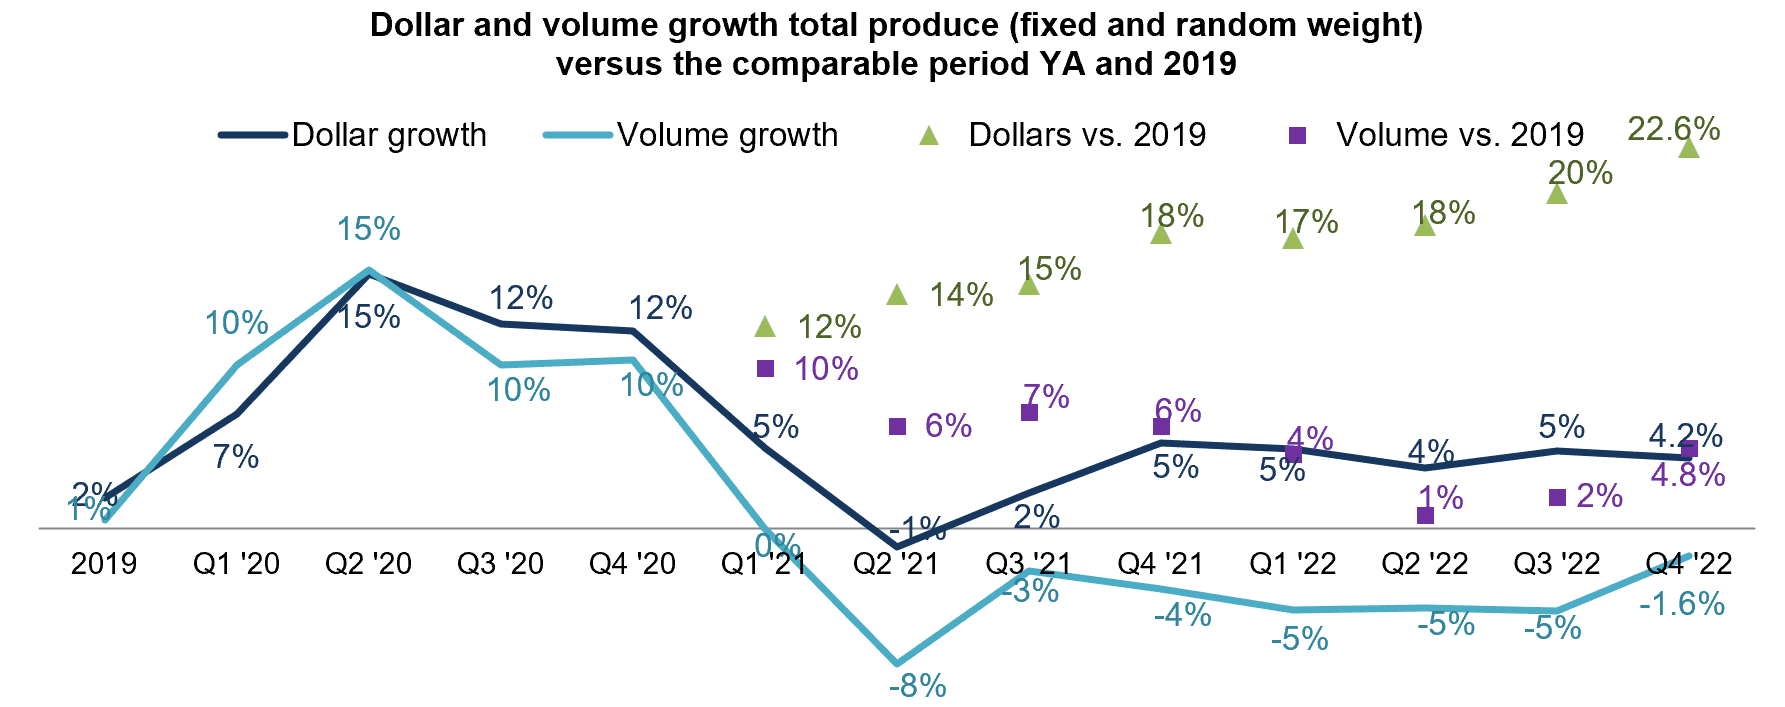
Fruit and vegetable volume got very close to December 2021 levels, pulling up the results for the quarter.
Fresh Fruit Sales
“Berries dominate the top 10 fresh fruit sellers list, both in December and for the calendar year,” said Parker. “In 2022, berries were nearly twice the size of the number two seller, apples, and yet grew both dollars and pounds.” The full-year view shows the impact of inflation when regarding the difference in dollar versus volume. Pound sales were down for many top 10 sellers, with the notable exceptions of berries and grapes.
| Top 10 in sales | December 2022 | Calendar Year 2022 | |||||||||
| Type | $ sales | $ vs. YA | Lbs vs. YA | Type | $ sales | $ vs. YA | Lbs vs. YA | ||||
| Fresh fruit | $2.5B | +1.3% | -0.2% | Fresh fruit | $37.1B | +5.7% | -3.5% | ||||
| Berries | $598M | +0.6% | -0.7% | Berries | $8.6B | +5.4% | +3.9% | ||||
| Apples | $347M | +2.5% | -2.4% | Apples | $4.4B | +5.4% | -3.0% | ||||
| Grapes | $274M | +3.9% | +1.6% | Grapes | $3.8B | +5.9% | +1.9% | ||||
| Bananas | $246M | +5.0% | +1.7% | Melons | $3.4B | +10.2% | -3.1% | ||||
| Mandarins | $163M | -9.2% | -9.4% | Bananas | $3.3B | +2.5% | -2.5% | ||||
| Avocados | $159M | -7.2% | +2.8% | Avocados | $2.7B | +7.7% | -8.5% | ||||
| Melons | $123M | +6.4% | -1.2% | Mandarins | $1.8B | -4.4% | -16.1% | ||||
| Oranges | $104M | +3.6% | +0.2% | Oranges | $1.2B | +9.3% | -5.1% | ||||
| Mixed fruit | $74M | +0.9% | -3.8% | Cherries | $1.1B | +0.0% | -27.8% | ||||
| Pineapples | $66M | +3.9% | +4.1% | Mixed fruit | $1.0B | +4.9% | -3.0% | ||||
Fresh Vegetables Sales in December
“Onions and cucumbers stand out in annual the top selling vegetables with positive pound sales,” said Watson. “But potatoes deserve a callout too. Despite inflation running in the teens, strong consumer demand boosted pound sales over the December 2021 levels.”
| Top 10 in sales | December 2022 | Calendar Year 2022 | ||||||||
| Type | $ sales | $ vs. YA | Lbs vs. YA | Type | $ sales | $ vs. YA | Lbs vs. YA | |||
| Fresh vegetables | $2.9B | +7.3% | +0.3% | Fresh vegetables | $36.9B | +3.9% | -3.7% | |||
| Potatoes | $336M | +20.2% | +1.1% | Tomatoes | $4.0B | +1.4% | -2.8% | |||
| Tomatoes | $312M | +10.3% | +0.2% | Potatoes | $3.8B | +15.0% | -1.3% | |||
| Lettuce | $242M | +16.9% | +3.5% | Salad kits | $3.3B | +1.5% | -7.1% | |||
| Salad kits | $237M | -0.4% | -9.5% | Lettuce | $2.9B | +9.9% | -2.7% | |||
| Onions | $227M | +17.4% | +8.0% | Onions | $2.8B | +17.2% | +4.6% | |||
| Peppers | $193M | +4.9% | +2.7% | Peppers | $2.5B | +1.1% | -4.6% | |||
| Carrots | $112M | +2.5% | -0.4% | Cucumbers | $1.4B | +8.5% | +1.8% | |||
| Cucumbers | $104M | +15.6% | +6.3% | Carrots | $1.4B | +3.7% | -2.0% | |||
| Broccoli | $103M | +4.6% | -5.7% | Mushrooms | $1.3B | -4.1% | -10.5% | |||
| Mushrooms | $98M | -5.3% | -10.7% | Broccoli | $1.2B | +4.2% | -4.5% | |||
Fresh Produce Absolute Dollar Gains
In 2022, fresh fruit added $2.0 billion in additional dollars versus 2021 and fresh vegetables added $1.4 billion. The top 10 commodities that gained the most in absolute dollars are a mix of fruit and vegetables, led by potatoes and berries. Gains were achieved in many different ways, but inflation played a big role for many. Others gained on strong demand with volume gains contribution to the inflationary boost, including berries, onions, grapes and cucumbers.
| Top 10 absolute | December 2022 | Calendar Year 2022 | ||||||||
| dollar growth | $ gain | $ sales | Lbs vs. YA | Type | $ gain | $ sales | Lbs vs. YA | |||
| Potatoes | $56M | $336M | +1.1% | Potatoes | $491M | $3.8B | -1.3% | |||
| Lettuce | $35M | $242M | +3.5% | Berries | $436M | $8.6B | +3.9% | |||
| Onions | $34M | $227M | +8.0% | Onions | $415M | $2.8B | +1.6% | |||
| Tomatoes | $29M | $312M | +0.2% | Melons | $312M | $3.4B | -3.1% | |||
| Cucumbers | $14M | $104M | +6.3% | Lettuce | $266M | $2.9B | -2.7% | |||
| Bananas | $12M | $246M | +1.7% | Apples | $226M | $4.4B | -3.0% | |||
| Grapes | $10M | $274M | +1.6% | Grapes | $211M | $3.8B | +1.9% | |||
| Peppers | $9M | $193M | +2.7% | Avocados | $191M | $2.7B | -8.5% | |||
| Apples | $8M | $347M | -2.4% | Cucumbers | $111M | $1.4B | +1.8% | |||
| Melons | $7M | $123M | -1.2% | Oranges | $106M | $1.3B | -5.1% | |||
Perishables Performance
With heavy inflation in eggs and other dairy items, the total refrigerated department generated a +24.3% increase in sales to reach $6.5 billion in December. However, unit sales were down much like the other departments. Fresh produce had the strongest unit performance when compared to the pre-pandemic normal. Seafood, by far the smallest seller, continued to trend in negative territory despite price deflation.
| Perimeter | December 2022 | Calendar Year 2022 | ||||||||
| department | $ sales | $ vs. YA | Units vs. YA | Department | $ sales | $ vs. YA | Units vs. YA | |||
| Meat | $7.24B | +4.2% | +0.8% | Meat | $87.1B | +5.8% | -3.2% | |||
| Refrigerated (mostly dairy) | $6.5B | +24.3% | -1.7% | Refrigerated (mostly dairy) | $69.9B | +15.2% | -2.4% | |||
| Produce | $5.4B | +4.4% | +0.0% | Produce | $75.1B | +4.8% | -3.5% | |||
| Deli | $3.61B | +6.9% | -3.5% | Deli | $44.4B | +9.1% | -2.0% | |||
| Bakery | $3.45B | +12.7% | -2.5% | Bakery | $40.7B | +11.8% | -1.6% | |||
| Seafood | $522M | -5.5% | -5.7% | Seafood | $6.5B | -8.2% | -15.8% | |||
What’s Next?
The first quarter of 2023 will pick up where 2022 left off. Inflation is likely to start moderating month-over-month like we have been seeing in the fourth quarter of 2021, though weather and transportation conditions remain unknowns. With it, units and volume are creeping closer to year ago levels while dollars remain elevated as a result of higher retail prices.
The next report, covering January, will be released in mid-February. In addition to the data provided here, the IFPA also now offers InSite – an online interactive data set covering both produce and floral performance as well as a look at the 2021 consumer sentiment surveys. Start your free trial today! See www.freshproduce.com/insite for more detail. We also encourage you to contact Joe Watson, IFPA’s VP, Retail, Foodservice and Wholesale, at jwatson@freshproduce.com with any questions or concerns. Please recognize the continued dedication of the entire grocery and produce supply chains, from farm to retailer. #produce #joyoffresh #SupermarketSuperHeroes.
Date ranges:
- 2019: 52 weeks ending 12/28/2019
- 2020: 52 weeks ending 12/27/2020
- 2021: 52 weeks ending 12/26/2021
- 2022: 52 weeks ending 12/25/2022
- Q1 2022: 13 weeks ending 3/27/2022
- Q2 2022: 13 weeks ending 6/26/2022
- Q3 2022: 13 weeks ending 9/25/2022
- Q4 2022: 13 weeks ending 12/25/2022
- December 2022: 4 weeks ending 12/25/2022
Note: The October data reflects a substantial data restatement across all areas of the store. 2019-Q3 2022 reflect the prior data universe.
