

The August Fresh Produce Marketplace
August’s summer weather, time off and travel boosted restaurant dining.
According to the Circana (formerly IRI) monthly consumer surveys with primary grocery shoppers, the share of all meals that was prepared at home averaged 76.8% in August 2023.
“We typically see a drop in the share of home-prepared meals during the summer months,” shared Jonna Parker, Team Lead, Fresh with Circana, “However, 76.8% marks a multi-year low and restaurants saw strong engagement with on-premise dining (53% of consumers), takeout (50%) and delivery (20%).”
Mirroring the moderated rate of inflation and the more positive consumer confidence numbers by the University of Michigan, consumer price perceptions were more optimistic.
At 87%, the share of consumers who believes that the cost of groceries is higher than last year dropped below the 90% mark for the first time in many months. However, concern about the ability to afford to groceries has (not yet) notably changed. According to Parker, 94% of Americans remained worried about the cost of food and beverages amid rising gasoline and other costs. “The combination of more occasions flowing to restaurants added to the impact of the ongoing money-saving measures taken when in-store,” said Parker. “This meant continued declines in units and volume for many categories around the store.”
Other noteworthy findings from Circana’s August survey of 1,000+ primary grocery shoppers were as follows.
Life’s conflicting choices result in consumers continuing to shift their dollars across items, brands, sizes, stores and restaurants. Circana, 210 Analytics and the International Fresh Produce Association (IFPA) team up to document the impact on sales patterns in fresh produce.
Inflation Insights
The price per unit across all foods and beverages in the Circana-measured multi-outlet stores, including supermarkets, club, mass, supercenter, drug and military, increased by 3.6% in August (the five weeks ending 9/3/2023). While more in line with pre-pandemic inflation levels, the ongoing high levels of consumer concern relate to the cumulative effect of many months of high inflation. When comparing August 2023 to August 2020, prices have increased by 25.2%.
| Average price/unit vs. YA | 2018 | 2019 | 2020 | 2021 | 2022 | Q4 2022 | Q1 2023 | Q2 2023 | Aug 23 | |
| Total food & beverages | +1.5% | +2.0% | +5.1% | +5.4% | +12.5% | +13.5% | +11.4% | +7.2% | +3.6% | |
Retailers invested in fruit prices in August. The average price per pound for fruit decreased by 2.1% over year-ago levels. Vegetables did sustain small price increases in the tune of 0.5% versus August 2022.
| Price per volume (lbs) | Price/volume | Change vs. YA | Change vs. 3YA |
| Total fresh produce August 2023 | $1.79 | -1.0% | +15.8% |
| Total fresh produce latest 52 weeks thru 9/3/23 | $1.86 | +3.5% | +17.9% |
| Fresh fruit August 2023 | $1.58 | -2.1% | +17.5% |
| Fresh fruit latest 52 weeks thru 9/3/23 | $1.71 | +1.7% | +20.0% |
| Fresh vegetables August 2023 | $2.04 | +0.5% | +14.6% |
| Fresh vegetables latest 52 weeks thru 9/3/23 | $1.99 | +5.4% | +16.1% |
August 2023 Sales
The five August 2023 weeks generated $74.3 billion total food and beverage sales, up 1.7% over August 2022, though unit sales trailed behind. Perishables, including produce, seafood, meat, bakery and deli, had a below-average dollar growth performance (-0.5%) but this was entirely prompted by the different levels of inflation as illustrated by the better-than-average unit performance (-1.3% versus -2.7% for center-store grocery).
| August 2023 % change | Latest 52 weeks % change | ||||||||
| Dollar size | Dollars vs. YA | Dollars vs. 2YA | Units vs. YA | Units vs. 2YA | Dollars vs. YA | Dollars vs. 2YA | Units vs. YA | Units vs. 2YA | |
| Total food & beverages | $74.3B | +1.7% | +11.2% | -2.0% | -6.4% | +6.9% | +14.8% | -2.7% | -5.5% |
| Center-store grocery | $37.0B | +3.9% | +15.2% | -2.7% | -7.7% | +9.3% | +18.7% | -3.5% | -6.2% |
| Total perishables | $32.8B | -0.5% | +8.5% | -1.3% | -4.9% | +5.1% | +12.8% | -1.7% | -4.5% |
August 2023 fresh produce sales reached $7.5 billion. “While the dollar growth is slowing, fresh produce performance is outpacing that of total food and beverages as well as frozen and canned,” Watson noted.
| August 2023 % change | Latest 52 weeks % change | ||||||||
| Dollar size | Dollars vs. YA | Dollars vs. 2YA | Units vs. YA | Units vs. 2YA | Dollars vs. YA | Dollars vs. 2YA | Units vs. YA | Units vs. 2YA | |
| Total fresh produce | $7.5B | +0.1% | +6.1% | -0.8% | -4.9% | +2.4% | +7.7% | -0.5% | -4.3% |
| Fresh fruit | $3.9B | +0.0% | +6.3% | +0.3% | -3.4% | +0.8% | +9.1% | +0.7% | -1.3% |
| Fresh vegetables | $3.5B | -0.0% | +5.8% | -1.8% | -6.1% | +4.0% | +6.2% | -1.5% | -6.5% |
| Produce department | Dollar sales | $ vs. YA | lbs vs. YA |
| August 2023 | $7.5B | +0.1% | +1.1% |
| w.e. 8/6/2023 | $1.5B | +0.3% | +1.0% |
| w.e. 8/13/2023 | $1.5B | -0.0% | +1.5% |
| w.e. 8/20/2023 | $1.5B | +1.0% | +1.8% |
| w.e. 8/27/2023 | $1.5B | +0.4% | +1.0% |
| w.e. 9/3/2023 | $1.5B | -1.1% | +0.1% |
Absent of any major national holidays, the August weeks were all very similar in performance. Weekly fresh produce sales averaged around $1.5 billion and both the year-on-year dollar and pound comparisons were very steady.
Total Store Comparison
“The big difference in performance between fresh, frozen and shelf-stable really boils down to the very different levels of inflation,” Watson commented. “The investment in price by fresh paid off in a far better unit performance.”
| August 2023 | Dollar sales | Share of dollars | Dollar sales gains vs. YA | Unit gains vs. YA | Average price per pound | Increase price vs. YA |
| Fresh produce department | $7.5B | 81% | +0.1% | -0.8% | $1.79 | -1.0% |
| Frozen fruits and vegetables | $798M | 9% | +10.8% | -5.2% | $2.41 | +17.1% |
| Shelf stable fruits | $428M | 5% | +0.2% | -6.8% | $2.79 | +7.6% |
| Shelf stable vegetables | $555M | 6% | +3.4% | -3.6% | $1.47 | +6.3% |
Fresh Produce Dollars versus Volume
Produce dollar sales growth has been in the plus since the third quarter of 2021. Produce pounds, on the other hand, have mostly tracked behind as shoppers leveraged how much they purchased as a way to save. Volume sales exceeded year-ago levels for the first time in April. July was the second time this year when produce pounds moved above year ago levels and August marks the third win of the year.
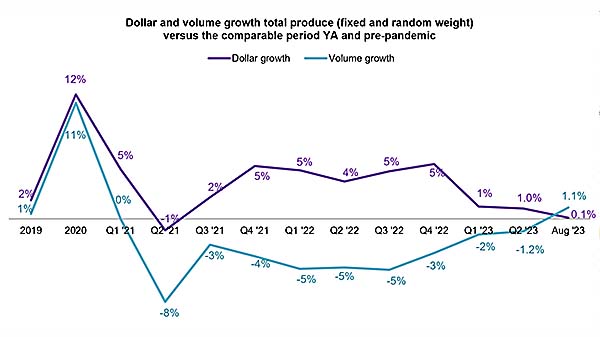
This is promising for September with a potential added holiday boost surrounding Labor Day sales.
| Growth over comparable period | ||||||||||||||||
| 2019 | 2020 | 2021 | Q1 22 | Q2 22 | Q3 22 | Q4 22 | Q1 23 | Q2 23 | Aug 23 | Vs. YA | Vs. 2YA | |||||
| Fruit | ||||||||||||||||
| Dollars | +0% | +9% | +6.5% | +10% | +4% | +4.6% | +1.3% | -1.2% | +0.0% | $3.9B | +0.0% | +6.3% | ||||
| Volume | -1% | +9% | -1.9% | -4% | -5% | -5.0% | -1.8% | -0.7% | -1.7% | 2.5B | +2.2% | -2.9% | ||||
| Vegetables | ||||||||||||||||
| Dollars | +4% | +15% | -1.2% | +0% | +3% | +4.8% | +6.8% | +3.5% | +2.1% | $3.5B | -0.0% | +5.8% | ||||
| Volume | +2% | +14% | -5.3% | -6% | -5% | -4.7% | -1.4% | -2.5% | -0.4% | 1.7B | -0.5% | -5.0% | ||||
The investment in price on the fruit side paid off in large volume gains of 2.2% over August 2022. Vegetables kept pounds flat.
Fresh Fruit Sales
“The absolute reign of berries continued in August,” said Watson. “The five August weeks generated $815 million in berry sales alone with substantial dollar and pound gains. Seasonal powerhouse cherries continued to trend in the top 10 with $178 million in sales, which was down in dollars as retailers upped their promotional investment, but flat in pounds.”
Other fruits with increased volume sales were melons, avocados and pineapples.
| Top 10 in sales | August 2023 | ||||
| Type | $ sales | $ vs. YA | Lbs vs. YA | ||
| Fresh fruit | $3.9B | +0.0% | +2.2% | ||
| Berries | $815M | +5.7% | +2.5% | ||
| Melons | $541M | +7.9% | +12.8% | ||
| Grapes | $378M | -2.6% | -0.6% | ||
| Apples | $367M | +0.6% | -4.5% | ||
| Bananas | $318M | -0.9% | -2.5% | ||
| Avocados | $237M | -4.8% | +1.3% | ||
| Cherries | $178M | -24.5% | -0.1% | ||
| Peaches | $176M | -3.4% | -11.5% | ||
| Mandarins | $123M | -1.3% | -1.6% | ||
| Pineapples | $100M | +4.5% | +5.2% | ||
Fresh Vegetables Sales
“The dollar and pound performance among the top 10 vegetable sellers was all over the board,” Parker said. “Potatoes remain a remarkable story in that pound sales increased despite the higher prices seen in this year. This boosted potato sales above tomatoes in August, with lettuce in third place.”
Other vegetables with year-over-year pound increases were onions, peppers and cucumbers.
| Top 10 in sales | August 2023 | |||
| Type | $ sales | $ vs. YA | Lbs vs. YA | |
| Fresh vegetables | $3.5B | +0.0% | -0.5% | |
| Potatoes | $392M | +7.1% | +0.6% | |
| Tomatoes | $371M | +1.2% | +1.1% | |
| Lettuce | $317M | +4.7% | -0.6% | |
| Salad kits | $282M | -5.7% | -4.5% | |
| Onions | $278M | -1.1% | +2.3% | |
| Peppers | $239M | -1.8% | +1.3% | |
| Cucumbers | $143M | +3.6% | +0.9% | |
| Carrots | $123M | +2.9% | -1.0% | |
| Mushrooms | $110M | -4.4% | -4.4% | |
| Broccoli | $107M | -3.5% | -10.9% | |
Fresh Produce Absolute Dollar Gains
The improvement in pound sales is seen in the top 10 commodities that added the most new dollars as well. Whereas earlier in the year inflation was a primary driver of the top 10 in absolute dollar gains, seven items experienced pound growth in August 2023 when compared to August 2022, being berries, melons, potatoes, limes, cucumbers, tomatoes and pineapples.
| Top 10 absolute | August 2023 | |||
| dollar growth | $ gain | $ sales | Lbs vs. YA | |
| Berries | +$44.2M | $814M | +2.5% | |
| Melons | +$39.6M | $541M | +12.8% | |
| Potatoes | +$26.1M | $392M | +0.6% | |
| Lettuce | +$14.2M | $317M | -0.6% | |
| Celery | +$7.1M | $80M | -1.4% | |
| Plums | +$6.3M | $69M | -0.3% | |
| Limes | +$5.7M | $78M | +6.1% | |
| Cucumbers | +$4.9M | $143M | +0.9% | |
| Tomatoes | +$4.4M | $371M | +1.1% | |
| Pineapples | +$4.4M | $100M | +5.2% | |
Perishables Performance
The meat department had the highest sales in August, but sustained inflation drove the highest year-over-year gains for the bakery department. Produce and dairy had the best unit performances, whereas the seafood department decreased by 5.9%.
| Perimeter | August 2023 | ||||
| departments | $ sales | $ vs. YA | Units vs. YA | ||
| Meat dpt. | $8.3B | -1.5% | -2.4% | ||
| Produce dpt. | $7.5B | +0.1% | -0.8% | ||
| Dairy aisle | $6.6B | -3.5% | +0.0% | ||
| Deli dpt. | $4.5B | +1.4% | -1.0% | ||
| Bakery dpt. | $4.1B | +4.1% | -2.0% | ||
| Seafood dpt. | $595M | -7.4% | -5.9% | ||
What’s Next?
The next report, covering September, will be released in mid-October. We also encourage you to contact Joe Watson, IFPA’s VP, Retail, Foodservice and Wholesale, at jwatson@freshproduce.com with any questions or concerns. Please recognize the continued dedication of the entire grocery and produce supply chains, from farm to retailer. #produce #joyoffresh
Date ranges:
- 2019: 52 weeks ending 12/28/2019
- 2020: 52 weeks ending 12/27/2020
- 2021: 52 weeks ending 12/26/2021
- 2022: 52 weeks ending 1/1/2023
- Q4 2022: 13 weeks ending 1/1/2023
- Q1 2023: 13 weeks ending 4/2/2023
- Q2 2023: 13 weeks ending 7/2/2023
- June 2023: 5 weeks ending 7/2/2023
