

Following the cold, long days of winter, the coming of spring invites optimism for increased demand in fresh produce.
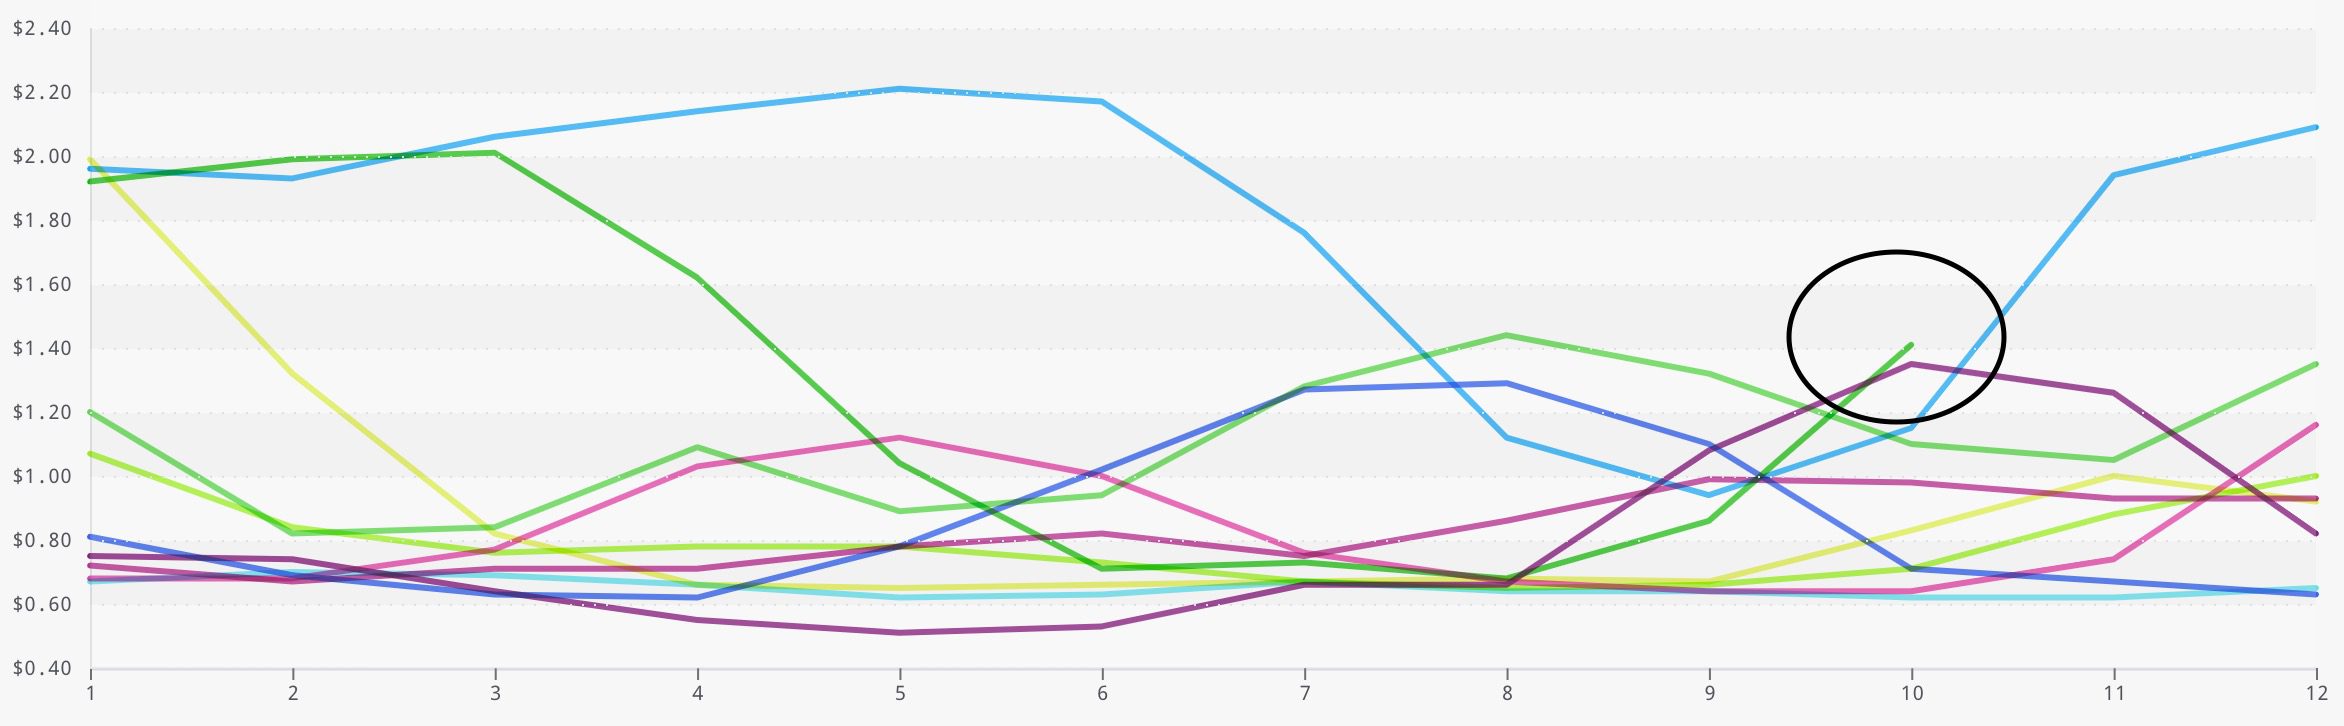
Week #10 prices rose +3.5 percent over the prior week, signifying a clear shift in consumer demand.
ProduceIQ Index: $0.89/pound, +3.5 percent over prior week
Blue Book has teamed with ProduceIQ BB #:368175 to bring the ProduceIQ Index to its readers. The index provides a produce industry price benchmark using 40 top commodities to provide data for decision making.
Los Angeles County finally opened outdoor dining to 25 percent capacity.
In contrast, Florida opened to 100 percent capacity in September 2020 and has become a haven for restaurants weary of COVID restrictions. Suppliers are eager for increased volume as the country warms up and people are venturing outdoors again.
Enthusiasm for spring pushes prices upwards.
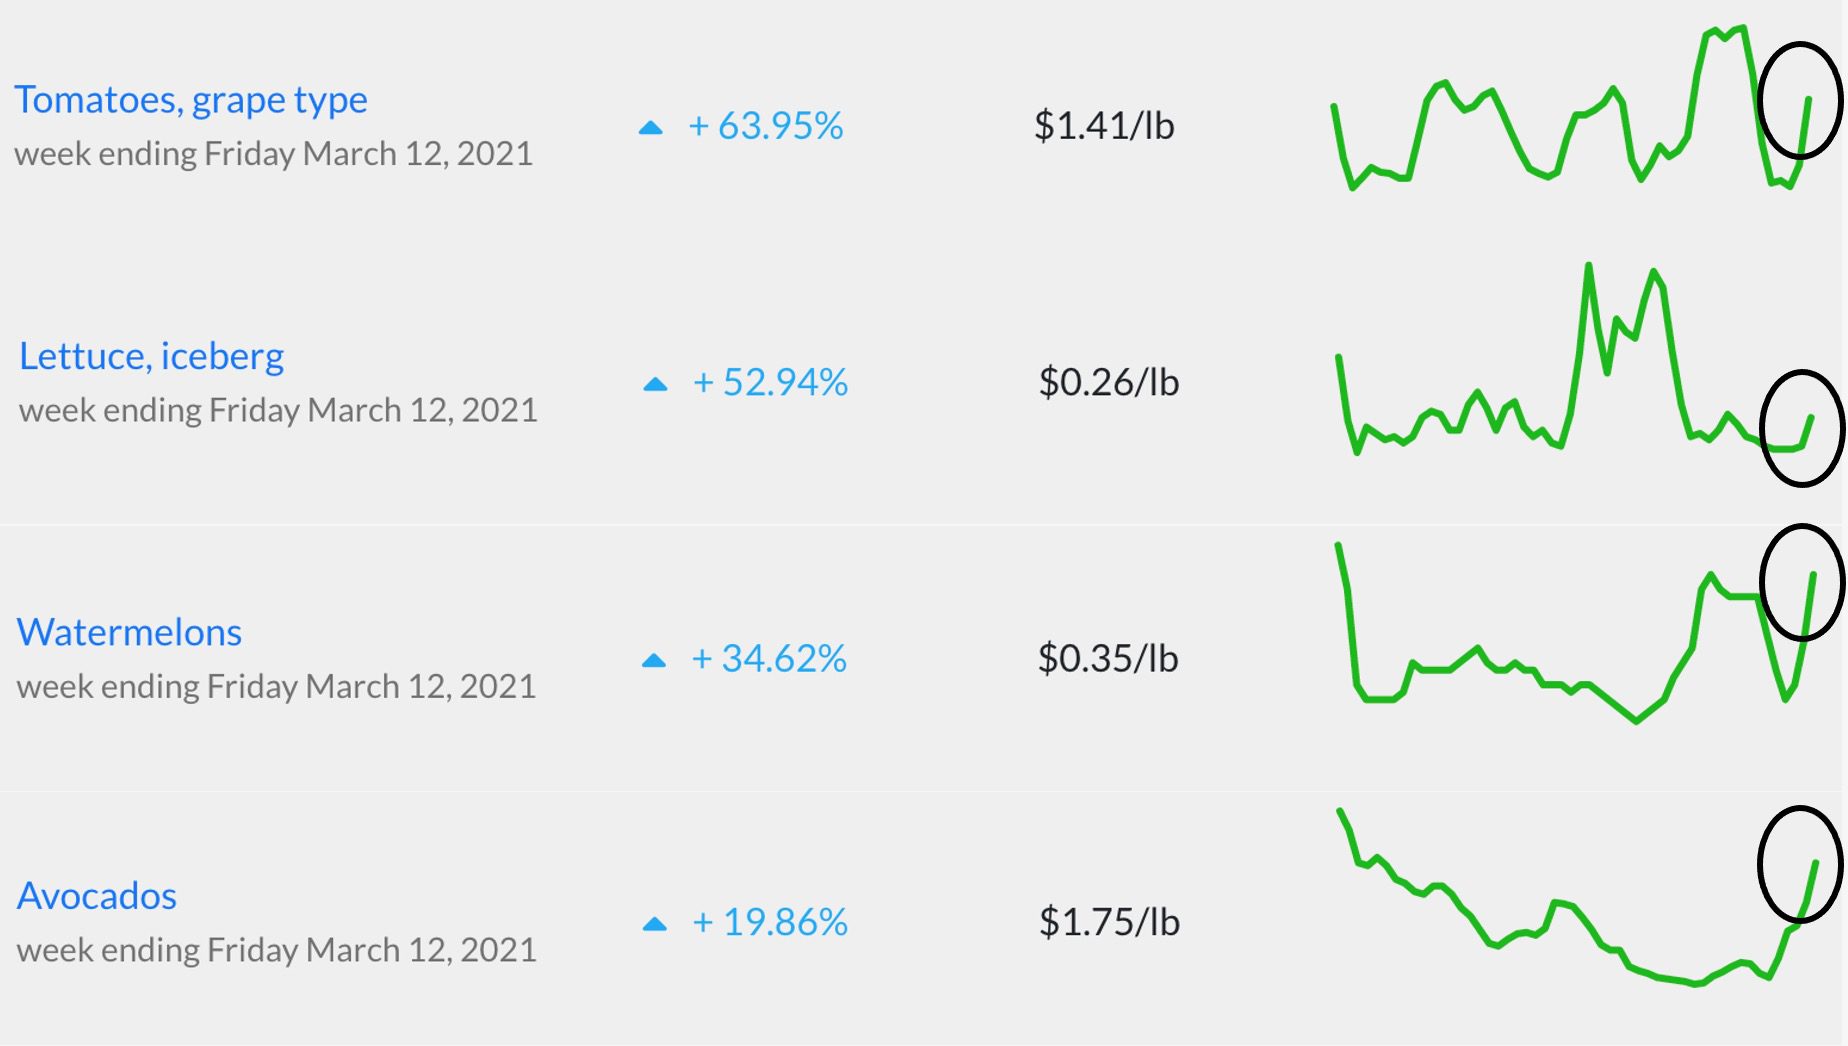
Tomato prices heave upwards, particularly grape-type, increasing +64 percent. Week #10 prices on grape-type tomatoes have not reached these heights since 2011.
Overall, prices across the tomato category are seeing surges fitting tightened supply and increasing demand. Prices are expected to continue climbing throughout the coming weeks.
Week#10 grape-type tomato prices enter record breaking territory.
Gains in the trading prices of iceberg and romaine make lettuce and leaf the top category mover rising +33 percent.
The quality of iceberg and romaine lettuce remains fairly good despite some dust, light discoloration and insect damage. Expect volatility as the commodities make their annual transition back to the Salinas growing region.
In a week highlighted by optimism, losses are mild in comparison to previous price declines in 2021.
Blueberries fell -8 percent, pricing and quality remains fair making blueberries a buy. Cantaloupes decreased -11 percent. Although demand for cantaloupe is good, increasing supply on all sizes is keeping markets low.
Finally, prices sink lower on sweet corn, -15 percent, due to sluggish demand for the commodity.
The graphs above are created using free online tools at ProduceIQ. Please visit to slice the data your way.
Let us know what information would help you.
ProduceIQ Index
The ProduceIQ Index is the fresh produce industry’s only shipping point price index. It represents the industry-wide price per pound at the location of packing for domestic produce, and at the port of U.S. entry for imported produce.
produceiq.com
ProduceIQ uses 40 top commodities to represent the industry. The Index weights each commodity dynamically, by season, as a function of the weekly 5-year rolling average Sales. Sales are calculated using the USDA’s Agricultural Marketing Service for movement and price data. The Index serves as a fair benchmark for industry price performance.
