

An unfortunate coincidence. The Lumineers couldn’t have foreseen that the lyrics to their song, “Ophelia,” would become the theme song for a natural disaster.
But over the weekend, the slow-moving tropical storm named Ophelia brought heavy rain to the Carolinas and Virginia.
The storm delivered flooding and power outages to coastal communities, drawing our attention to the all too dead-on lyrics, “Oh, Ophelia, you’ve been on my mind girl since the flood.” Some isolated parts of North Carolina received up to 8 inches of rain from the storm.
As the tropical system tracks along the East Coast, it is forecasted to bring at least some showers as far north as New York. We won’t receive damage reports until later this week.
Heavy rain isn’t reserved just for the East Coast. An atmospheric river is drenching parts of the Pacific Northwest. The weather anomaly will even bring snow to parts of Idaho, Montana, and Wyoming.
Blackberry, apple, pear, cucumber, and potato supply are vulnerable to harmful impacts from Ophelia or the atmospheric river.
ProduceIQ Index: $1.20/pound, down -1.6 percent over prior week
Week #38, ending September 22nd
Blue Book has teamed with ProduceIQ BB #:368175 to bring the ProduceIQ Index to its readers. The index provides a produce industry price benchmark using 40 top commodities to provide data for decision making.
Seemingly as commonplace as tropical storms and hurricanes, another government shutdown is looming large over Capitol Hill. Unless Congress can agree to fund the government beyond September 30th, non-essential government agricultural services will cease to function as of October 1st. We’ll know then if the USDA market price report is considered “essential.”
Overall produce prices are down -1.6 percent over the previous week, still at a record high for week #38.
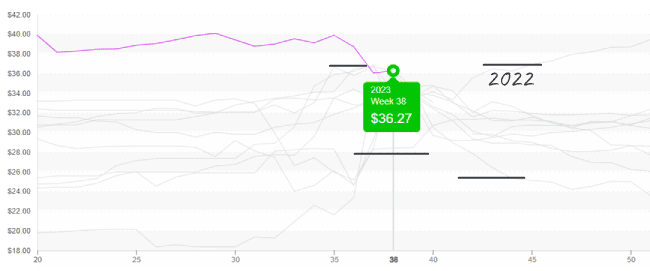
In case you missed the massive displays of seasonal décor at your local Target (or last week’s newsletter), it is fall, and our favorite fall produce, apples, is ripe for the picking. Average apple prices are still at a ten-year high but are steadily declining as availability increases. With any luck, prices may fall even further over the next few weeks for deal-hungry consumers.
Apple prices, 72ct at $36, remain at the top end of the range.
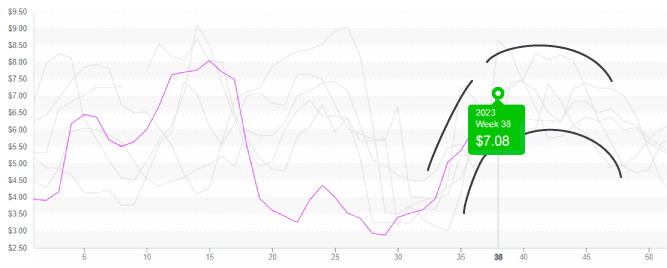
Mango prices are up +9 percent over the previous week. Compared to the last ten years of data, the “king of fruits” prices are far above average, excluding outlier years such as 2014 and 2015.
Although on a seasonal decline, available supply appears elevated compared to previous years. So, what’s driving up mango prices? Well, like most great tragedies, there are a few contributing factors. Increased import costs, lower estimated supply from South American growers, and strong demand are reportedly forcing mango prices to new heights.
The macro-outlook for mangos calls for increasing demand. Mango growers may be the successors to the strong marketing efforts that avocado companies pioneered.
As Mexican production declines over the next few weeks and buyers fix their gaze on supply from Ecuador and Brazil, expect even higher prices.
Mango prices, at $7, follow a seasonal trend, historically, a floor of $3 and not surpassing $8-9
It’s week #38, and lettuce markets show signs that the annual desert transition from California to Arizona is just around the corner. Iceberg is up +36 percent over the previous week, and quality issues such as discoloration and tip burn are becoming more common. Iceberg and romaine prices will likely climb steadily over the next 4-5 weeks as California growers wind down production.
Markets decline for the third week at a time usually marked by increasing Cauliflower prices. Down -25 percent, light demand and moderate supply keep prices below average. Like lettuce, cauliflower markets will likely see increased volatility as we transition to Yuma, AZ, so enjoy it while it lasts.
At $16, Cauliflower prices are reasonable yet about to enter the volatile transition time.

ProduceIQ Index
The ProduceIQ Index is the fresh produce industry’s only shipping point price index. It represents the industry-wide price per pound at the location of packing for domestic produce, and at the port of U.S. entry for imported produce.
ProduceIQ uses 40 top commodities to represent the industry. The Index weights each commodity dynamically, by season, as a function of the weekly 5-year rolling average Sales. Sales are calculated using the USDA’s Agricultural Marketing Service for movement and price data. The Index serves as a fair benchmark for industry price performance.
