
The October Marketplace
The share of meals prepared at home remained elevated in October, at a consumer estimated 78.4% of all occasions, according to the IRI survey of primary grocery shoppers.
Jonna Parker, Team Lead, Fresh for IRI explained that a big contributor to more meals being prepared in the home is the lunch occasion.
“While down from the 2020 peaks, 47% of the active workforce, or 26% of the total population, work from home one or more days a week,” Parker noted.
- When working from home, these consumers have a range of lunch go to’s. However, restaurants rarely make it into the working-from-home lunch lineup.
- Describing their working-from-home lunches in the past two weeks, IRI survey respondents heavily relied on eating leftovers (59%), making sandwiches (41%) or grabbing a quick snack, such as yogurt or snack nuts (39%). One-third prepared a quick meal and 24% eat a pre-packaged meal, such as a frozen entrée or can of soup. An equal 24% of shoppers made salads at home. To the contrary, just 16% of consumers got restaurant takeout or delivery for lunch and an even lower 8% left the house to have lunch at a restaurant. “This is an important finding for retail,” Parker added. “Retailers can help consumers rethink quantities from being hesitant to buy more than they need into buying enough for dinner and lunch the next day for a cost-effective and time-efficient two-for-one meal solution.”
- Parents with children between the ages of 6 and 17 are also slightly more likely to pack school lunches for their children this year. One-quarter (23%) pack food to bring to school more often than they did last year, whereas 15% buy/receive school lunch more often — for a net gain of 8 percentage points versus year ago.
In addition to a greater share of lunches having moved to the home, overall restaurant engagement was also down from 82% in the fall IRI surveys. In October, 79% of consumers purchased restaurant food, whether eaten on premise or ordered for takeout or delivery. Restaurant takeout, and especially delivery, continued to skew toward younger consumers. Thinking through their plans for the upcoming month, 24% of IRI survey respondents expect they will eat at restaurants less often versus only 4% who believe they will increase their restaurant trips.
Inflation is the major undercurrent for many of the changes in grocery shopping and consumption patterns.
- The IRI October survey found that 95% of shoppers feel that they are paying more for groceries than last year, with eggs topping the list of examples. As a result of the higher prices, 80% of consumers shopped for groceries differently, including where and what they purchase. The most popular money-saving measures are looking for sales/deals more often (55%), cutting back on non-essentials (45%), looking for coupons (35%) and buying store-brand items (31%). What constitutes a non-essential item highly depends on the household.
- 15% included lower-cost retailers and 18% visit multiple stores to get the best deals. This has prompted more trips across food and beverage categories, despite the higher gasoline prices. IRI’s Integrated Fresh Household Panel found that store trips were up 2.0% in October 2022 versus year ago.
Citing IRI’s Integrated Fresh Household Panel, Parker explained that channel shifting has had a substantial impact on the dollar share distribution of fixed and random weight products across all the stores in which consumers shop for retail food and beverages.
- In October, the traditional grocery share dropped to 36.0% of all food and beverage dollars — its lowest share of the pandemic period and well below the 38.6% share in 2019. “This is headline news,” Parker said. “Traditional grocery stores have always been known for and differentiated on fresh, led by produce and meat. Are consumers looking for a shortcut to savings by shopping supercenters and clubs? Is the current environment redefining how consumers shop across purchase drivers of price, quality, assortment and service? These are important questions as the channel shifting has been ongoing since 2021 when inflation started to accelerate.”
- Health/specialty grocery stores (see below for definitions) also dropped to their lowest level, at 2.0%.
- The main beneficiaries of channel share shifting Mass/Supercenter that rose to 22.1% of total sales.
- The Club channel has also gained 1.3 points in food/beverage share since 2019, reaching a high of 12.1%.
- Further, online food/beverage sales have close to tripled, now holding 3.4% share of the omnichannel view.
| Channel share food and beverages | 2019 | 2020 | 2021 | Latest 52 weeks | October 2022 |
| Traditional grocery (food) | 38.6% | 38.9% | 37.4% | 36.7% | 36.0% |
| Mass & Supercenter | 21.5% | 20.2% | 20.7% | 21.4% | 22.1% |
| Club | 10.8% | 11.4% | 11.7% | 11.9% | 12.1% |
| Discount grocery | 6.7% | 6.6% | 6.3% | 6.3% | 6.0% |
| Specialty stores | 3.7% | 3.2% | 3.6% | 3.8% | 3.8% |
| Health and specialty | 2.8% | 2.4% | 2.4% | 2.2% | 2.0% |
| Internet (pure e-commerce) | 1.2% | 2.2% | 2.9% | 3.1% | 3.4% |
When regarding fresh departments only, the shifts follow the same patterns: a new low share for traditional grocery and elevated shares for mass/supercenter, club, dollar and online channels.
| Channel share fresh departments | 2019 | 2020 | 2021 | Latest 52 weeks | October 2022 |
| Traditional grocery (food) | 35.9% | 36.3% | 34.5% | 33.9% | 33.2% |
| Mass & Supercenter | 25.6% | 23.8% | 24.6% | 25.1% | 25.7% |
| Club | 11.8% | 12.2% | 12.7% | 12.9% | 13.2% |
| Discount grocery | 5.8% | 5.8% | 5.4% | 5.4% | 5.2% |
| Dollar stores | 2.4% | 2.5% | 2.4% | 2.4% | 2.6% |
| Health and specialty | 2.0% | 1.8% | 1.9% | 1.8% | 1.5% |
| Internet | 1.6% | 3.0% | 3.6% | 3.8% | 4.1% |
“I’m in complete agreement with Jonna on relevance of these longer-term channel shifts,” Joe Watson, IFPA’s VP, Retail, Foodservice and Wholesale noted. “Traditional grocery’s share has eroded 2.7 percentage points since 2019. If proportional to produce, that means with annual sales of $74.5 billion, that shift alone reflects a $2 billion change in the channel dollar distribution. With continued pressure on the supply chain, it is all about being distributed in the most effective way for grower/shippers, whereas retailers are ultra-focused on trips, spend per trip and household penetration while addressing the significant reduction of purchasing power for most Americans. A greater tendency to cherry pick deals in addition to simply shifting the entire grocery basket can have substantial impact on the produce department performance.”
Amid the continued disruption, IRI, 210 Analytics and IFPA remain committed to bringing the industry the latest trends and analysis in fresh produce.
Inflation Insights
The price per unit across all foods and beverages in the IRI-measured multi-outlet stores, including supermarkets, club, mass, supercenter, drug and military, increased 13.7% in October 2022 (the five weeks ending 10/30/2022) versus the same month in 2021. October inflation was +17.0% in the center of the store (grocery) and +11.2% for perishables. Compared with October 2019, prices across all foods and beverages were up 28.8% — prompting a significant reduction of purchasing power for most Americans.
| Average price/unit vs. YA | Q1 21 | Q2 21 | Q3 21 | Q4 21 | Q1 22 | Q2 22 | Q3 22 | Oct 22 |
| Total food and beverages | +5.5% | +2.7% | +5.0% | +8.0% | +9.9% | +11.9% | +14.0% | +13.7% |
Fresh produce prices were also up from last year, at +5.3% level on a per-unit basis and +7.0% on a per-pound basis. This is far below the total store average and the lowest rate of increase seen in many months. The deceleration is driven by fruit, for which prices increased a low 3.8%. Vegetable inflation did remain in the double digits year-on-year.
| Price per volume (lbs) | Price/volume | Change vs. 2021 | Change vs. 2019 |
| Total fresh produce October 2022 | $1.78 | +7.0% | +16.4% |
| Total fresh produce latest 52 weeks | $1.81 | +9.4% | +15.2% |
| Fresh fruit October 2022 | $1.73 | +3.8% | +13.7% |
| Fresh fruit latest 52 weeks | $1.69 | +10.9% | +18.2% |
| Fresh vegetables October 2022 | $1.79 | +10.0% | +18.8% |
| Fresh vegetables latest 52 weeks | $1.92 | +7.9% | +12.4% |
October 2022 Sales
The five October 2022 weeks brought $73.1 billion in total food and beverage sales, which was up +9.3% versus year ago. October 2022 dollar sales were up +28.6% versus October 2019, the pre-pandemic normal. Perishables, including produce, seafood, meat, bakery and deli, had a slightly below-average dollar performance, but center-store item sales increased nearly 12%. A lot of the dollar growth performance was closely related to the levels of inflation, which were higher in grocery.
Year-on-year October 2022 gains were inflation-boosted, with unit sales down -3.8% versus -4.1% in September. Unit declines have averaged between 4% and 5% for several months now. Units continue to trend right around 2019 levels.
| October 2022 | % sales change versus year ago | |||||||
| Dollar size | Dollars vs. 2021 | Dollars vs. 2020 | Dollars vs. 2019 | Units vs. 2021 | Units vs. 2020 | Units vs. 2019 | ||
| Total food and beverages | $73.1B | +9.3% | +15.8% | +28.6% | -3.8% | -5.5% | -0.1% | |
| Total grocery (center store) | $36.7B | +11.6% | +19.4% | +32.6% | -4.6% | -5.9% | -0.6% | |
| Total perishables | $32.0B | +8.1% | +14.4% | +26.5% | -2.8% | -4.9% | +0.5% | |
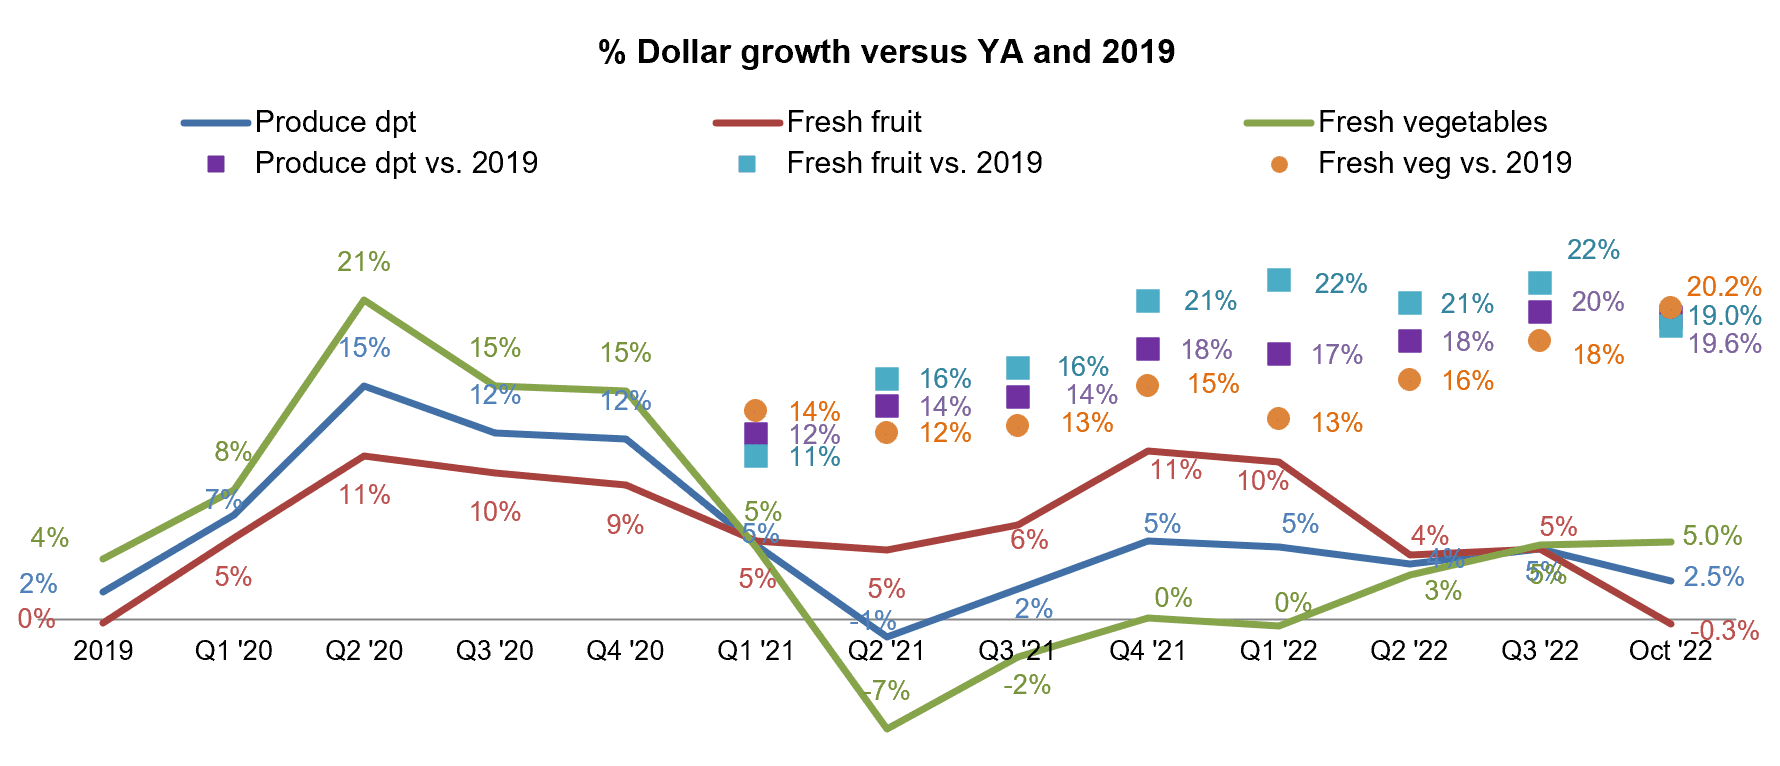
October 2022 fresh produce sales reached $6.8 billion, surpassing the record set the prior year by +2.5%. However, looking beyond dollars that were highly affected by inflation, unit and volume declined versus October 2021 by around 2%-3%. “Volume declines were much steeper than unit declines,” noted Parker, “which may point to consumers moving to smaller pack sizes. We are seeing this in the meat department as well.” Fresh fruit, which has below-average inflation, experienced significantly less unit and volume pressure than vegetables.
| October 2022 | $ size | $ growth vs. ‘21 | $ growth vs. ‘19 | Unit growth vs. ‘21 | Unit growth vs. ‘19 | Volume growth vs. ‘21 | Volume growth vs. ‘19 |
| Total fresh produce | $6.8B | +2.5% | +19.6% | -2.7% | +4.2% | -7.0% | +2.8% |
| Fresh fruit | $3.1B | -0.3% | +19.0% | -2.2% | +6.1% | -4.3% | +4.6% |
| Fresh vegetables | $3.6B | +5.0% | +20.2% | -3.1% | +2.8% | -9.3% | +1.2% |
| Produce department | Dollar sales | $ vs. YA | lbs vs. YA |
| October 2022 | $6.761B | +2.5% | -4.2% |
| w.e. 10/2/2022 | $1.353B | +1.8% | -4.6% |
| w.e. 10/9/2022 | $1.364B | +2.3% | -4.7% |
| w.e. 10/16/2022 | $1.352B | +2.2% | -4.9% |
| w.e. 10/23/2022 | $1.352B | +3.1% | -4.5% |
| w.e. 10/30/2022 | $1.339B | +3.1% | -2.4% |
After tapering off each of the September weeks, fresh produce sales remained remarkably stable during the five October weeks, at around $1.35 billion. Year-on-year growth rates averaged between 2% and 3% during each of the weeks for dollars, but pound sales were down between 4% and 5% each week.
“Vegetables are taking over as the top area of growth,” said Watson. “The much lower levels of inflation in fruit are no longer offsetting the year-on-year drop in volume which is leading to sales declines. Compared with 2019, both fresh fruit and vegetables are now trending about 20% above pre-pandemic levels.”
Fresh Produce Share of Total Fruits and Vegetables
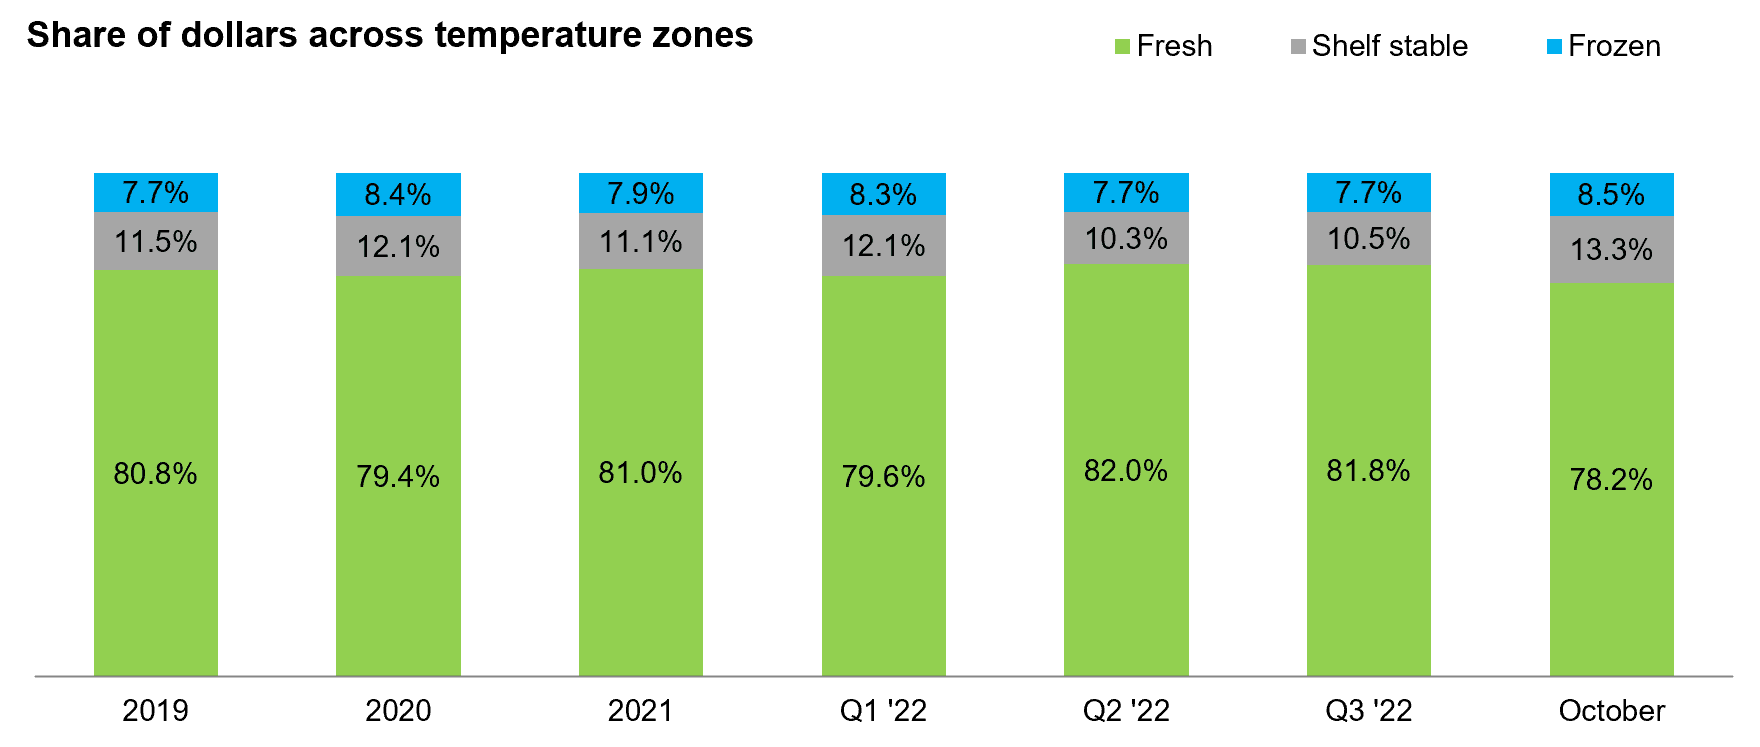
“The fresh share of total fruits and vegetables dropped further in October 2022,” Watson commented. “In September, the fresh share dropped to 80.2% and in October it hit 78.2% — a level not seen since 2020. Different levels of inflation certainly play a role, but the share of pounds were very similar so that does not explain the recent pressure. Certainly, we know that perception is reality and consumers often associate fresh with being more expensive, whether it is or not. A focus on overall value, not price alone, in combination with health and nutrition, may be a favorable strategies as economic pressure persists.”
| October 2022 | Dollar sales | Dollar sales gains vs. 2021 | Dollar sales gains vs. 2019 | Average price per unit | Increase price vs. YA |
| Fresh produce department | $6.8B | +2.5% | +19.6% | $2.59 | +5.3% |
| Frozen fruits and vegetables | $736M | +13.5% | +30.5% | $3.08 | +20.6% |
| Shelf stable fruits | $437M | +10.5% | +30.5% | $3.36 | +24.2% |
| Shelf stable vegetables | $715M | +10.9% | +22.2% | $1.45 | +19.1% |
The below-average growth and rate of inflation for fresh produce meant a drop in the share of fresh fruit and vegetables versus the share represented by frozen (8.5%) and shelf-stable (13.3%).
Fresh Produce Dollars versus Volume
Fresh produce pound sales have trailed behind year ago levels since March 2021, but volume pressure sharpened in 2022 to around 5 points below year ago. In October 2022, pounds trailed the 2021 performance by 4.2%. While down, this is the best performance since the fourth quarter of 2021.
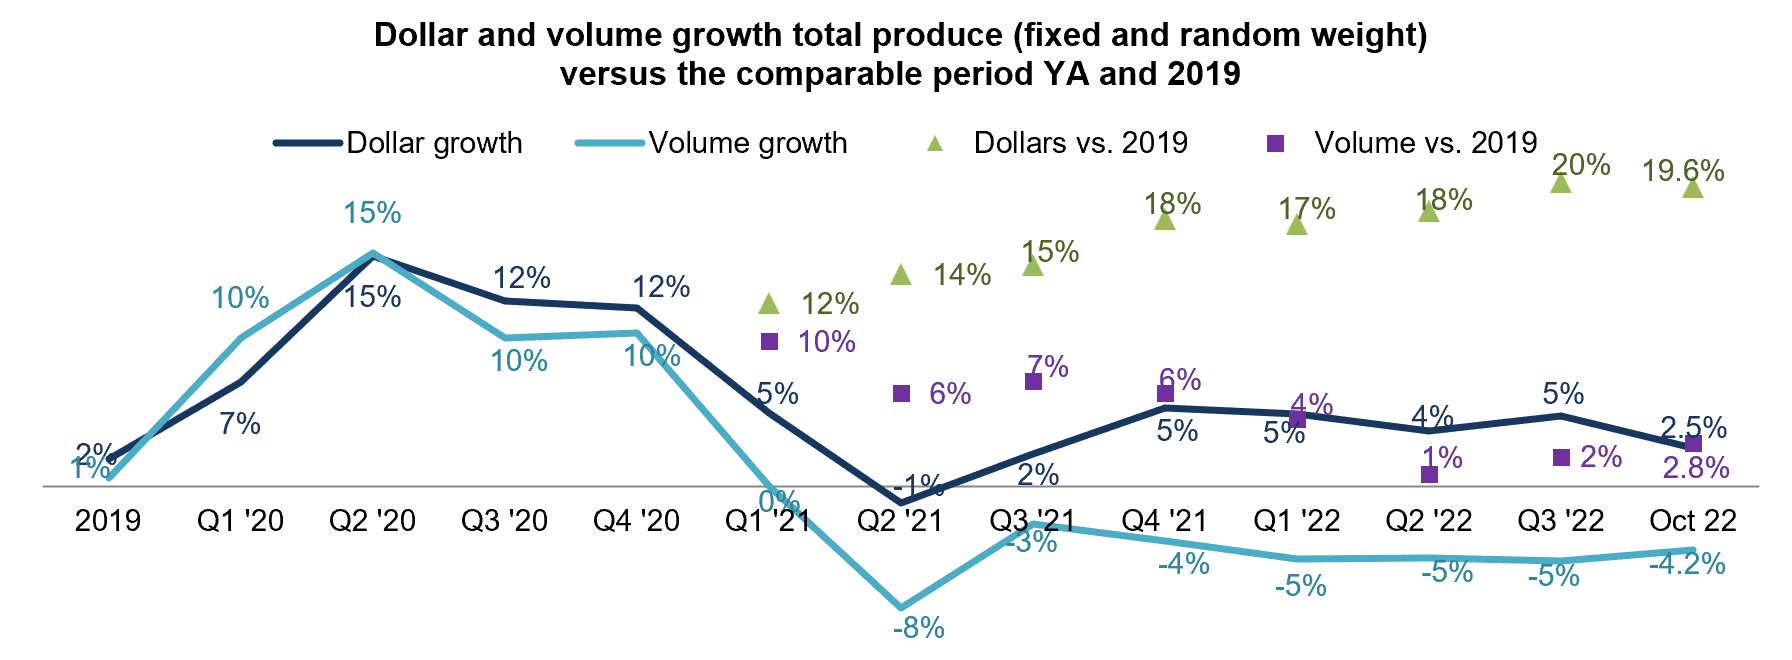
The overall produce volume pressure is driven equally by fruit and vegetables. Fruit pounds were down -3.9% year-on-year in October, while vegetable volume sales were off 4.6%. Both remained above 2019 levels.
Fresh Fruit Sales in October
“It is clear that retailers have finished their fall resets with apples coming on very strong in October,” Parker said. “Berries easily remained the biggest seller and despite strong pound performance, had some year-on-year dollar pressure due to deflation.” Oranges made it back in the top 10 sellers, just ahead of pineapples.
| Top 10 in sales | Dollar sales increase over comparable period YA | ||||||||||||||||
| 2019 | 2020 | Q1 21 | Q2 21 | Q3 21 | Q4 21 | Q1 22 | Q2 22 | Q3 22 | Oct 22 | $ vs YA | lbs vs YA | ||||||
| Fresh fruit | -0.2% | +9% | +5% | +5% | +6% | +11% | +10% | +4% | +4.6% | $3.1B | -0.3% | -3.9% | |||||
| Berries | +4% | +14% | +11% | +9% | +11% | +17% | +15% | +5% | +1.6% | $682M | -1.2% | +0.3% | |||||
| Apples | +0% | +2% | -1% | +3% | +9% | +8% | +8% | +7% | +2.5% | $450M | +0.7% | -4.2% | |||||
| Grapes | -3% | +0% | +3% | +4% | +7% | +12% | +5% | +6% | +2.3% | $418M | -0.2% | -6.5% | |||||
| Bananas | -1% | +4% | -1% | -2% | +4% | +3% | -1% | -2% | +3.6% | $312M | +4.1% | -1.0% | |||||
| Melons | +1% | +10% | +10% | +14% | +6% | +23% | +28% | +7% | +8.3% | $216M | -1.8% | -11.5% | |||||
| Avocados | +7% | +8% | -1% | -9% | -3% | +10% | +17% | +11% | +5.8% | $212M | -6.2% | -1.4% | |||||
| Mandarins | -5% | +10% | -1% | +14% | +12% | +5% | +0% | -14% | -3.1% | $162M | +9.4% | +9.2% | |||||
| Mixed fruit | -1% | -10% | +8% | +59% | +29% | +30% | +18% | +4% | -2.3% | $86M | -3.3% | -8.1% | |||||
| Oranges | -10% | +32% | +3% | -25% | -10% | +4% | +15% | +14% | -2.9% | $79M | -2.6% | -15.9% | |||||
| Pineapple | +0% | +8% | +12% | +11% | +8% | +12% | +12% | +11% | +7.1% | $79M | -1.2% | -4.0% | |||||
Fresh Vegetables Sales in October
“The October dollar and volume performances were mixed,” said Watson. “The meal staples, such as potatoes and onions, continued to pull well and of course we saw the impact of Halloween with pumpkins making inroads into the top 10 in dollar sales. Pumpkins came in as the sixth largest seller, but dollars, units and pounds fell behind year ago levels.”
| Top 10 in sales | Dollar sales increase over comparable period YA | |||||||||||||||
| 2019 | 2020 | Q1 21 | Q2 21 | Q3 21 | Q4 21 | Q1 22 | Q2 22 | Q3 22 | Oct 22 | $ vs YA | lbs vs YA | |||||
| Fresh vegetables | +4% | +15% | +5% | -7% | -2% | +0% | -0% | +3% | +5% | $3.6B | +5.0% | -4.6% | ||||
| Potatoes | +2% | +21% | -4% | -20% | -5% | +0% | +5% | +13% | +19% | $382M | +21.6% | -1.3% | ||||
| Tomatoes | +0% | +18% | +4% | -9% | -4% | -1% | -5% | -0% | +2.5% | $343M | +1.9% | +1.2% | ||||
| Salad kits | +12% | +15% | +13% | 15% | +10% | +9% | +2% | +2% | +0% | $307M | -2.2% | -9.2% | ||||
| Lettuce | +6% | +12% | +9% | -3% | +3% | +1% | +5% | +10% | +9% | $284M | +12.3% | -4.0% | ||||
| Onions | +6% | +15% | +1% | -14% | -2% | +1% | +6% | +18% | +22% | $275M | +20.0% | +0.6% | ||||
| Peppers | +4% | +19% | +12% | -7% | -3% | -2% | -2% | -1% | +2% | $229M | +3.5% | -4.2% | ||||
| Pumpkins | +1% | +20% | — | — | — | — | — | — | — | $173M | -3.6% | -14.8% | ||||
| Carrots | -2% | +7% | -5% | -8% | 0% | +1% | +4% | +4% | +4% | $131M | +3.5% | -2.0% | ||||
| Cucumbers | +3% | +18% | +10% | +3% | +4% | +5% | +4% | +6% | +8% | $130M | +9.7% | +1.3% | ||||
| Broccoli | +7% | +12% | +5% | -5% | -0% | +7% | +5% | +5% | +4% | $116M | +0.6% | -4.3% | ||||
Fresh Produce Absolute Dollar Gains
In October 2022, fresh produce added $165 million in additional dollars versus 2021. Gains were achieved in many different ways. Potatoes, onions, lettuce and cabbage each double-digit inflation when comparing the average price per pound to that in October 2021. Mandarins gained on strong demand and this is one of the very first reports in which berries did not feature in the top 10 in absolute dollar growth.
| October 2022 | Versus comparable period in 2021 | ||||
| Top 10 produce items in absolute dollar growth | Absolute dollar gain | Dollar % growth | Total dollar sales | Change in price per pound | |
| Potatoes | +$68M | +21.6% | $382M | +23.2% | |
| Onions | +$46M | +20.0% | $275M | +19.2% | |
| Lettuce | +$31M | +12.3% | $284M | +17.0% | |
| Mandarins | +$14M | +9.4% | $162M | +0.2% | |
| Bananas | +$12M | +4.1% | $312M | +5.1% | |
| Cucumbers | +$12M | +9.7% | $130M | +8.4% | |
| Peppers | +$8M | +3.5% | $229M | +8.0% | |
| Tomatoes | +$6M | +1.9% | $343M | +0.7% | |
| Garlic | +$5M | +15.7% | $39M | +7.7% | |
| Cabbage | +$5M | +11.2% | $46M | +10.3% | |
Perishables Performance
The smallest of the fresh departments, seafood, continued to experience substantial dollar and unit pressure in October 2022. The unit performance for the other areas improved notably versus September but remained down year-on-year across the board.
| October 2022 | $ sales | Change vs. YA | Change vs. 2YA | Change vs. 3YA | Unit sales | Change vs. YA | Change vs. 2YA | Change vs. 3YA |
| Bakery | $4.0B | +13.7% | +22.0% | +29.2% | 1.1M | -1.7% | -1.5% | -4.3% |
| Deli | $4.3B | +7.6% | +20.5% | +24.5% | 724M | -4.2% | +0.6% | +2.3% |
| Meat | $8.1B | +2.5% | +10.3% | +25.9% | 1.3B | -2.4% | -7.1% | -0.7% |
| Produce | $6.8B | +2.5% | +7.1% | +19.6% | 2.6B | -2.7% | -5.5% | +4.2% |
| Refrigerated | $8.3B | +18.1% | +20.3% | +33.3% | 2.3B | -3.1% | -5.6% | -0.8% |
| Seafood | $570M | -3.4% | -2.9% | +26.4% | 64M | -7.3% | -17.9% | +2.1% |
What’s Next?
The holiday season is around the corner and consumers are split between being excited to have something to celebrate and pulling back on spending given the reduction in purchasing power.
For instance, thinking about Thanksgiving, 32% feel the same as last year, 20% look forward to having something to celebrate after a stressful year, 17% are worried about being able to afford the type of celebration they usually have because of inflation and 5% do not plan to celebrate at all. Among celebrants, hosting or attending a meal with extended family or friends is the most popular plan (35%), followed by preparing a special meal for the household (31%).
The numbers of Christmas, New Year’s, etc. are similar, with dinner plans for the household or an extended group being the most common way to celebrate.
The next report, covering November, will be released in mid-December. In addition to the data provided here, the IFPA also now offers InSite – an online interactive data set covering both produce and floral performance as well as a look at the 2021 consumer sentiment surveys. Start your free trial today! See www.freshproduce.com/insite for more detail. We also encourage you to contact Joe Watson, IFPA’s VP, Retail, Foodservice and Wholesale, at jwatson@freshproduce.com with any questions or concerns. Please recognize the continued dedication of the entire grocery and produce supply chains, from farm to retailer. #produce #joyoffresh #SupermarketSuperHeroes.
Date ranges:
2019: 52 weeks ending 12/28/2019
2020: 52 weeks ending 12/27/2020
Q1 2021: 13 weeks ending 3/28/2021
Q2 2021: 13 weeks ending 6/27/2021
Q3 2021: 13 weeks ending 9/26/2021
Q4 2021: 13 weeks ending 12/26/2021
Q1 2022: 13 weeks ending 3/27/2022
Q2 2022: 13 weeks ending 6/26/2022
Q3 2022: 13 weeks ending 9/25/2022
September 2022: 4 weeks ending 9/25/2022
October 2022: 5 weeks ending 10/30/2022
Note: The October data reflects a substantial data restatement across all areas of the store. 2019-Q3 2022 reflect the prior data universe.
