

Sweeter fruits are at cyclical highs as Valentine’s Day nears.
Though not a direct correlation with brix count, some causality is undeniable. Pineapples, mangoes, cantaloupes, watermelon, grapes, blackberries, raspberries, strawberries and even apples are enjoying high price points.
Sellers often argue that supply-side constraints, such as reduced crop yields, should automatically drive prices higher. Excluding one small caveat, we sympathize with this line of reasoning.
Plenty of commodities that have supply challenges don’t realize price increases. Underlying demand, exceeding supply, is required to tip (and keep) prices moving upward.
ProduceIQ Index: $0.95 /pound, no change over prior week
(Week #4, ending January 29th)
Blue Book has teamed with ProduceIQ BB #:368175 to bring the ProduceIQ Index to its readers. The index provides a produce industry price benchmark using 40 top commodities to provide data for decision making.
Though strawberries are the leading produce commodity associated with Valentine’s Day, rising tides are giving all boats a lift. Blackberries are benefiting as well, and supply isn’t expected to increase until after the Valentine’s pull. Cool weather and shipping delays are keeping a demand-exceeds-supply situation for the grape and berry category.
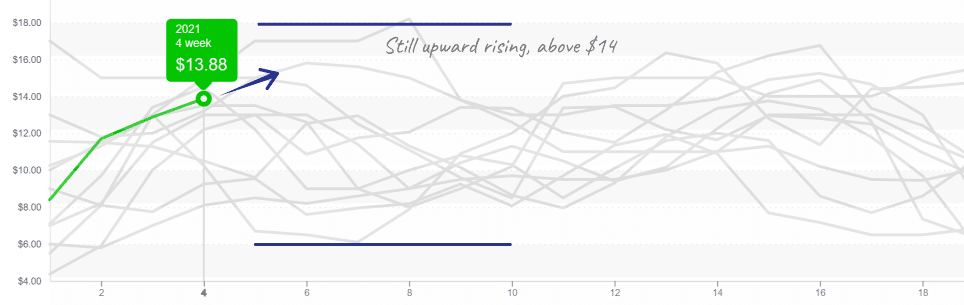
Blackberries continue to climb at the higher end of their price range.
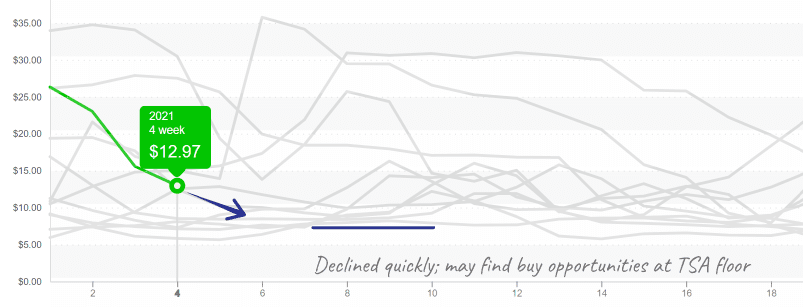
New tomato crops in both Mexico and Florida are causing prices of rounds to plummet. Off-market deals are often made during these falling markets as price is uncertain.
In low-priced markets, watch for tomato suspension agreement (TSA) floor prices to be tested. TSA’s reference price for round tomatoes is 0.31 /lb., or $7.75 per 25-pound box. Prices recently fell from the mid $20s to under $10 within a few weeks.
Having a floor distorts the free market as Mexican growers would, of course, still desire to sell tomatoes below the set floor price, as opposed to only selling to Mexico’s domestic market, or even less desirably, not selling the tomatoes at all.
Tomatoes during February sold below $7.75 in at least the years 2012, 2013, 2017.
Other than corn and cabbage, most dry vegetables are moderately priced. Cucumber supply from Mexico and Honduras is proportional for current levels of demand.
Pepper markets are divergent. Green pepper is crossing in sufficient volume from Mexico, whereas colored pepper is short. Red pepper supply increases lag behind green pepper because the new Mexican crop requires an additional 10 to 15 growing days to turn color. Markets are still tight though new supply is coming online.
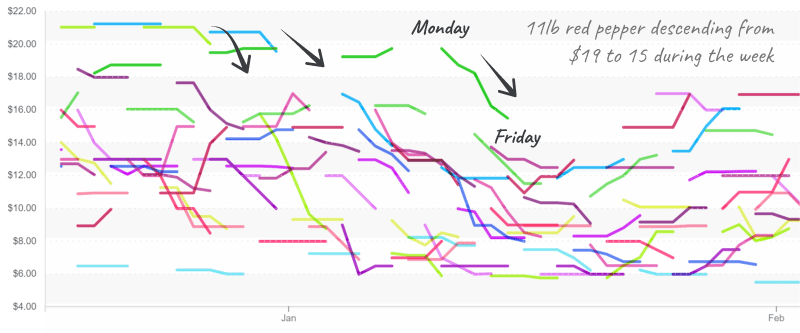
Still at 15-year historic highs, red pepper quickly descends in January.
Attention readers: the graphs we provide are created online by using the free tools, Price Index and Trends, located at ProduceIQ. Please take advantage and slice the data your way. We look forward to hearing from you.
ProduceIQ Index
The ProduceIQ Index is the fresh produce industry’s only shipping point price index. It represents the industry-wide price per pound at the location of packing for domestic produce, and at the port of U.S. entry for imported produce.
produceiq.com
ProduceIQ uses 40 top commodities to represent the industry. The Index weights each commodity dynamically, by season, as a function of the weekly 5-year rolling average Sales. Sales are calculated using the USDA’s Agricultural Marketing Service for movement and price data. The Index serves as a fair benchmark for industry price performance.
