
The week of April 12th marked the year’s earlier Easter as well as the sixth week of the coronavirus-related grocery shopping patterns. Since the onset of coronavirus in the United States, grocery retailing conditions have been unlike any ever experienced in recent history.
Unprecedented pantry, fridge and freezer loading by consumers across the United States emptied stores for days and weeks on end, resulting in incredible sales surges and widespread out-of-stocks conditions. During the week of April 12, many stores further sharpened safety measures, such as metered entry, asking shoppers to limit visits to one person per cart and encouraging consumers to wear masks and to shop just once a week, while avoiding stocking up on any one item. Produce sales at retail remained highly elevated during the week ending April 12, while the demand from foodservice continued to be far below normal levels. 210 Analytics, IRI and PMA partnered to understand the effect for produce in dollars and volume throughout the pandemic.
Fresh produce growth for the week of April 12 versus the comparable week in 2019 was the highest since March 22nd, driven by robust vegetable sales. But the three-way split of the produce dollar between fresh, frozen and shelf-stable continued, with frozen and shelf-stable growth up more than 40%, each.
“There has been some concern in the industry that consumers are perhaps refraining from purchasing fresh produce out of safety worries,” said Jonna Parker, Team Lead, Fresh for IRI. “There certainly seems to be anecdotal evidence of that, but we’re also seeing somewhat lower household engagement for the four weeks ending April 5, at 94.6% versus the 99.3% household engagement over the 52-week look. This difference could indeed indicate some people pulling back on fresh produce. At the same time, our survey work shows that 18% of consumers plan to purchase more fresh foods and the rising produce growth rates are evidence of that.”
- Fresh produce increased 16.3% over the comparable week in 2019.
- Frozen, +44.6%
- Shelf-stable, +41.8%
Source: IRI, Total US, MULO, % growth vs. year ago week ending April 12, 2020
“Easter is typically a big week for the produce department,” said Joe Watson, VP of Membership and Engagement for the Produce Marketing Association (PMA). “But with social distancing in place, Easter celebrations and dinners were very different in makeup and size, which likely affected sales. On the other hand, the increased everyday demand on retail produce sales is likely to continue while shelter-in-place mandates are in effect, economic pressure is mounting, and shoppers seek fresh produce to go along with the items they have in their pantries. At the same time, the ability for retailers to encourage impulse purchases continues to be a challenge because consumers are spending less time shopping, and focused more on list purchases. I expect shopping patterns to remain very different in number, size, day of the week, day part and online ordering trends for a while to come.”
Fresh Produce
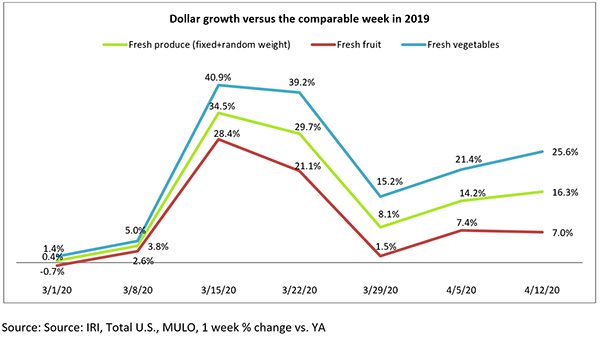
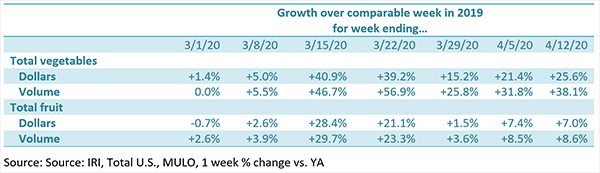
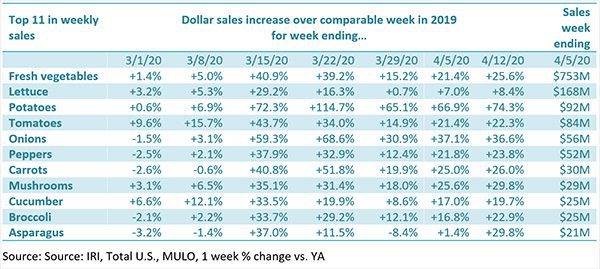
Since the onset of the coronavirus sales patterns, fresh vegetable growth has far exceeded that of fruit, and the week ending April 12 was no exception. Vegetable sales growth (+25.6%) was nearly 20 percentage points higher than that of fruit (+7.0%), while the two areas are roughly equal in size. Compared with the same week in 2019, fresh produce generated an additional $196 million in sales, of which $153 million was generated by vegetables. It is important to point out that SKU rationalization, stockouts and purchase limits may have affected reported gains. For instance, several shoppers commented continued out-of-stocks on the Retail Feedback Group’s Constant Customer Feedback (CCF) program this week.
“I understand we’re at trying times and the store only stocks what has been delivered,” said one shopper.
“I’m just surprised that they claim the trucking industry has been unaffected, but the store seems slim on pickings. For example, produce, not much happening there still. And I don’t understand why dairy, including cheese and eggs, is so slight when the farmers are dumping milk. I’d assume the processing plants can’t handle it due to schools/colleges closed.”
Watson commented, “While operations warrant the first and foremost focus, continued consumer communications in-store, on social media and websites about store conditions and purchase limits can help set expectations and build understanding among shoppers. Stores have an opportunity to offer alternate suggestions for items that are out-of-stocks and provide recipes and meal ideas to help shoppers shake up their routines and prepare items they may not be familiar with.”
Additionally, distributors are finding creative ways of going consumer-direct and some restaurants now selling groceries. Those sales are not reflected in these numbers.
As seen in prior weeks, there continues to be an important gap between dollar growth and volume growth, pointing to a key role for price in the performance picture. The heavily reduced foodservice demand is providing ample produce supply. At the onset of coronavirus in the U.S., dollar and volume sales were relatively close together for total produce, at +0.4% for dollars and +1.3% in volume. Starting with the week ending March 22, volume sales far exceeded dollar sales, which would indicate deflation setting in at retail for some areas. For the week of April 12, the volume versus dollar growth gap was largest to date, at 5.8 percentage points.
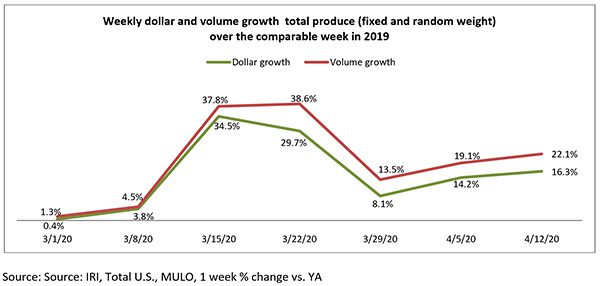
The gap is mostly driven by vegetables. For the week ending April 12, volume sales gains for vegetables were more than 12 points higher than dollar growth.
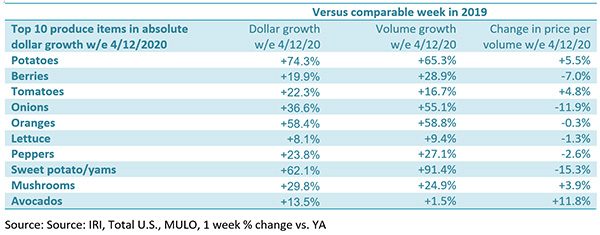
Potatoes have been the absolute growth leader since the onset of coronavirus in the U.S., adding $39 million in new dollars versus the comparable week in 2019, or +74.3%. Others that gained big in dollars were berries (+$26 million), onions and oranges (+$15 million, each) and lettuce (+$12 million). However, at the category level, big differences between dollars and volume were observed for some fruits and vegetables as well.
“This week, asparagus, sweet potatoes and onions are three big ones that jump out at me,” said Watson. “While asparagus had a strong 29.8% boost in dollars, volume sales were up 73.7%. That means there is a lot of negative pressure on the average retail price, likely due to the lack of demand from foodservice. IRI found a 25.3% decline in the price per volume for asparagus the week of April 12 versus the comparable week in 2019.
Fresh Fruit
Fresh fruit sales were relatively unchanged from the prior week and showed an increase of 7.0% over the week ending April 12 versus the comparable week in 2019. Berries have the highest weekly sales and grew the most in absolute dollars, up $26 million over the week of April 12 versus the comparable week in 2019. Oranges, while the seventh largest in terms of dollar sales, were the second highest in terms of dollar gains, up nearly $13 million in comparable week sales, representing a 58.4% increase.
“Oranges are on a remarkable growth path,” said Parker. “Since mid-March, orange sales has been up around 60% each week year-over-year. I suspect this is directly related to the versatility of oranges as a snack, side or in smoothies, as well as the health halo it enjoys among consumers, particularly related to building the immune system. Calling out nutritional benefits of various fruits and vegetables was something we encouraged grower/shippers and retailers to do pre-pandemic and even more so now.”

The third biggest driver of new dollars were avocados that jumped up two spots to fifth place in the top 10 sales list. Avocados was one of the few items that saw an increase in price per volume.
“One of the reasons for more of the produce dollar going to frozen and shelf-stable is shelf life,” said Parker. “Many consumers struggle with how to plan out their week with fresh produce items for immediate consumption and items that last a little longer. So instead, they purchase some fresh and some frozen and/or canned items.”
Avocados Mexico is addressing this head on in the Florida market. A recent online grocery order pickup from the Walmart in Lakeland included consumer education on selecting avocados for now and for later, how to preserve avocados and how to serve them. The pamphlet showed how to ripen avocados using a paper bag and banana or apple and provided a paper bag as part of the education.
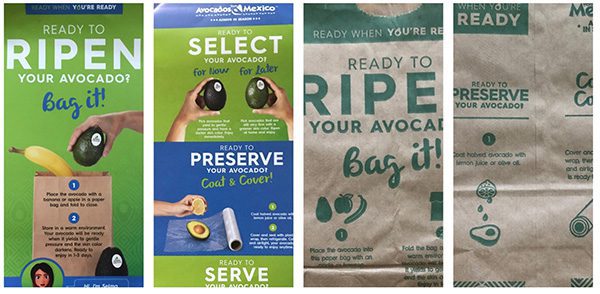
“It is campaigns like this that will help boost sales during these unprecedented times,” commented Parker. “Particularly keeping in mind that we’re seeing pressure on trips with consumers moving to fewer but larger trips.”
Fresh vegetables
Potatoes have been the lead growth driver for fresh vegetables since March 15 and the week of April 12 was no exception. Dollars were up 74.3%, which translates into an additional $39 million in potato sales compared with the comparable week in 2019. Other impressive growth categories were onions, mushrooms and asparagus. The latter made their appearance in the top 10 for the first time since the onset of coronavirus, bumping squash to the 11th spot in terms of weekly sales.
“This is where we see the effect of Easter sales,” said Watson. “But also the influence of the extra supply due to the lagging demand of foodservice. Asparagus is one of these items where we’ve seen volume growth far exceeding dollar growth for several weeks now.”
Packaged Salads
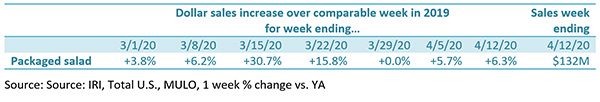
Packaged salad sales trends are very similar to that of total produce, with two very strong weeks in the middle of March and growth back in line with the 2019 trends toward the end of March. For the week ending April 12, sales growth was up for the second consecutive week, at +6.3%.
Fresh Versus Frozen and Shelf-Stable
Consumers continued to split their produce dollar three ways during the week of April 12. Frozen and canned vegetables had ongoing strong growth during the second week of April and have been leading sales growth since the onset of coronavirus during the early weeks of March.

Perimeter performance
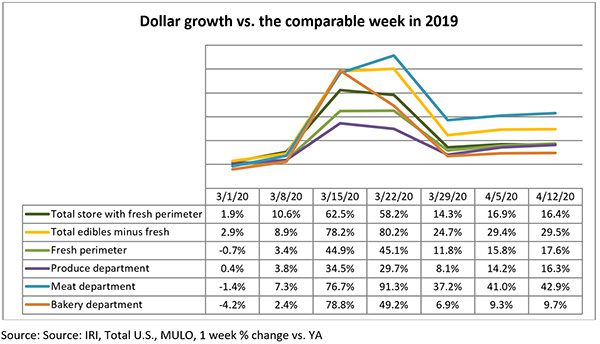
Boosted by an increase of 42.9% in meat, the total perimeter increased 17.6%. Center store edibles increased 29.5%.
Lessons from Overseas
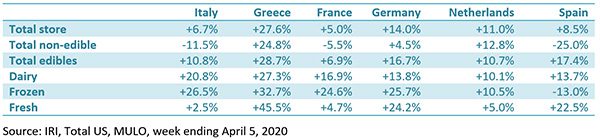
European sales patterns can help shed some light on what may lie ahead. After very similar weeks of stockpiling as seen in the U.S., most countries seem to have shifted to continued elevated purchasing levels for total edibles, with mixed engagement with fresh. Meat is incorporated in the “fresh” line. For food, the everyday baseline for the week ending April 5 trended between 10 and 20 percent above the comparable week in 2019 for all countries except France. Non-edible sales have mostly leveled off and declined for some. Frozen food continues to see above-average gains in all countries, but Spain.
What’s next?
The third week of April still saw great uncertainty about the “re-opening” of the country. While states were encouraged to begin lifting their executive orders in a phased approach under strict criteria when it is safe to do so, many states extended their stay-at-home orders. Only South Dakota remains free of statewide government restrictions that require businesses to close. Other states are a patchwork of state-specific mandates to “shelter in place,” with expiration dates ranging from the end of April (Indiana and others) to mid-June (Virginia) to indefinitely (California, Maryland, New Jersey and others).
The top question on everyone’s mind is how far the new baseline lies above the old normal. Reality is that it is too early to tell. There has not been a good indicator week yet of what will be the “new normal.” Mid March had the enormous panic purchasing surge, followed by subsequent social distancing and shelter-in-place surges. Next were the two weeks leading up to Easter. In the upcoming two weeks, sales will go up against Easter 2019, which fell on April 21, which yet again complicates any sense of normalcy and data predictions.
Please recognize the continued dedication of the entire grocery and produce supply chains, from farm to retailer, on keeping the produce supply flowing during these unprecedented times. #produce #joyoffresh #SupermarketSuperHeroes. 210 Analytics and IRI will continue to provide weekly updates as sales trends develop, made possible by PMA. We encourage you to contact Joe Watson, PMA’s Vice President of Membership and Engagement, at jwatson@pma.com with any questions or concerns.
