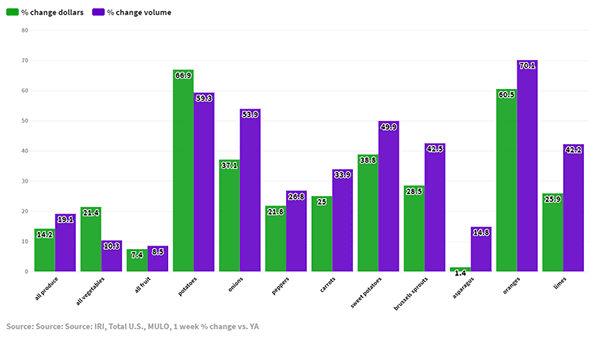
Every week since the COVID-19 crisis ramped up in the U.S., Anne-Marie Roerink and IRI have provided analysis of retail sales dollars to track consumer buying patterns.
Over the last few weeks, I’ve requested volume numbers to see if we can gauge how much fresh produce volumes are changing, because I can imagine that retail sales dollars don’t tell the whole story.
With so much volume available, there has to be some deflation in price.
And there is.
Throughout produce in the week ending April 5, 2020, there was a 4.8% difference in volume versus dollar percentage increase in produce. The number is much higher in vegetables — 10.3% — than in fruit, which was only 1.1%.
That makes sense to me because foodservice uses a whole lot more vegetables than fruit. Just think of things like asparagus and brussels sprouts. Sure, you can cook them at home, but think about all of the steakhouses missing their favorite side dish, and trendy hipster brew pubs without their roasted brussels sprouts side dishes.
Of course, some of these disparities can be explained by seasonal crop issues. Celery, for example, had a huge gap in dollars and volume percentage change, but think about what the celery market was doing last spring, with weather affecting supply and the juicing trend affecting demand.
Anne-Marie and I took some time to examine this week’s numbers, and predict what’s coming in the next few weeks. Easter will definitely be a factor, and we’ll have to account for that as we get later in the month.


