

There is a huge discussion going on about polarization along political and cultural lines in the United States.
One area where this cleft is most apparent is state minimum wages.

The federal minimum wage has remained stagnant at $7.25 per hour since 2009. This puts the nation on the low end of OECD (developed) nations, as the accompanying graph from Statista shows.
Americans may not be thrilled to hear that our national minimum wage is more than $1 less than Japan’s, or more than $2 below Korea’s.
But that is not the whole picture, because it does not reflect variance in state minimum wages.
The highest American minimum wage is in the District of Columbia, at $16.50 (all figures are for 2023). Next is Washington state, at $15.74. California’s is third, at $15.50 (a reliable source of complaint for growers in that state).
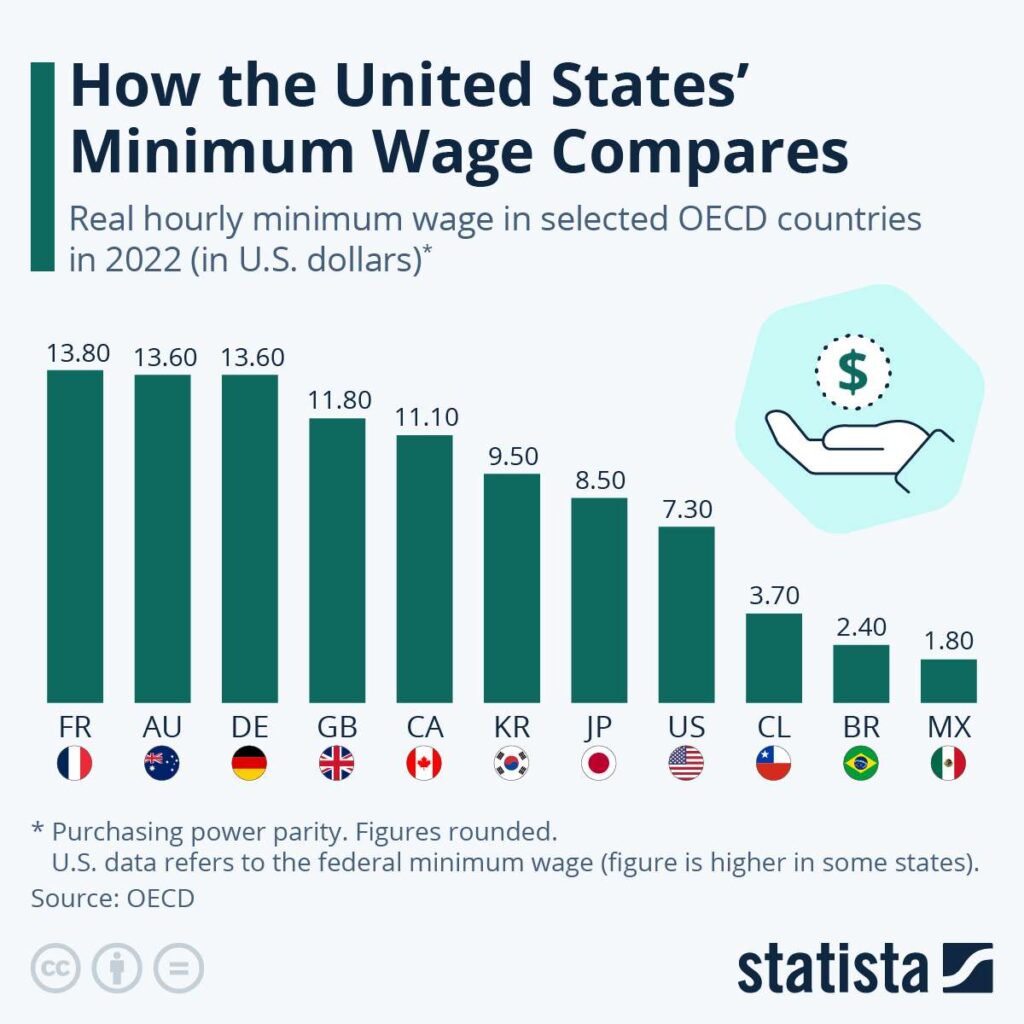
It turns out that nine states have minimum wages equal to higher than that of the leader in the OECD chart: France’s, at $13.80. This is significant, especially since they include two of the most populous states: California and New York.
I’m particularly struck by the way the list breaks down. The states with high minimum wages are predominantly blue states, indicating they are governed by Democrats. Those with lower minimum wages are either red states (governed by Republicans) or swing states (Pennsylvania, Ohio, Wisconsin). Two are below the federal minimum: Georgia and Wyoming, both at $5.15.
Some states are missing from this chart: Alabama, Tennessee, South Carolina, Mississippi, and Louisiana. That’s because they do not have a state minimum wage law. (Of course, the federal minimum still applies here.)
Consequently, American minimum wages are, if you are in one sector of the nation, comparable to or higher than those of other developed countries. If you are in another sector, they are much lower.
Of course, there are plenty of caveats to the few statements set out above. One is that these minimums have plenty of exceptions and variations: industry, company size, and other factors.
“On July 1, 2023, the Nevada minimum wage increased to $11.25 for employees not offered qualifying health insurance, and to $10.25 for employees offered health insurance,” reports Statista.
Moreover, as Statista notes, “Minimum wage jobs are traditionally seen as ‘starter jobs’ in the U.S., or first jobs for teenagers and young adults, and the number of people working minimum wage jobs has decreased from almost four million in 1979 to about 247,000 in 2020. However, the number of workers earning less than minimum wage in 2020 was significantly higher, at about 865,000.”
Another point: “minimum wage jobs are primarily found in food preparation and serving occupations, as well as sales jobs (primarily in retail).”
How does this relate to the produce industry? Only roughly. The increasing number of H-2A guestworkers must be paid the adverse effect minimum wage rate (AEWR), which in all cases is higher—sometimes startlingly higher—than state minimum wages. And many if not most skilled or experienced workers are paid more.
In any state, the cleft between blue- and red-state minimum wages indicate more than mere cultural and ideological differences between the regions. They reflect longstanding attitudes toward labor as well.
