
")
Sorry if this week’s article feels a little long-winded. It was the perfect excuse to politely leave the room when my uncle began passionately defending flat Earth theory.
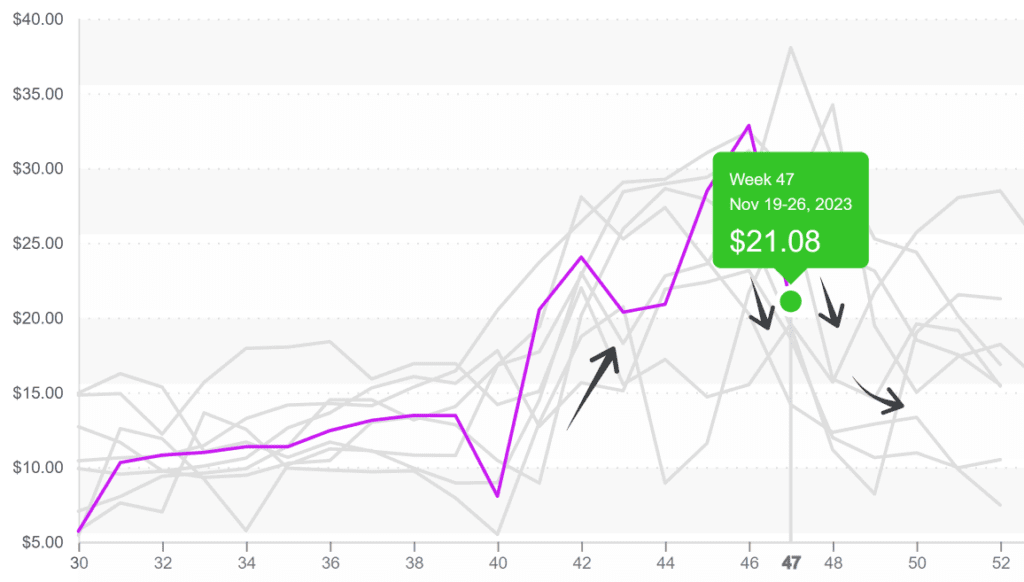
Predictably, post-Thanksgiving green bean prices are falling faster than the snow across the Midwest. Average prices are down -37 percent over the previous week. Although supply is still tight in the East and West, post-holiday demand is in a tryptophan-induced coma that may take some time to wake up from.
This week’s bean prices are below the historical average for week #47. However, there is no guarantee that prices will follow a downward trajectory if supply on both coasts doesn’t improve significantly.
ProduceIQ Index: $1.15/pound, flat over prior week
Week #47, ending November 24th
Blue Book has teamed with ProduceIQ BB #:368175 to bring the ProduceIQ Index to its readers. The index provides a produce industry price benchmark using 40 top commodities to provide data for decision making.
Bean prices follow the Thanksgiving pattern of peaking and crashing.
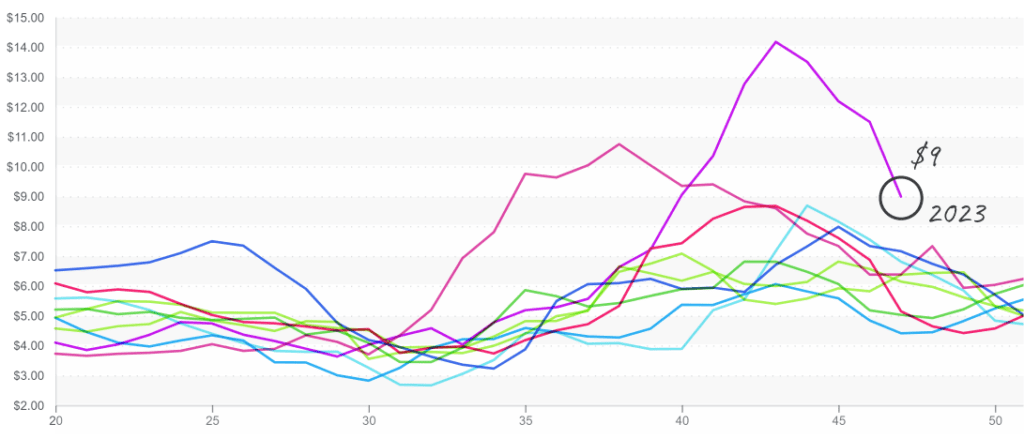
Mango markets are on their way back to Earth. In all the madness of Thanksgiving, we must have missed that mango prices have moved stealthily closer to the historical average for the past four weeks.
In case you missed the last episode of “Mangoes Gone Wild,” here’s a recap: mango markets were skyrocketing due to a precariously anemic import supply from South American growers. Growers in Ecuador report that this year’s mango season may see 50-60 percent less volume than what is typically harvested due to intense El Niño weather conditions in the country.
Although supply is by no means robust, steadily swelling numbers and cooler demand are helping prices return to the realm of historical precedence.
Mango prices are heading back to normalcy after reaching new highs.
As soon as it’s begun, fall’s domestic cantaloupe season is nearly over. After weeks of sinking markets, prices are finally up +20 percent over the previous week. It is still deficient compared to the historical average for week #47, but an improvement for price-weary suppliers.
With import season approaching, we may see some light volatility over the next few weeks. However, the prospects for the new product are sweet!
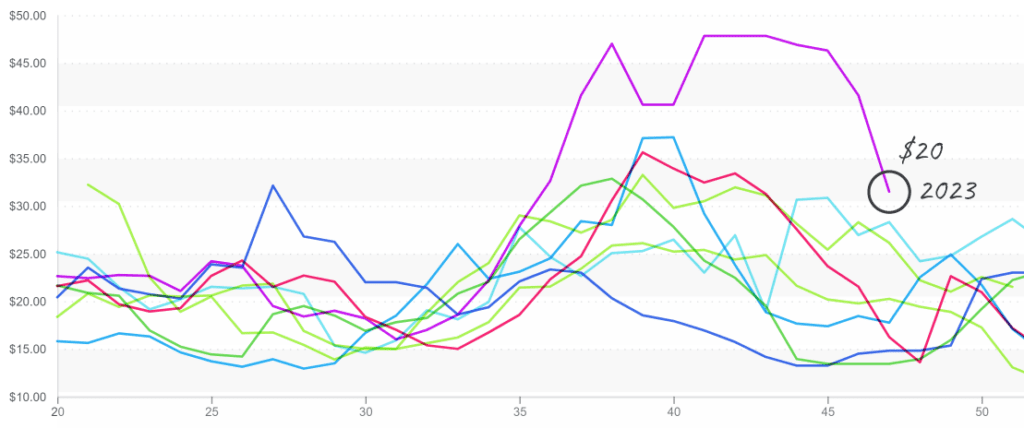
Some minor relief for mixed berry markets. Blackberries, blueberries, and strawberries are all down over the previous week. Although the price changes aren’t exactly game changers, they may indicate shifting conditions in the mixed berry category.
Shippers in the West are reporting more strawberry, blueberry, blackberry, and raspberry volume coming from Central Mexico, with more on the way. But the mixed berries category tends to flex its autonomy throughout December. And if historical data can tell us anything, these high-value commodities will find a way to keep us on our toes throughout the holiday season.
Blueberry prices, Eastern, remain high at $31 but are descending towards normalcy.
Average squash prices are up +19 percent over the previous week. Yellow straightneck and zucchini have a lower-than-average supply from growers in Mexico and Florida. Florida currently has cooler, rainy conditions. Mexican supply should increase over the next few weeks if the weather cooperates.
Please visit our website to discover how our online tools can save time and expand your reach.
ProduceIQ is a digital toolset designed to improve the produce trading process for buyers and suppliers. We save you time, increase your profits, expand your network, and provide valuable information.
ProduceIQ Index
The ProduceIQ Index is the fresh produce industry’s only shipping point price index. It represents the industry-wide price per pound at the location of packing for domestic produce and at the port of U.S. entry for imported produce.
ProduceIQ uses 40 top commodities to represent the industry. The Index weights each commodity dynamically, by season, as a function of the weekly 5-year rolling average Sales. Sales are calculated using the USDA’s Agricultural Marketing Service for movement and price data. The Index serves as a fair benchmark for industry price performance.
