
The April Marketplace
The deceleration of the rate of inflation continued in April 2023.
“After many months of double-digit increases, we found that the increase in the price per unit for total food and beverages averaged 8.2% in April 2023 compared with April 2022,” noted Jonna Parker, Team Lead, Fresh for Circana (formerly IRI). “At the same time, this is 23.1% above the April 2020 levels — illustrating that inflation continues to take a big bite out of American households’ paychecks.” Additionally, the temporary Supplemental Nutrition Assistance Program (SNAP) emergency allotments (EAs) — a temporary benefit increase that Congress enacted to address rising food insecurity and provide economic stimulus during the COVID-19 pandemic — ended in March 2023. The average SNAP recipient person receives about $90 a month less and households receive at least $95 less up to reductions of $250 per month.
The April Circana sales results and survey of primary grocery shoppers underscore that economic pressure on income continues to result in consumers moving around dollars between channels, products and brands. Circana, 210 Analytics and the International Fresh Produce Association team up to document the impact on sales patterns in fresh produce.
Per the April Circana survey of primary grocery shoppers:
“The marketplace remains complex,” noted Joe Watson, IFPA’s VP, Retail, Foodservice and Wholesale said. “But the April report also points to strengthening demand for fruit in reaction to sustained deflationary conditions and continued strength for many vegetables.”
Inflation Insights
The price per unit across all foods and beverages in the Circana-measured multi-outlet stores, including supermarkets, club, mass, supercenter, drug and military, increased by 8.2% in April (the four weeks ending 4/30/2023), which was down from 11.4% in the first quarter of the year.
| Average price/unit vs. YA | 2018 | 2019 | 2020 | 2021 | 2022 | Q4 2022 | Q1 2023 | Apr 23 |
| Total food & beverages | +1.5% | +2.0% | +5.1% | +5.4% | +12.5% | +13.5% | +11.4% | +8.2% |
In contrast, prices for fresh produce were flat in April 2023 when compared to April 2022. Fresh fruit prices decreased 2.4% in comparison to April 2022. Vegetable inflation averaged +2.3% in April, which is also down from the 52-week levels that averaged +7.7%.
| Price per volume (lbs) | Price/volume | Change vs. YA | Change vs. 3YA |
| Total fresh produce April 2023 | $1.89 | -0.1% | +19.4% |
| Total fresh produce latest 52 weeks thru 4/30/23 | $1.84 | +6.2% | +17.9% |
| Fresh fruit April 2023 | $1.75 | -2.4% | +21.4% |
| Fresh fruit latest 52 weeks thru 4/30/23 | $1.69 | +4.7% | +19.4% |
| Fresh vegetables April 2023 | $2.02 | +2.3% | +17.7% |
| Fresh vegetables latest 52 weeks thru 4/30/23 | $1.98 | +7.7% | +16.6% |
April 2023 Sales
The four April 2023 weeks generated $59.4 billion total food and beverage sales, up 5.0% over April 2022, though unit sales trailed behind. Perishables, including produce, seafood, meat, bakery and deli, had a slightly below-average dollar performance (+3.0%) but this was very much related to different levels of inflation as illustrated by the better-than-average unit performance (-1.7%).
| April 2023 % change | Latest 52 weeks % change | ||||||||
| Dollar size | Dollars vs. YA | Dollars vs. 2YA | Units vs. YA | Units vs. 2YA | Dollars vs. YA | Dollars vs. 2YA | Units vs. YA | Units vs. 2YA | |
| Total food & beverages | $59.4B | +5.0% | +17.5% | -2.9% | -2.3% | +8.8% | +14.0% | -3.4% | -5.6% |
| Center-store grocery | $29.5B | +7.9% | +22.9% | -3.8% | -1.8% | +11.0% | +17.3% | -3.8% | -6.0% |
| Total perishables | $26.1B | +3.0% | +14.6% | -1.7% | -2.6% | +7.7% | +12.9% | -2.8% | -4.9% |
April 2023 fresh produce sales reached $5.9 billion. “The strengthening demand for fruit in reaction to deflationary conditions is a very positive sign going into the summer months,” Watson noted. “There is typically a lag between improvements in pricing levels at retail and strengthening demand. We certainly saw that for fruit as well. But fresh fruit has experienced positive unit and volume growth for two consecutive months now and that bodes well for continued strength going into the big summer and grilling seasons.”
| April 2023 % change | Latest 52 weeks % change | ||||||||
| Dollar size | Dollars vs. YA | Dollars vs. 2YA | Units vs. YA | Units vs. 2YA | Dollars vs. YA | Dollars vs. 2YA | Units vs. YA | Units vs. 2YA | |
| Total fresh produce | $5.9B | +0.5% | +7.9% | +0.1% | -1.7% | +3.5% | +7.3% | -2.4% | -5.6% |
| Fresh fruit | $2.9B | -0.3% | +8.5% | +1.9% | +1.7% | +2.2% | +10.9% | -1.3% | -1.9% |
| Fresh vegetables | $2.9B | +1.5% | +7.2% | -1.1% | -4.1% | +4.8% | +3.7% | -3.2% | -8.4% |
Weekly fresh produce sales averaged between $1.41 billion and $1.57 billion. “April year-over-year weekly sales comparisons were highly affected by the timing of Easter and Passover which moved forward by week,” Watson pointed out. “This explains the sales pressure the third week of April when going up against last year’s Easter sales.
| Produce department | Dollar sales | $ vs. YA | lbs vs. YA |
| April 2023 | $5.871B | +0.5% | +0.6% |
| w.e. 4/9/2023 | $1.441B | +0.3% | +0.4% |
| w.e. 4/16/2023 | $1.446B | +4.6% | +4.0% |
| w.e. 4/23/2023 | $1.411B | -10.5% | -12.4% |
| w.e. 4/30/2023 | $1.574B | +8.8% | +12.2% |
Total Store Comparison
“The difference in inflationary levels between fresh, frozen and canned is staggering,” Parker commented. “The average price per pound for fresh produce was flat whereas the price per pound across frozen fruits and vegetables increased 21.3% between April 2022 and April 2023.”
| April 2023 | Dollar sales | Share of dollars | Dollar sales gains vs. YA | Unit gains vs. YA | Average price per pound | Increase price vs. YA |
| Fresh produce department | $5.9B | 79.7% | +0.5% | +0.1% | $1.89 | -0.1% |
| Frozen fruits and vegetables | $671M | 9.1% | +15.8% | -7.4% | $2.28 | +21.3% |
| Shelf stable fruits | $371M | 5.0% | +3.6% | -10.2% | $2.71 | +13.2% |
| Shelf stable vegetables | $457M | 6.2% | +6.2% | -4.3% | $1.42 | +11.8% |
Fresh Produce Dollars versus Volume
“We have been waiting for this moment for a while,” said Watson. “Fresh produce pounds are back in the black!” Fresh produce pound sales had been trailing behind year ago levels since April of 2021, but had seen steady improvements since the third quarter of 2022. In April 2023, pound sales exceeded year-ago levels by 0.6%.
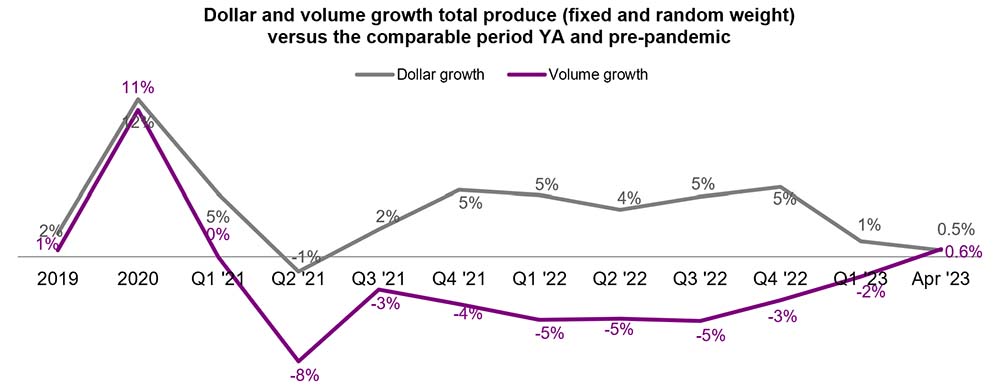
The increase in fresh produce volume sales was driven by fruit, that experienced a 2.1% increase in pounds sold in April 2023 compared with April 2022. Vegetables did not quite reach year-ago levels, but moved within one percentage point of the April 2022 levels.
| Growth over comparable period | ||||||||||||||
| 2019 | 2020 | 2021 | Q1 22 | Q2 22 | Q3 22 | Q4 22 | Q1 23 | Apr 23 | Vs. YA | Vs. 2YA | ||||
| Fruit | ||||||||||||||
| Dollars | +0% | +9% | +6.5% | +10% | +4% | +4.6% | +1.3% | -1.2% | $2.9B | -0.3% | +8.5% | |||
| Volume | -1% | +9% | -1.9% | -4% | -5% | -5.0% | -1.8% | -0.7% | 1.7B | +2.1% | -1.8% | |||
| Vegetables | ||||||||||||||
| Dollars | +4% | +15% | -1.2% | +0% | +3% | +4.8% | +6.8% | +3.5% | $2.9B | +1.5% | +7.2% | |||
| Volume | +2% | +14% | -5.3% | -6% | -5% | -4.7% | -1.4% | -2.5% | 1.4B | -0.8% | -0.7% | |||
Fresh Fruit Sales
“Fruit sales were a mix of dollar gains and losses and a mix of unit gains and losses in April,” Parker said. “Avocados are a perfect example of the pricing conundrum in the current marketplace. The average price per pound for avocados was down 26.6% in April 2023 versus April 2022. This prompted a year-on-year increase of 10.5% in pounds, but it meant dollar sales fell by 19.0%.” Other items with increased volume sales were melons, mandarins, pineapples and mixed fruit.
Items with increased dollar sales in April 2023 compared with last year were berries, bananas, melons, pineapples and mixed fruit.
| Top 10 in sales | April 2023 | ||||
| Type | $ sales | $ vs. YA | Lbs vs. YA | ||
| Fresh fruit | $2.9B | -0.3% | +2.1% | ||
| Berries | $785M | +4.3% | -1.2% | ||
| Apples | $338M | -3.0% | -4.8% | ||
| Grapes | $275M | -1.6% | -5.2% | ||
| Bananas | $267M | +1.4% | -1.4% | ||
| Melons | $254M | +11.4% | +21.3% | ||
| Avocados | $190M | -19.0% | +10.5% | ||
| Mandarins | $170M | -2.0% | +10.7% | ||
| Oranges | $107M | -10.9% | -8.5% | ||
| Pineapples | $90M | +3.1% | +4.7% | ||
| Mixed fruit | $88M | +3.2% | +1.3% | ||
Fresh Vegetables Sales
“Vegetables experienced a more mixed performance in April,” Watson said. “Three items increased pound sales, being onions, peppers and cucumbers, though more managed to grow year-over-year dollar sales with the help of price increases.
The dual power of value versus convenience can be seen in sales for both lettuce and salad kits, the number three and four sellers. However, whereas lettuce grew dollar sales, salad kits’ sales decreased in both pounds and dollars.
| Top 10 in sales | April 2023 | |||
| Type | $ sales | $ vs. YA | Lbs vs. YA | |
| Fresh vegetables | $2.9B | +1.5% | -0.8% | |
| Tomatoes | $319M | +0.7% | -0.3% | |
| Potatoes | $303M | +10.8% | -3.6% | |
| Lettuce | $247M | +4.3% | -0.5% | |
| Salad kits | $238M | -2.4% | -4.5% | |
| Onions | $206M | -0.3% | +3.7% | |
| Peppers | $198M | +1.6% | +5.8% | |
| Cucumbers | $125M | +8.3% | +3.3% | |
| Carrots | $108M | +2.6% | -1.7% | |
| Broccoli | $100M | +2.8% | -8.3% | |
| Salad blends | $94M | -0.7% | -8.4% | |
Please note: mushroom numbers have been removed from the April analysis until a data anomaly will have been corrected (May 2023 report).
Fresh Produce Absolute Dollar Gains
In April 2023, fresh vegetables added $41.6 million in additional dollars versus April 2022 whereas total fruit lost $10 million year-over-year.
Berries were the biggest contributor to new produce dollars, followed by potatoes, melons and lettuce. Melons increased on the combination of inflation and increased demand, whereas the additional dollars for berries, potatoes and lettuce were inflationary gains.
| Top 10 absolute | April 2023 | |||
| dollar growth | $ gain | $ sales | Lbs vs. YA | |
| Berries | +$32.5M | $785M | -1.2% | |
| Potatoes | +$29.6M | $303M | -3.6% | |
| Melons | +$25.9M | $254M | +21.3% | |
| Lettuce | +$10.2M | $247M | -0.5% | |
| Cucumbers | +$9.5M | $125M | +3.3% | |
| Tangerines | +$5.0M | $7M | +103% | |
| Tangelos | +$4.8M | $7M | +235% | |
| Corn | +$1.2M | $57M | +24.7% | |
| Specialty fruit | +$3.9M | $13M | +25.3% | |
| Bananas | +$3.6M | $267M | -1.4% | |
Perishables Performance
The meat department had the highest sales in April 2023, at $6.5 billion. Produce was in second. While the meat department experienced a decline in dollar sales due to lower unit sales combined with deflation in beef and pork, the produce department was the only one to achieve dollar and unit growth versus April 2022 levels.
| Perimeter | 3.1April 2023 | ||||
| departments | $ sales | $ vs. YA | Units vs. YA | ||
| Meat dpt. | $6.5B | -1.5% | -2.3% | ||
| Produce dpt. | $5.9B | +0.5% | +0.1% | ||
| Dairy aisle | $5.5B | +7.6% | -2.2% | ||
| Deli dpt. | $3.4B | +4.4% | -2.8% | ||
| Bakery dpt. | $3.3B | +8.7% | -2.2% | ||
| Seafood dpt. | $480M | -2.7% | -3.0% | ||
What’s Next?
In an update from last month’s survey, the April Circana survey outlook for Memorial Day found growing enthusiasm for the kick off of grilling season:
The work-from-home landscape continues to change as well. Having peaked at half of the population at the onset of the pandemic, the share of people who work from home one or more days per week is down to 25% of consumers or 46% of those who are active in the workforce.
The next report, covering May, will be released in mid-June. We also encourage you to contact Joe Watson, IFPA’s VP, Retail, Foodservice and Wholesale, at jwatson@freshproduce.com with any questions or concerns. Please recognize the continued dedication of the entire grocery and produce supply chains, from farm to retailer. #produce #joyoffresh
Date ranges:
- 2019: 52 weeks ending 12/28/2019
- 2020: 52 weeks ending 12/27/2020
- 2021: 52 weeks ending 12/26/2021
- 2022: 52 weeks ending 1/1/2023
- Q4 2022: 13 weeks ending 1/1/2023
- Q1 2023: 13 weeks ending 4/2/2023
- March 2023: 5 weeks ending 4/2/2023
- April 2023: 4 weeks ending 4/30/2023
