Let’s just say it would be quicker to write the list of produce commodities not nearing their record high prices this week than those that are. Difficult growing conditions, primarily scorching heat, are causing FOB shipping point prices to surpass broader inflation measures.
The annual inflation rate in the U.S. accelerated to 9.1% in June, which is the highest in 41 years. The spot prices for fresh produce are not correlated to broader economic inflation; however, they are also at a record-breaking high.
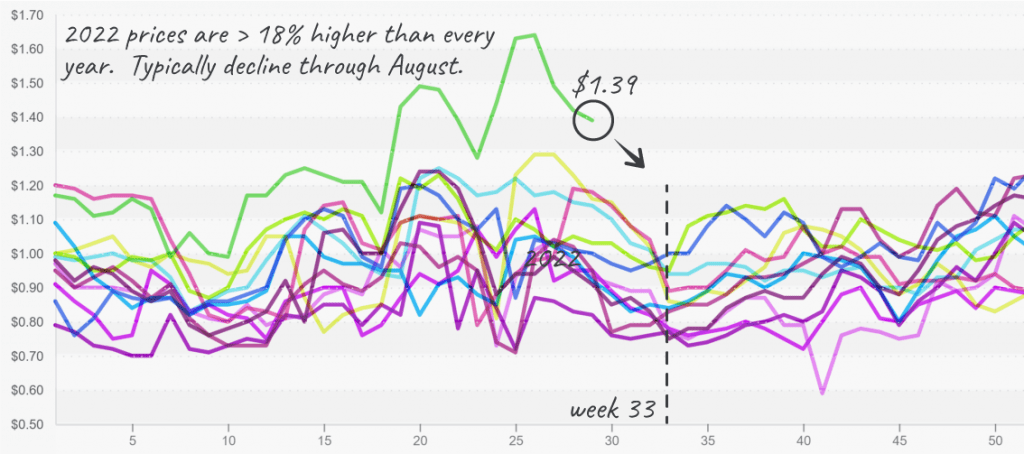
We’d anticipate prices to continue to fall from now through August. Historically, demand is sleepy this time of year due to a lack of holidays, kids returning to school, and summer heat.
ProduceIQ Index:$1.39 /pound, -2.1 percent over prior week
Week #29, ending July 22nd
Blue Book has teamed with ProduceIQ BB #:368175 to bring the ProduceIQ Index to its readers. The index provides a produce industry price benchmark using 40 top commodities to provide data for decision making.
Overall index prices are 18 percent higher than in 2016 and +35 percent higher than in 2021.
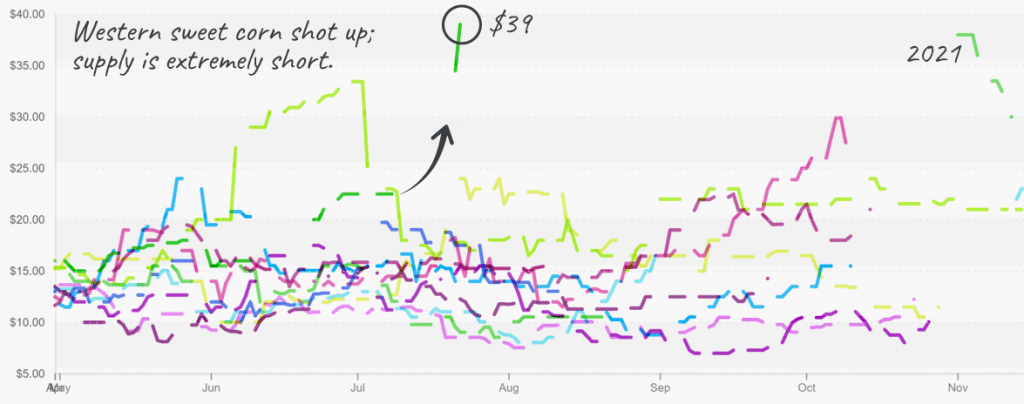
Sweet corn is the next commodity trying to break the index. A gap in production in the West and minimal Eastern supply is shooting prices over the moon. +76 percent over the previous week, sweet-corn prices are making us do a double-take. Eastern prices are not as high, but state-by-state requirements for European Corn Borer certificates make shipping sweet corn from the East to the West a risky venture. Anticipate many retailers will go ‘out-of-stock’ on corn in Western states. For those jealous of these high prices, just remember that high prices don’t contribute to a farmer’s wealth if he doesn’t have any product to sell.
Volume of sweet corn reported to the USDA typically falls towards the end of July as ‘local’ availability is plentiful. However, this year, the decline in volume is due to more than a lack of data; supply is lacking altogether as seen in the inordinate price increases.
Sweet corn in the West remains in an extreme demand-exceeds-supply market. Eastern corn prices are also elevated.
Orange you glad you’re not an orange buyer. But unfortunately, this week’s prices continue to intensify what has already been one of the most expensive years for orange buyers. A challenging winter season for domestic growers was only the opening act for an equally exacerbating summer season.
Prices typically climb in the summer months as domestic availability of the citrus thins. But this year, a lower supply of Chilean fruit is adding pressure to an already overextended market. Prices may stabilize if Chilean growers can increase production, though forecasts are not optimistic. Prices are at record levels; size 88s in Western shipping point is over $24 per case.
Strawberry volume out of Northern California declined for the fourth straight week. Prices are on the rise, +17 percent to $10. Overall volume typically falls post week #25 as domestic supply weakens through the end of the year.
Blueberry prices stall as supply marginally improves. However, increased volume is still not enough to meet demand. Minnesota is delaying its harvest due to rain, and the sleepy PNW is still not quite ready to get up and at ’em.
A gap in California’s raspberry and blackberry production is causing markets to firm up. As a result, raspberry prices are up +10 percent, and blackberry prices are up a modest +2 percent.
Expect all berry markets to remain tight for the next few weeks.
A silver lining for potato buyers, supply can only improve from here on out. Or at least that’s what we are trying to speak into existence. Russet prices are climbing as supply dwindles into oblivion. In gas terms, the gauge is on E, and the next gas station isn’t for ten more miles. The Northwest should begin in early August and provide some relief, that is, if we don’t run out of fuel first.
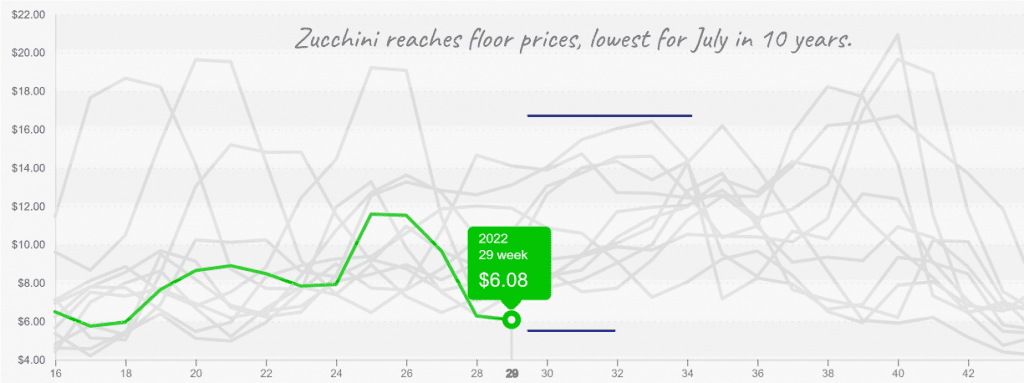
Squash, thanks for reminding buyers that there is still hope, even in the darkest depths of record-high prices. Prices are down another -5 percent over the previous week due to increased local availability. The summer heat is good for one thing: grillin’ squash promotions!
Zucchini is priced to sell. It’s time to promote local squash.
Please visit Stores to learn more about our qualified group of suppliers, or our online marketplace, here and enjoy free access to our market tools which created the graphs above.
ProduceIQ Index
The ProduceIQ Index is the fresh produce industry’s only shipping point price index. It represents the industry-wide price per pound at the location of packing for domestic produce, and at the port of U.S. entry for imported produce.
ProduceIQ uses 40 top commodities to represent the industry. The Index weights each commodity dynamically, by season, as a function of the weekly 5-year rolling average Sales. Sales are calculated using the USDA’s Agricultural Marketing Service for movement and price data. The Index serves as a fair benchmark for industry price performance.
Let’s just say it would be quicker to write the list of produce commodities not nearing their record high prices this week than those that are. Difficult growing conditions, primarily scorching heat, are causing FOB shipping point prices to surpass broader inflation measures.
The annual inflation rate in the U.S. accelerated to 9.1% in June, which is the highest in 41 years. The spot prices for fresh produce are not correlated to broader economic inflation; however, they are also at a record-breaking high.
We’d anticipate prices to continue to fall from now through August. Historically, demand is sleepy this time of year due to a lack of holidays, kids returning to school, and summer heat.
ProduceIQ Index:$1.39 /pound, -2.1 percent over prior week
Week #29, ending July 22nd
Blue Book has teamed with ProduceIQ BB #:368175 to bring the ProduceIQ Index to its readers. The index provides a produce industry price benchmark using 40 top commodities to provide data for decision making.
Overall index prices are 18 percent higher than in 2016 and +35 percent higher than in 2021.
Sweet corn is the next commodity trying to break the index. A gap in production in the West and minimal Eastern supply is shooting prices over the moon. +76 percent over the previous week, sweet-corn prices are making us do a double-take. Eastern prices are not as high, but state-by-state requirements for European Corn Borer certificates make shipping sweet corn from the East to the West a risky venture. Anticipate many retailers will go ‘out-of-stock’ on corn in Western states. For those jealous of these high prices, just remember that high prices don’t contribute to a farmer’s wealth if he doesn’t have any product to sell.
Volume of sweet corn reported to the USDA typically falls towards the end of July as ‘local’ availability is plentiful. However, this year, the decline in volume is due to more than a lack of data; supply is lacking altogether as seen in the inordinate price increases.
Sweet corn in the West remains in an extreme demand-exceeds-supply market. Eastern corn prices are also elevated.
Orange you glad you’re not an orange buyer. But unfortunately, this week’s prices continue to intensify what has already been one of the most expensive years for orange buyers. A challenging winter season for domestic growers was only the opening act for an equally exacerbating summer season.
Prices typically climb in the summer months as domestic availability of the citrus thins. But this year, a lower supply of Chilean fruit is adding pressure to an already overextended market. Prices may stabilize if Chilean growers can increase production, though forecasts are not optimistic. Prices are at record levels; size 88s in Western shipping point is over $24 per case.
Strawberry volume out of Northern California declined for the fourth straight week. Prices are on the rise, +17 percent to $10. Overall volume typically falls post week #25 as domestic supply weakens through the end of the year.
Blueberry prices stall as supply marginally improves. However, increased volume is still not enough to meet demand. Minnesota is delaying its harvest due to rain, and the sleepy PNW is still not quite ready to get up and at ’em.
A gap in California’s raspberry and blackberry production is causing markets to firm up. As a result, raspberry prices are up +10 percent, and blackberry prices are up a modest +2 percent.
Expect all berry markets to remain tight for the next few weeks.
A silver lining for potato buyers, supply can only improve from here on out. Or at least that’s what we are trying to speak into existence. Russet prices are climbing as supply dwindles into oblivion. In gas terms, the gauge is on E, and the next gas station isn’t for ten more miles. The Northwest should begin in early August and provide some relief, that is, if we don’t run out of fuel first.
Squash, thanks for reminding buyers that there is still hope, even in the darkest depths of record-high prices. Prices are down another -5 percent over the previous week due to increased local availability. The summer heat is good for one thing: grillin’ squash promotions!
Zucchini is priced to sell. It’s time to promote local squash.
Please visit Stores to learn more about our qualified group of suppliers, or our online marketplace, here and enjoy free access to our market tools which created the graphs above.
ProduceIQ Index
The ProduceIQ Index is the fresh produce industry’s only shipping point price index. It represents the industry-wide price per pound at the location of packing for domestic produce, and at the port of U.S. entry for imported produce.
ProduceIQ uses 40 top commodities to represent the industry. The Index weights each commodity dynamically, by season, as a function of the weekly 5-year rolling average Sales. Sales are calculated using the USDA’s Agricultural Marketing Service for movement and price data. The Index serves as a fair benchmark for industry price performance.
Mark Campbell was introduced to the fresh produce industry as a lender for Farm Credit. After earning his MBA from Columbia Business School, he spent seven years as CFO for J&J Family of Farms and later served as CFO advisor to several produce growers, shippers and distributors. In this role, Mark saw the impediments that prevent produce growers and buyers to trade with greater access and efficiency. This led him to co-found ProduceIQ.