The height, the widespread nature and the continued acceleration of inflation dominated the headlines in May. Whether in the grocery store, at the pump or at the movies, consumers were paying more.
“But the focus on inflation is not limited to the media headlines,” said Jonna Parker, Team Lead of the Fresh Foods practice at IRI. “According to the May edition of the IRI monthly survey of primary shoppers, consumers are extremely aware and many are applying lessons learned during the Great Recession to tighten spending.”
Awareness of inflation has been extremely high since early fall of 2021. The difference between then and now is the level of consumer concern about inflation and the subsequent reactions when buying groceries, which are intensifying by the month. In May, 95% of consumers were concerned over rising prices, of whom 48% were very concerned. Additionally, 92% of consumers were concerned about higher gas prices, of whom 55% were extremely worried. In contrast, only 23% of consumers had extreme concern over COVID-19 in May 2022.
The widespread nature and height of inflation is pressuring spending for many consumers, including 38% who described their financial health as strained. Thirty percent of American households stated they struggle affording needed groceries.
Whereas in the fall of 2021 less than 50% made changes to their grocery shopping patterns and choices, 77% of consumers chose differently when buying groceries in May. “This was up another six points from the April survey when 71% of consumers bought differently,” explained Parker. The measures to combat inflation’s impact on the grocery bill are widespread, including stocking up out of fear that items may cost more on future shopping trips (20%) or may simply not be available (16%) — further pressuring in-stock conditions. Another tactic is making a list and sticking to it, according to 39% of shoppers, which tends to impact items with an impulse nature.
At the same time that 45% of consumers looked for sales specials, 55% said that fewer of the items they want are on sale and 42% felt that items were not discounted as much, according to the May survey. “This lack of promotions is compounding the inflationary pressure,” agreed Parker and she pointed out that creative approaches such as shorter sales and cross-category promotions could be a much-needed answer. Other popular money-saving measures included cutting back on non-essentials (36%), looking for coupons (28%), buying more private brands (24%) and buying fewer items (23%).
Despite the high gas prices, 16% of consumers visited more stores in May than they normally do to capitalize on sales promotions or everyday low prices. An even higher 19% shopped value-focused retailers including dollar stores, ALDI, Lidl and others. “Switching stores is typically one of the very last measures consumers take, but this time around, it is already in the mix,” said Parker. “This is a telltale sign of consumers’ level of concern and true pressure on income in the light of the high gasoline prices.”
The share of home-prepared meals continued to average around 80%. Consumers would like to eat out more, but recognize home-cooked meals are cheaper. They have become more strategic in their restaurant choices and subsequent orders — opening the door for retailers to sell the sides, beverage or dessert. Restaurant takeout remained big in May, at 54% of consumers, which may also be a money-saving tactic versus eating on premise.
“Compared with the fall of 2021, inflation is higher, more people are making changes and the supply chain challenges from labels to packaging to transportation and labor continue to be significant,” said Joe Watson, VP, Retail, Foodservice & Wholesale for IFPA. “The consumer reactions combined with supply side volatility are creating an environment of continued change and uncertainty and IRI, 210 Analytics and IFPA are committed to bringing the latest trends and analysis relative to the produce department.”
Inflation Insights
The price per unit across all foods and beverages in the IRI-measured multi-outlet stores, including supermarkets, club, mass, supercenter, drug and military, accelerated further to an increase of 11.8% in the five weeks ending May 29, 2022 (“May”) versus the same five weeks in 2021. Inflation was in the double digits in the center of the store (+13.7%) as well as in perishables (+11.7%) and compared to May 2019, prices across all foods and beverages were up +22.8%.
Source: IRI, Integrated Fresh, Total US, MULO, average price per unit and % gain versus YA
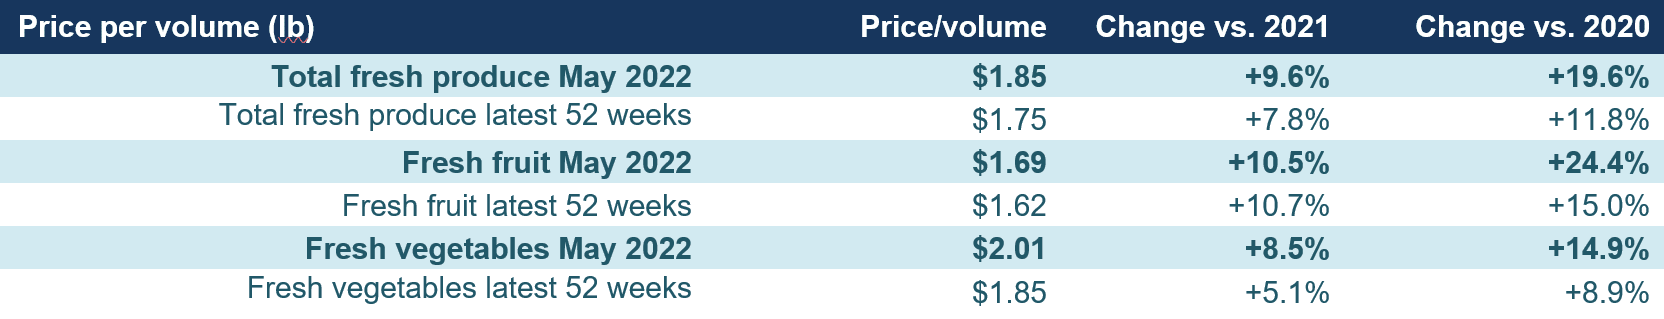
Fresh produce prices were also up from last year, at +9.0% level on a per unit basis and +9.6% on a per pound basis. The increases are predominantly driven by fruit, that had double-digit inflation once more in both the four-week and 52-week view.
“The average price per pound across fruits and vegetables was $1.85, actually down four cents from April,” said Watson. “While high, we are at least seeing more price stability month-over-month. Yet the continued high level of inflation is and has been impacting volume sales and net dollars across the store.”
Source: IRI, Integrated Fresh, Total US, MULO, average price per volume and % gain versus YA and 2YA
May 2022 Sales
The five May 2022 weeks brought $70.6 billion in total food and beverage sales, which was up +6.5% versus year ago and compared with pre-pandemic, May sales were up +23.1%. Inflation played a significant role with year-on-year unit sales down -4.8%, which was a sharp downward turn from the -2.4% unit decline measured in April 2022. Much like seen in the surveys, consumers are compensating for the inflationary levels by buying fewer items. Perishables, including produce, seafood, meat, bakery and deli, had average dollar and unit performance, but center-store items did better than average in both dollars and units. Frozen foods had the highest increase versus pre-pandemic, at +30.7%.
Source: IRI, Integrated Fresh, Total US, MULO
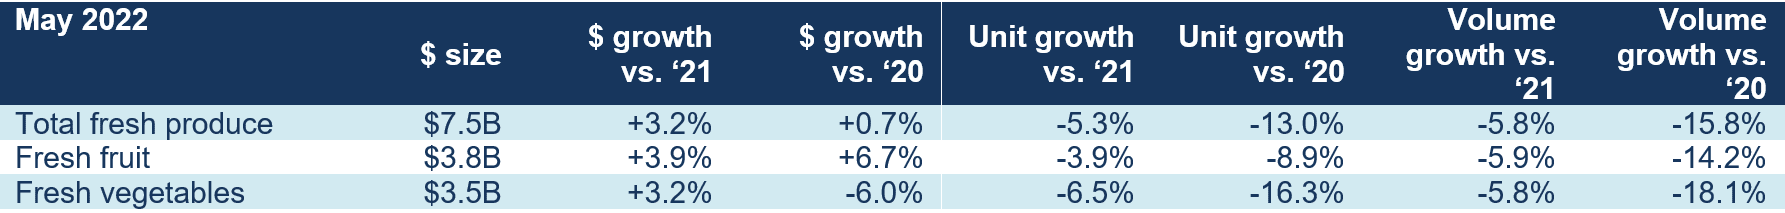
May 2022 fresh produce sales reached $7.5 billion, surpassing the record set in 2021 by +3.2%. However, looking beyond dollars that were highly affected by inflation, unit and volume declined. “There are many forces at play relative to the volume pressure,” said Watson. “Consumers are hyper focused on saving money, frozen and shelf-stable play a role, and there is the impact of supply chain disruption and out-of-stocks. Opportunities for the summer months lie in the increase in outdoor entertaining where fresh produce plays an important role.”
Source: IRI, Integrated Fresh, Total US, MULO, % change vs. year ago.
Each of the May weeks generated between $1.4 and $1.6 billion in fresh produce sales. The last week, which was the week leading up to the Memorial Day weekend, was the strongest, at $1.6 billion. Dollars increased for each of the May weeks, but volume was down consistently, whether an everyday or holiday week.
May was the second time vegetable sales were decidedly above year-ago levels since the second quarter of 2021. Vegetable dollars increased +2.3%. At the same time, year-on-year fruit gains have been slowing since the fourth quarter of 2021, to +3.9% in May 2022.
Source: IRI, Integrated Fresh, Total US, MULO
Source: IRI Integrated Fresh, Total U.S., MULO
Fresh Produce Share of Total Fruits and Vegetables
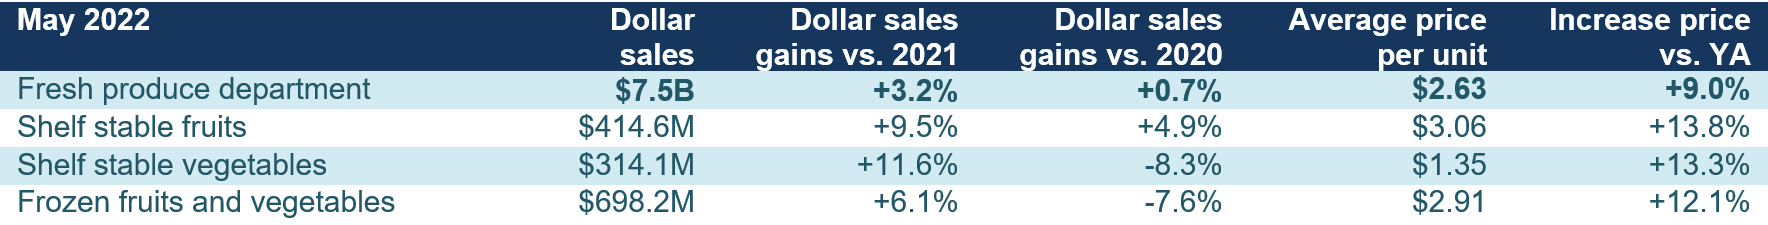
Shelf-stable fruits and vegetables had double-digit inflation in May 2022 compared with May 2021. This resulted in above average dollar gains. Both frozen and shelf-stable are heavily impacted by supply chain disruptions. Both assortment and inventory levels have been down significantly over recent months.
Source: IRI Integrated Fresh, Total US, MULO
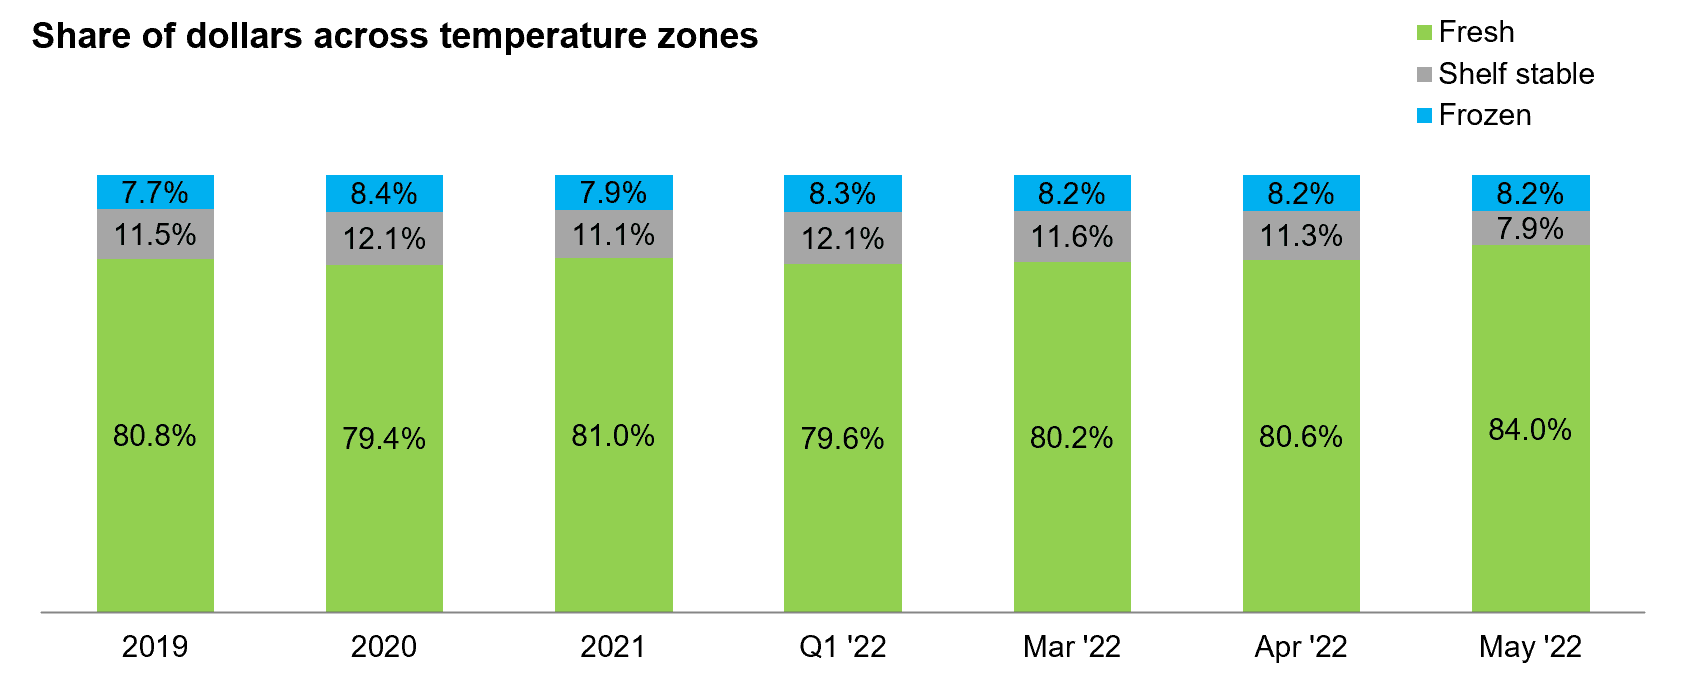
In the first quarter of 2022, just under 80% of total fruit and vegetable dollars were generated by the fresh produce department. March and April 2022 brought some recovery to the fresh share and May reached the highest share in many months, at 84.0%. Frozen fruit and vegetable sales dropped to 7.9%.
As a share of total pounds sold across the three areas, fresh produce made up 83.7%, which was up from 77.2% in the first quarter. Shelf-stable fruits and vegetables represented 8.8% of pounds in May 2022.
Source: IRI Integrated Fresh, Total U.S., MULO
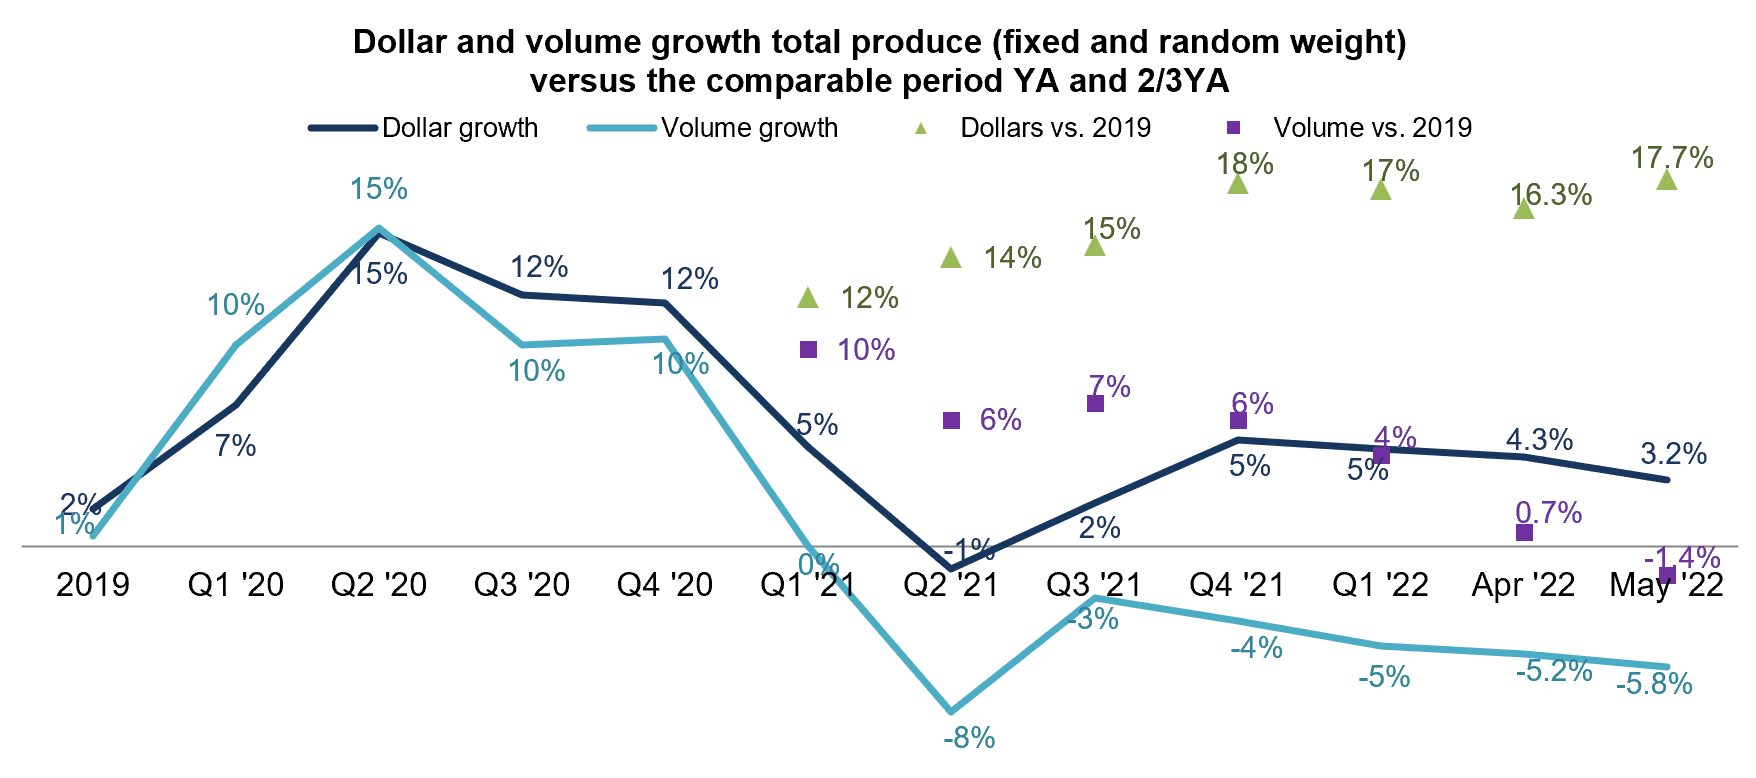
Fresh Produce Dollars versus Volume
Fresh produce pound sales trailed behind year ago levels all throughout 2021 and the first quarter of 2022. In May 2022, pound sales were down -5.8% year-on-year — its lowest level since the second quarter of 2021. Importantly, compared with 2019, the pre-pandemic normal, dollars remain +17.7% ahead (green triangles) but pound sales dipped below 2019 levels by -1.4% (purple squares). “This marks the first time that volume was unable to hold the line versus pre-pandemic levels,” said Watson.
Source: IRI Integrated Fresh, Total U.S., MULO
“The volume pressure came from the fruit side,” explained Parker. “Fruit pound sales were down 2.9% in May 2022 versus May 2019. Vegetables, on the other hand, did still sell +0.6% more in pounds in May 2022 versus May 2019, but this growth is down substantially from +3.2% when comparing April 2022 to April 2019.”
Source: IRI Integrated Fresh, Total U.S., MULO
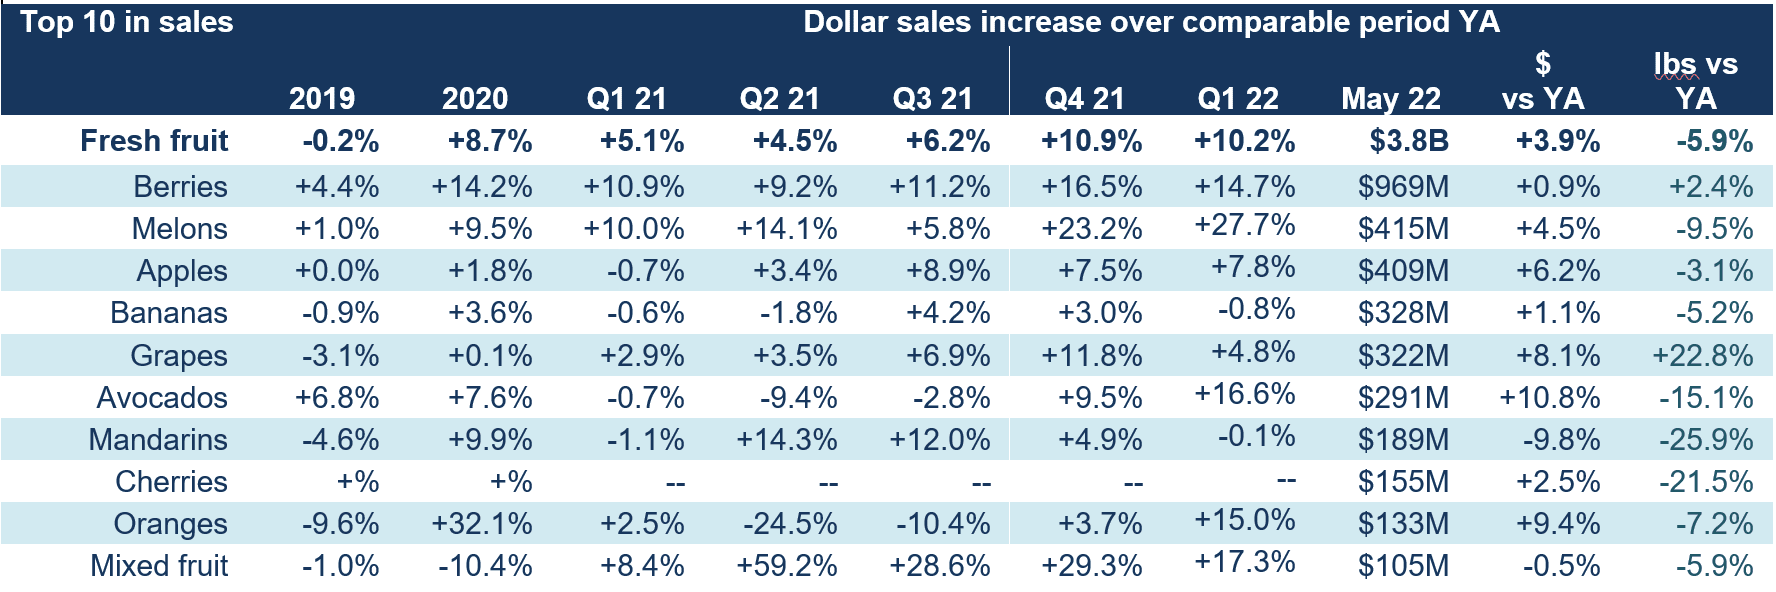
Fresh Fruit Sales in May
“In May 2022, berries sales continued to be more than double that of the number two seller, melons,” said Parker. “Pineapples dropped out of the top 10, and cherries made their inroads. Volume sales were a mix with increases for berries and grapes but down results for all other top 10 sellers.”
Source: IRI Integrated Fresh, Total U.S., MULO
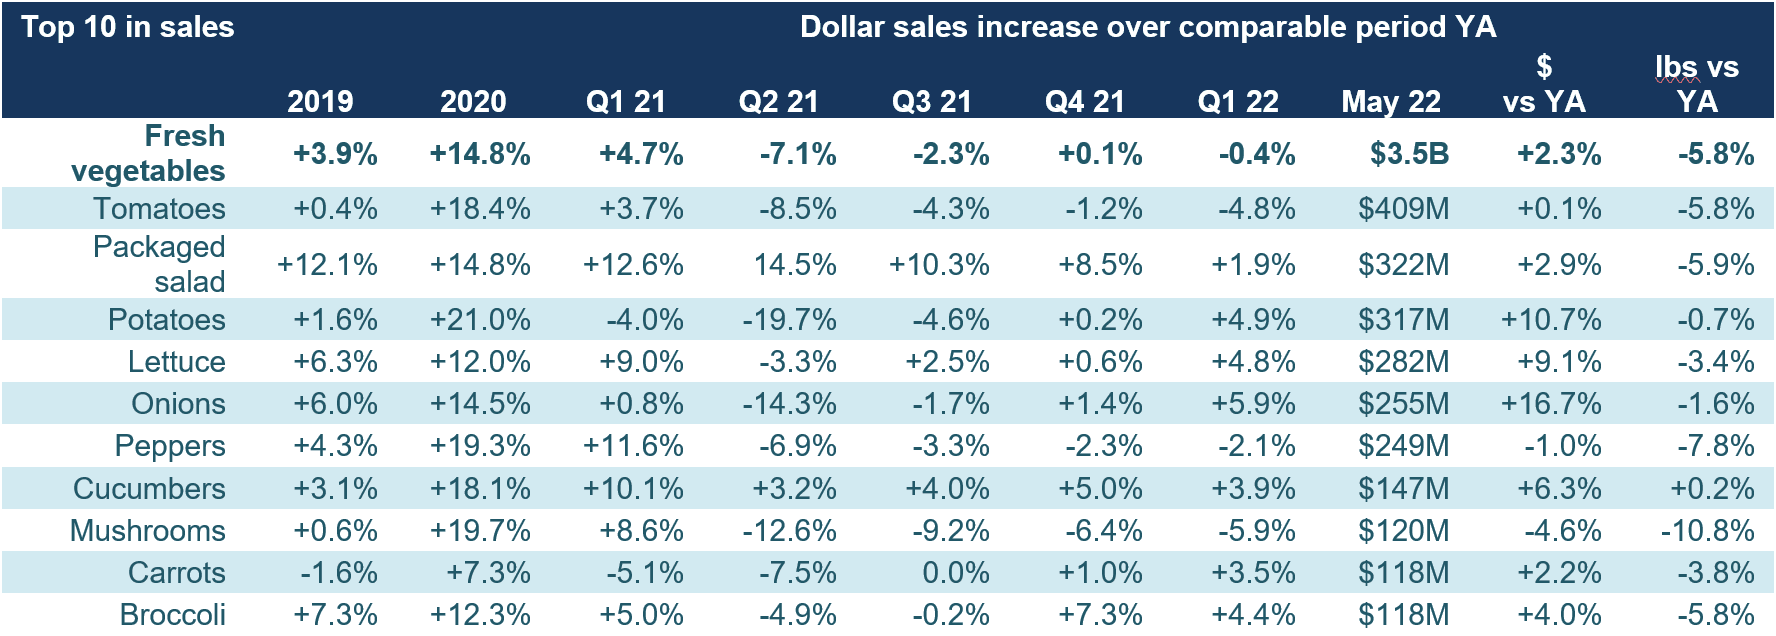
Fresh Vegetables Sales in May
“Eight out of the top 10 vegetable sellers grew sales versus year ago,” said Watson. “That is one more than last year. Pound sales were down for most fresh vegetables, with cucumbers being the lone exception in the top 10 sellers.”
Source: IRI Integrated Fresh, Total U.S., MULO
Fresh Produce Absolute Dollar Gains
In May 2022, fresh fruit added $146 million in sales and vegetables added $77 million when compared to May 2021. “The top 10 in absolute dollar gains shows the rising impact of inflation which tends to push shoppers to versatile cooking basics and cost-effective fruits, generally with an eye on shelf life,” said Parker. “Berries ruled new dollars for many months on end, but the decrease in the price per pound meant that new dollars were somewhat subdued in May 2022 compared with areas with high inflation, such as avocados and limes. The one contender bucking that trend are grapes, that had a 12.0% decrease in price, which significantly boosted demand.”
Source: IRI Integrated Fresh, Total U.S., MULO
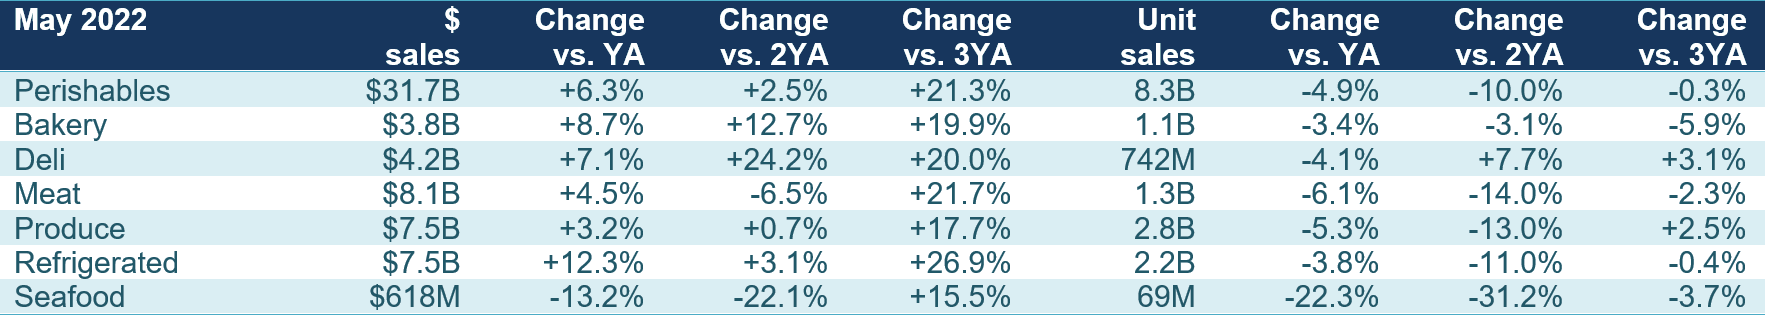
Perishables Performance
In May, total perishables grew +6.3%, with above-average increases for bakery, deli and refrigerated, which includes dairy. The highest gain versus the pre-pandemic normal was generated by refrigerated, up +26.9% in May of 2022 versus May 2019. The departments still selling more units in May 2022 than they did in May 2019 were deli and produce.
Source: IRI Integrated Fresh, Total U.S., MULO, fixed and random weight items combined into department views
What’s Next?
The war in Ukraine, the renewed COVID lockdowns in China, record inflation, labor shortages and supply chain challenges will have a continued effect on food and food sales in the months to come. Opportunities for retail remain the home-cooked meal with 90% of consumers expecting they will cook from scratch as much (74%) or more often (16%) as last year. Another opportunity is renewed in-person socializing with friends and family with 13% expecting to entertain more.
As grilling season has officially started, finding ways to tie into outdoor cooking and entertaining can be a growth opportunity.
69% plan to host at least one cookout or barbecue to entertain friends and family this summer, typically averaging some six to nine guests, according to the May IRI shopper survey.
Additionally, 71% of consumers plan to grill or cook meals outdoors as much (51%) or more (20%) this summer.
Consumers like experimenting with new items on the grill (37%) and many prefer preparing meat/seafood from scratch (74%), while 17% buy grill-ready items. Consumers are a bit more likely to buy ready-to-eat sides, at 23%.
The next report, covering June, will be released in mid-July. In addition to the data provided here, the IFPA also now offers InSite – an online interactive data set covering both produce and floral performance as well as a look at the 2021 consumer sentiment surveys. Start your free trial today! See www.freshproduce.com/insite for more detail. We also encourage you to contact Joe Watson, IFPA’s VP, Retail, Foodservice and Wholesale, at jwatson@freshproduce.com with any questions or concerns. Please recognize the continued dedication of the entire grocery and produce supply chains, from farm to retailer. #produce #joyoffresh #SupermarketSuperHeroes.
Date ranges:
2019: 52 weeks ending 12/28/2019
2020: 52 weeks ending 12/27/2020
Q1 2021: 13 weeks ending 3/28/2021
Q2 2021: 13 weeks ending 6/27/2021
Q3 2021: 13 weeks ending 9/26/2021
Q4 2021: 13 weeks ending 12/26/2021
Q1 2022: 13 weeks ending 3/27/2022
January 2022: 5 weeks ending 1/30/2022
February 2022: 4 weeks ending 2/27/2022
March 2022: 4 weeks ending 3/27/2022
April: 4 weeks ending 4/24/2022
May: 5 weeks ending 5/29/2022
The May Marketplace
The height, the widespread nature and the continued acceleration of inflation dominated the headlines in May. Whether in the grocery store, at the pump or at the movies, consumers were paying more.
“But the focus on inflation is not limited to the media headlines,” said Jonna Parker, Team Lead of the Fresh Foods practice at IRI. “According to the May edition of the IRI monthly survey of primary shoppers, consumers are extremely aware and many are applying lessons learned during the Great Recession to tighten spending.”
Awareness of inflation has been extremely high since early fall of 2021. The difference between then and now is the level of consumer concern about inflation and the subsequent reactions when buying groceries, which are intensifying by the month. In May, 95% of consumers were concerned over rising prices, of whom 48% were very concerned. Additionally, 92% of consumers were concerned about higher gas prices, of whom 55% were extremely worried. In contrast, only 23% of consumers had extreme concern over COVID-19 in May 2022.
The widespread nature and height of inflation is pressuring spending for many consumers, including 38% who described their financial health as strained. Thirty percent of American households stated they struggle affording needed groceries.
Whereas in the fall of 2021 less than 50% made changes to their grocery shopping patterns and choices, 77% of consumers chose differently when buying groceries in May. “This was up another six points from the April survey when 71% of consumers bought differently,” explained Parker. The measures to combat inflation’s impact on the grocery bill are widespread, including stocking up out of fear that items may cost more on future shopping trips (20%) or may simply not be available (16%) — further pressuring in-stock conditions. Another tactic is making a list and sticking to it, according to 39% of shoppers, which tends to impact items with an impulse nature.
At the same time that 45% of consumers looked for sales specials, 55% said that fewer of the items they want are on sale and 42% felt that items were not discounted as much, according to the May survey. “This lack of promotions is compounding the inflationary pressure,” agreed Parker and she pointed out that creative approaches such as shorter sales and cross-category promotions could be a much-needed answer. Other popular money-saving measures included cutting back on non-essentials (36%), looking for coupons (28%), buying more private brands (24%) and buying fewer items (23%).
Despite the high gas prices, 16% of consumers visited more stores in May than they normally do to capitalize on sales promotions or everyday low prices. An even higher 19% shopped value-focused retailers including dollar stores, ALDI, Lidl and others. “Switching stores is typically one of the very last measures consumers take, but this time around, it is already in the mix,” said Parker. “This is a telltale sign of consumers’ level of concern and true pressure on income in the light of the high gasoline prices.”
The share of home-prepared meals continued to average around 80%. Consumers would like to eat out more, but recognize home-cooked meals are cheaper. They have become more strategic in their restaurant choices and subsequent orders — opening the door for retailers to sell the sides, beverage or dessert. Restaurant takeout remained big in May, at 54% of consumers, which may also be a money-saving tactic versus eating on premise.
“Compared with the fall of 2021, inflation is higher, more people are making changes and the supply chain challenges from labels to packaging to transportation and labor continue to be significant,” said Joe Watson, VP, Retail, Foodservice & Wholesale for IFPA. “The consumer reactions combined with supply side volatility are creating an environment of continued change and uncertainty and IRI, 210 Analytics and IFPA are committed to bringing the latest trends and analysis relative to the produce department.”
Inflation Insights
The price per unit across all foods and beverages in the IRI-measured multi-outlet stores, including supermarkets, club, mass, supercenter, drug and military, accelerated further to an increase of 11.8% in the five weeks ending May 29, 2022 (“May”) versus the same five weeks in 2021. Inflation was in the double digits in the center of the store (+13.7%) as well as in perishables (+11.7%) and compared to May 2019, prices across all foods and beverages were up +22.8%.
Source: IRI, Integrated Fresh, Total US, MULO, average price per unit and % gain versus YA
Fresh produce prices were also up from last year, at +9.0% level on a per unit basis and +9.6% on a per pound basis. The increases are predominantly driven by fruit, that had double-digit inflation once more in both the four-week and 52-week view.
“The average price per pound across fruits and vegetables was $1.85, actually down four cents from April,” said Watson. “While high, we are at least seeing more price stability month-over-month. Yet the continued high level of inflation is and has been impacting volume sales and net dollars across the store.”
Source: IRI, Integrated Fresh, Total US, MULO, average price per volume and % gain versus YA and 2YA
May 2022 Sales
The five May 2022 weeks brought $70.6 billion in total food and beverage sales, which was up +6.5% versus year ago and compared with pre-pandemic, May sales were up +23.1%. Inflation played a significant role with year-on-year unit sales down -4.8%, which was a sharp downward turn from the -2.4% unit decline measured in April 2022. Much like seen in the surveys, consumers are compensating for the inflationary levels by buying fewer items. Perishables, including produce, seafood, meat, bakery and deli, had average dollar and unit performance, but center-store items did better than average in both dollars and units. Frozen foods had the highest increase versus pre-pandemic, at +30.7%.
Source: IRI, Integrated Fresh, Total US, MULO
May 2022 fresh produce sales reached $7.5 billion, surpassing the record set in 2021 by +3.2%. However, looking beyond dollars that were highly affected by inflation, unit and volume declined. “There are many forces at play relative to the volume pressure,” said Watson. “Consumers are hyper focused on saving money, frozen and shelf-stable play a role, and there is the impact of supply chain disruption and out-of-stocks. Opportunities for the summer months lie in the increase in outdoor entertaining where fresh produce plays an important role.”
Source: IRI, Integrated Fresh, Total US, MULO, % change vs. year ago.
Each of the May weeks generated between $1.4 and $1.6 billion in fresh produce sales. The last week, which was the week leading up to the Memorial Day weekend, was the strongest, at $1.6 billion. Dollars increased for each of the May weeks, but volume was down consistently, whether an everyday or holiday week.
May was the second time vegetable sales were decidedly above year-ago levels since the second quarter of 2021. Vegetable dollars increased +2.3%. At the same time, year-on-year fruit gains have been slowing since the fourth quarter of 2021, to +3.9% in May 2022.
Source: IRI, Integrated Fresh, Total US, MULO
Source: IRI Integrated Fresh, Total U.S., MULO
Fresh Produce Share of Total Fruits and Vegetables
Shelf-stable fruits and vegetables had double-digit inflation in May 2022 compared with May 2021. This resulted in above average dollar gains. Both frozen and shelf-stable are heavily impacted by supply chain disruptions. Both assortment and inventory levels have been down significantly over recent months.
Source: IRI Integrated Fresh, Total US, MULO
In the first quarter of 2022, just under 80% of total fruit and vegetable dollars were generated by the fresh produce department. March and April 2022 brought some recovery to the fresh share and May reached the highest share in many months, at 84.0%. Frozen fruit and vegetable sales dropped to 7.9%.
As a share of total pounds sold across the three areas, fresh produce made up 83.7%, which was up from 77.2% in the first quarter. Shelf-stable fruits and vegetables represented 8.8% of pounds in May 2022.
Source: IRI Integrated Fresh, Total U.S., MULO
Fresh Produce Dollars versus Volume
Fresh produce pound sales trailed behind year ago levels all throughout 2021 and the first quarter of 2022. In May 2022, pound sales were down -5.8% year-on-year — its lowest level since the second quarter of 2021. Importantly, compared with 2019, the pre-pandemic normal, dollars remain +17.7% ahead (green triangles) but pound sales dipped below 2019 levels by -1.4% (purple squares). “This marks the first time that volume was unable to hold the line versus pre-pandemic levels,” said Watson.
Source: IRI Integrated Fresh, Total U.S., MULO
“The volume pressure came from the fruit side,” explained Parker. “Fruit pound sales were down 2.9% in May 2022 versus May 2019. Vegetables, on the other hand, did still sell +0.6% more in pounds in May 2022 versus May 2019, but this growth is down substantially from +3.2% when comparing April 2022 to April 2019.”
Source: IRI Integrated Fresh, Total U.S., MULO
Fresh Fruit Sales in May
“In May 2022, berries sales continued to be more than double that of the number two seller, melons,” said Parker. “Pineapples dropped out of the top 10, and cherries made their inroads. Volume sales were a mix with increases for berries and grapes but down results for all other top 10 sellers.”
Source: IRI Integrated Fresh, Total U.S., MULO
Fresh Vegetables Sales in May
“Eight out of the top 10 vegetable sellers grew sales versus year ago,” said Watson. “That is one more than last year. Pound sales were down for most fresh vegetables, with cucumbers being the lone exception in the top 10 sellers.”
Source: IRI Integrated Fresh, Total U.S., MULO
Fresh Produce Absolute Dollar Gains
In May 2022, fresh fruit added $146 million in sales and vegetables added $77 million when compared to May 2021. “The top 10 in absolute dollar gains shows the rising impact of inflation which tends to push shoppers to versatile cooking basics and cost-effective fruits, generally with an eye on shelf life,” said Parker. “Berries ruled new dollars for many months on end, but the decrease in the price per pound meant that new dollars were somewhat subdued in May 2022 compared with areas with high inflation, such as avocados and limes. The one contender bucking that trend are grapes, that had a 12.0% decrease in price, which significantly boosted demand.”
Source: IRI Integrated Fresh, Total U.S., MULO
Perishables Performance
In May, total perishables grew +6.3%, with above-average increases for bakery, deli and refrigerated, which includes dairy. The highest gain versus the pre-pandemic normal was generated by refrigerated, up +26.9% in May of 2022 versus May 2019. The departments still selling more units in May 2022 than they did in May 2019 were deli and produce.
Source: IRI Integrated Fresh, Total U.S., MULO, fixed and random weight items combined into department views
What’s Next?
The war in Ukraine, the renewed COVID lockdowns in China, record inflation, labor shortages and supply chain challenges will have a continued effect on food and food sales in the months to come. Opportunities for retail remain the home-cooked meal with 90% of consumers expecting they will cook from scratch as much (74%) or more often (16%) as last year. Another opportunity is renewed in-person socializing with friends and family with 13% expecting to entertain more.
As grilling season has officially started, finding ways to tie into outdoor cooking and entertaining can be a growth opportunity.
69% plan to host at least one cookout or barbecue to entertain friends and family this summer, typically averaging some six to nine guests, according to the May IRI shopper survey.
Additionally, 71% of consumers plan to grill or cook meals outdoors as much (51%) or more (20%) this summer.
Consumers like experimenting with new items on the grill (37%) and many prefer preparing meat/seafood from scratch (74%), while 17% buy grill-ready items. Consumers are a bit more likely to buy ready-to-eat sides, at 23%.
The next report, covering June, will be released in mid-July. In addition to the data provided here, the IFPA also now offers InSite – an online interactive data set covering both produce and floral performance as well as a look at the 2021 consumer sentiment surveys. Start your free trial today! See www.freshproduce.com/insite for more detail. We also encourage you to contact Joe Watson, IFPA’s VP, Retail, Foodservice and Wholesale, at jwatson@freshproduce.com with any questions or concerns. Please recognize the continued dedication of the entire grocery and produce supply chains, from farm to retailer. #produce #joyoffresh #SupermarketSuperHeroes.
Date ranges:
2019: 52 weeks ending 12/28/2019
2020: 52 weeks ending 12/27/2020
Q1 2021: 13 weeks ending 3/28/2021
Q2 2021: 13 weeks ending 6/27/2021
Q3 2021: 13 weeks ending 9/26/2021
Q4 2021: 13 weeks ending 12/26/2021
Q1 2022: 13 weeks ending 3/27/2022
January 2022: 5 weeks ending 1/30/2022
February 2022: 4 weeks ending 2/27/2022
March 2022: 4 weeks ending 3/27/2022
April: 4 weeks ending 4/24/2022
May: 5 weeks ending 5/29/2022
Anne-Marie Roerink is the President of 210 Analytics.