

The February Marketplace
To understand the ongoing balancing act between time, money and nutrition goals, IRI, 210 Analytics and the International Fresh Produce Association will continue to deliver monthly fresh produce performance reports.
“While inflation is moderating month-over-month, the average price per unit across all food and beverages increased 11.2% year-on-year in February 2023,” shared Jonna Parker, Team Lead, Fresh with IRI. “This adds to a long stretch of months with double digit year-over-year increases. Salaries are not keeping pace, leading to continued concern and a host of money-saving measures among grocery shoppers.”
Inflation Insights
The price per unit across all foods and beverages in the IRI-measured multi-outlet stores, including supermarkets, club, mass, supercenter, drug and military, increased 11.2% in February (the four weeks ending 2/26/2023), which was down from 13.2% in January 2023. Compared with February 2020, prices across all foods and beverages were up 30.2%.
| Average price/unit vs. YA | 2018 | 2019 | 2020 | 2021 | 2022 | Q4 2022 | Jan 23 | Feb 23 |
| Total food & beverages | +1.5% | +2.0% | +5.1% | +5.4% | +12.5% | +13.5% | +13.2% | +11.2% |
Fresh produce prices were also up over 2022, but a relatively low +2.4% on a per-pound basis. Fresh fruit prices decreased 3.0% in comparison to February 2022. Vegetable inflation averaged 7.3% in February, which is also down from the 52-week levels.
| Price per volume (lbs) | Price/volume | Change vs. YA | Change vs. 3YA |
| Total fresh produce February 2023 | $2.64 | +2.4% | +15.8% |
| Total fresh produce latest 52 weeks thru 2/26/23 | $1.84 | +7.8% | +17.1% |
| Fresh fruit February 2023 | $2.92 | -3.0% | +15.4% |
| Fresh fruit latest 52 weeks thru 2/26/23 | $1.70 | +7.3% | +19.5% |
| Fresh vegetables February 2023 | $2.39 | +7.3% | +15.5% |
| Fresh vegetables latest 52 weeks thru 2/26/23 | $1.97 | +8.4% | +14.9% |
February 2023 Sales
The four February 2023 weeks brought $60.4 billion in total food and beverage sales, which was up from $58.1 billion in the four January weeks. Dollars were up 7.9% versus February 2022, but unit sales dropped 3.0% behind and trailed February 2020. Perishables, including produce, seafood, meat, bakery and deli, had a slightly below-average dollar performance (+6.3%) but had the better unit performance (-2.5%). Center store sales increased 10.7%, but this was fully inflation-boosted with units down 3.4%.
| February 2023 % change | Latest 52 weeks % change | ||||||||
| Dollar size | Dollars vs. YA | Dollars vs. 3YA | Units vs. YA | Units vs. 3YA | Dollars vs. YA | Dollars vs. 3YA | Units vs. YA | Units vs. 3YA | |
| Total food & beverages | $60.4B | +7.9% | +28.8% | -3.0% | -1.1% | +9.0% | +27.4% | -3.4% | +0.7% |
| Total perishables | $26.4B | +6.3% | +26.4% | -2.5% | +0.0% | +8.3% | +25.7% | -3.0% | +1.2% |
| Total grocery (center store) | $30.1B | +10.7% | +33.0% | -3.4% | -1.9% | +11.0% | +31.0% | -3.7% | +0.4% |
February 2023 fresh produce sales reached 5.7$ billion, up $18 million from January and an increase of 1.6% over February 2022 levels. “Consumers are starting to respond to the more favorable pricing in fresh fruit,” Parker said. “In fact, in the comparison to pre-pandemic sales levels, both fresh fruit and vegetables look quite favorable in unit sales, unlike other categories.”
| February 2023 % change | Latest 52 weeks % change | ||||||||
| Dollar size | Dollars vs. YA | Dollars vs. 3YA | Units vs. YA | Units vs. 3YA | Dollars vs. YA | Dollars vs. 3YA | Units vs. YA | Units vs. 3YA | |
| Total fresh produce | $5.7B | +1.6% | +19.2% | -0.8% | +3.0% | +4.3% | +20.2% | -3.1% | +4.6% |
| Fresh fruit | $2.8B | -1.0% | +11.3% | +2.0% | +5.5% | +3.8% | +22.2% | -2.0% | +6.6% |
| Fresh vegetables | $2.9B | +4.2% | +16.8% | -2.9% | +1.1% | +4.8% | +18.5% | -4.0% | +3.1% |
| Produce department | Dollar sales | $ vs. YA | lbs vs. YA |
| February 2023 | $5.7B | +1.6% | -1.2% |
| w.e. 2/5/2023 | $1.4B | +1.7% | -2.3% |
| w.e. 2/12/2023 | $1.5B | +1.7% | -1.2% |
| w.e. 2/19/2023 | $1.4B | +1.8% | -1.2% |
| w.e. 2/26/2023 | $1.4B | +1.2% | -0.2% |
Weekly sales were fairly consistent in February, averaging around $1.4-1.5 billion each. Pound sales trailed February 2022 by 1.2%, with the best year-on-year performance during the final week of the month when pounds sales were virtually on par with the levels seen in February 2022.
“Dollar growth for fruit had been slowing in the past few months due to moderating levels of inflation,” said Watson. “In January, dollars dipped below year ago levels but growth recovered in February to +1.6% overall. Fruit remains below year ago levels as deflation was not offset by a boost in demand but rather stable levels when compared to February 2022.”
Source: IRI Integrated Fresh, Total U.S., MULO
Fresh Produce Share of Total Fruits and Vegetables
“The difference in inflationary levels between fresh, frozen and canned is staggering,” Parker commented. “The averages for the price per unit for frozen and canned fruits and vegetables are up 22.9% and 17.7%, respectively, compared to just 2.4% for fresh. And yet, the survey shows that high price perception for fresh produce among consumers.”
| February 2023 | Dollar sales | Dollar sales gains vs. YA | Unit gains vs. YA | Average price per unit | Increase price vs. YA |
| Fresh produce department | $5.7B | +1.6% | -0.8% | $2.64 | +2.4% |
| Frozen fruits and vegetables | $672M | +15.7% | -5.8% | $3.30 | +22.9% |
| Shelf stable fruits | $366M | +6.0% | -9.9% | $3.46 | +17.7% |
| Shelf stable vegetables | $530M | +8.3% | -8.0% | $1.51 | +17.7% |
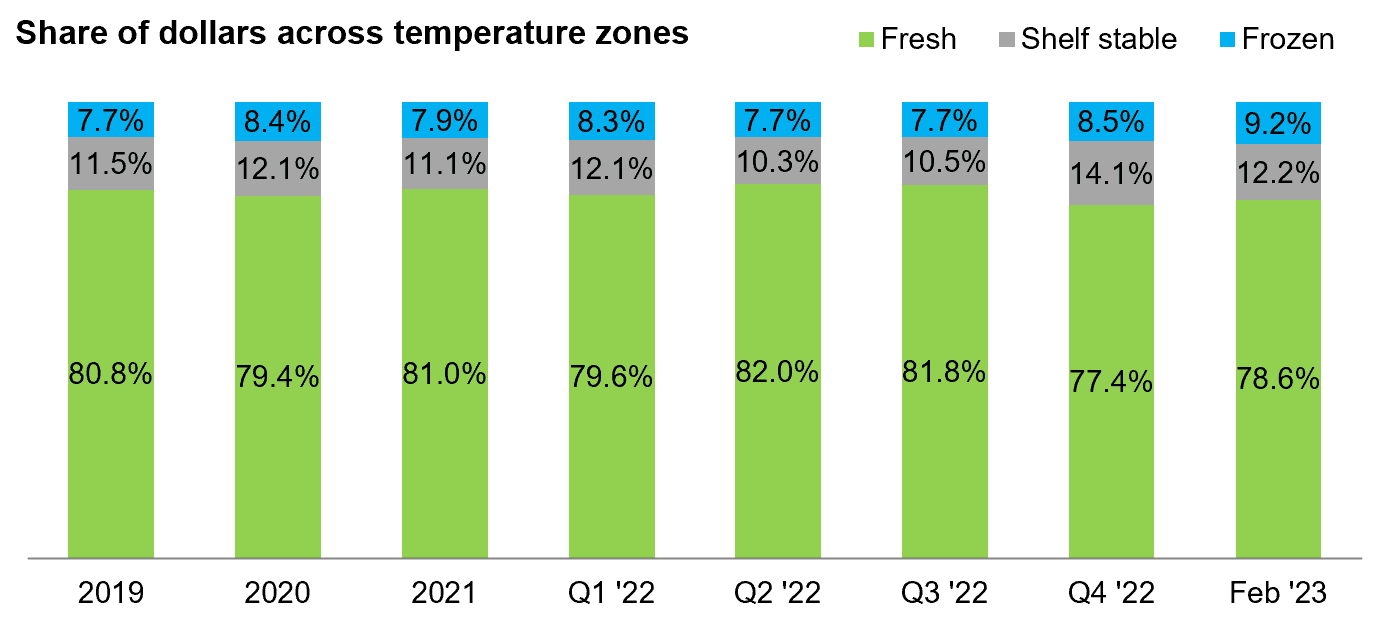
In February 2023, the share of fresh fruit and vegetables stood at 78.6% of dollar sales and 78.4% of pound sales of combined fresh, frozen and shelf-stable fruit and vegetable sales at retail.
The share of frozen increased to 9.2% of dollars due to above-average inflation.
Fresh Produce Dollars versus Volume
Fresh produce pound sales have trailed behind year ago levels since March 2021, but got to within 1.2% of year-ago levels in February 2023. Additionally, more pounds are being sold today than in February 2020, which was still unaffected by the pandemic shopping patterns.
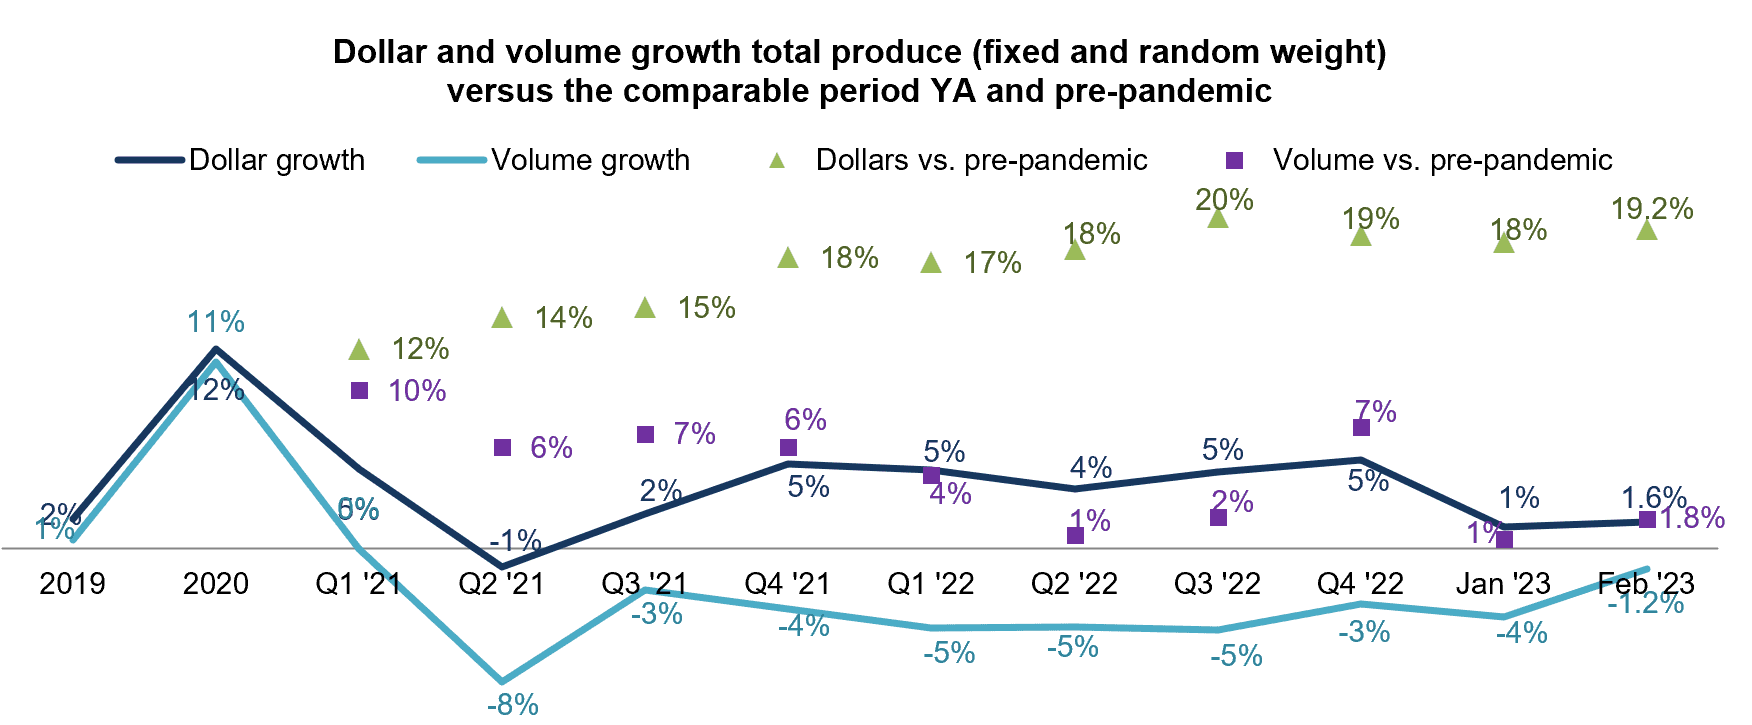
The more favorable retail prices for fruit resulted in steady volume sales when compared to February 2022. Volume demand for vegetables continued to trend below year ago levels.
Fresh Fruit Sales
| Top 10 in sales | February 2023 | ||||
| Type | $ sales | $ vs. YA | Lbs vs. YA | ||
| Fresh fruit | $2.8B | -1.0% | +0.0% | ||
| Berries | $774M | +1.9% | +1.4% | ||
| Apples | $350M | -2.5% | -5.4% | ||
| Grapes | $281M | -0.6% | +3.5% | ||
| Bananas | $264M | +3.3% | +0.4% | ||
| Avocados | $187M | -18.5% | +3.1% | ||
| Mandarins | $173M | -4.0% | +1.8% | ||
| Melons | $151M | +6.5% | +0.9% | ||
| Oranges | $111M | -13.4% | -13.8% | ||
| Mixed fruit | $76M | +4.3% | +0.9% | ||
| Pineapples | $72M | +5.9% | +6.3% | ||
“February brings some good news on the fresh fruit side of things,” said Parker. “For many months we had been reported on inflation-driven gains in the top 10 sellers. This month proves that more favorable pricing can indeed drive demand with year-over-year pound gains for berries, grapes, bananas, avocados, mandarins, melons, mixed fruit and pineapples.”
However, while eight out of the top 10 fruit sellers in February grew pound sales, this did not automatically equate in an equal boost in dollars. Only five out of 10 top sellers increased dollar sales, with avocado sales down double-digits.
Fresh Vegetables Sales
| Top 10 in sales | February 2023 | |||
| Type | $ sales | $ vs. YA | Lbs vs. YA | |
| Fresh vegetables | $2.9B | +4.2% | -2.6% | |
| Tomatoes | $316M | +5.4% | -1.4% | |
| Potatoes | $304M | +15.5% | -5.3% | |
| Lettuce | $238M | +11.4% | +0.5% | |
| Salad kits | $234M | -1.3% | -6.2% | |
| Onions | $217M | +9.1% | +4.7% | |
| Peppers | $202M | +1.6% | -1.2% | |
| Cucumbers | $116M | +13.4% | +4.1% | |
| Carrots | $113M | +3.7% | -4.3% | |
| Broccoli | $107M | +4.0% | -2.2% | |
| Mushrooms | $97M | -6.9% | -13.2% | |
“Vegetable sales did not benefit from deflation and this can be seen in a more mixed volume performance compared to fresh fruit,” said Watson. “A few items got close to or exceeded year-ago levels in terms of pound sales, being lettuce, onions and cucumbers.”
The alternating power of value versus convenience can be seen in strong sales for both lettuce and salad kits, the number three and four sellers. However, whereas lettuce grew pounds, salad kits sales decreased by 6.2% though pound sales remained ahead of the February 2020 (pre-pandemic) levels.
Fresh Produce Absolute Dollar Gains
| Top 10 absolute | February 2023 | |||
| dollar growth | $ gain | $ sales | Lbs vs. YA | |
| Potatoes | +$40.7M | $3.4M | -5.3% | |
| Lettuce | +$24.3M | $238M | +0.5% | |
| Onions | +$18.1M | $217M | +4.7% | |
| Tomatoes | +$16.3M | $316M | -1.4% | |
| Berries | +$14.5M | $774M | +1.4% | |
| Cucumbers | +$13.7M | $116M | +4.1% | |
| Cherries | +$10.4M | $29M | +79.1% | |
| Melons | +$9.3M | $152M | +0.9% | |
| Celery | +$8.4M | $79M | -6.7% | |
| Bananas | +$8.4M | $264M | +0.4% | |
In February 2023, fresh vegetables added $2.9 billion in additional dollars versus February 2022 whereas total fruit lost some ground. While a few fruits made it into the top 10 items that gained the most in dollars, the top three placements go to vegetables. “Super Bowl made a mark with strong celery sales,” said Watson. “But otherwise, we are seeing the impact of a market under economic pressure with many consumers retreating into staples, such as potatoes, lettuce and onions.”
Perishables Performance
| Perimeter | February 2023 | ||||
| departments | $ sales | $ vs. YA | Units vs. YA | ||
| Meat | $6.4B | -0.3% | -3.8% | ||
| Refrigerated (mostly dairy) | $6.9B | +15.6% | -3.4% | ||
| Produce | $5.7B | +1.6% | -0.8% | ||
| Deli | $3.5B | +6.7% | -2.8% | ||
| Bakery | $3.3B | +11.2% | -3.2% | ||
| Seafood | $544M | +3.5% | +3.0% | ||
With heavy inflation in eggs and other dairy items, the total refrigerated department generated a 15.6% increase in sales to reach $6.9 billion in February. However, unit sales were down 3.4%. Fresh produce had the strongest unit performance, even if it was down as well. Seafood experienced dollar and unit growth for the first time in more than 18 months, though unit sales trended below the February 2020 pre-pandemic levels by 2.6%.
What’s Next?
The first quarter of 2023 looks to be little different from 2022 with inflation taking the spotlight in virtually all food-related decisions. While consumers see home-prepared meals as more cost effective and healthier, restaurants win two out of three occasions when consumers lack for time or are not in the mood to prepare dinner (source: 210 Analytics, Nov. 2022).
The wide variety of money-saving measures continues to put a lot of pressure on unit and volume sales, that has now fallen below pre-pandemic levels for several departments across the store. Labor cost and availability, ingredient inputs, weather and transportation conditions remain areas of concern as prices are lapping the double-digit increases of 2022.
Special occasions remain a big opportunity for food retail in 2023, according to the latest IRI consumer surveys. Among consumers who have thought ahead to Easter/Passover, 51% plan a special meal for their households (22%), extended group of friends or family (21%) or other activities such as out-of-state travel. The average party size is leveling out at seven to eight people, following several years of smaller group sizes related to Covid-19.
The February IRI survey found that 17% say their financial situation is a little or a lot better than last year, but 42% say they are a little or a lot worse off now than last year. Looking ahead to a year from now, 26% believe their financial situation will be better versus 32% believing it will be worse. This likely means continued cautious and planned spending, but not a race to the bottom.
The next report, covering March, will be released in mid-April. In addition to the data provided here, the IFPA also provides a look at the floral performance and consumer sentiment. We also encourage you to contact Joe Watson, IFPA’s VP, Retail, Foodservice and Wholesale, at jwatson@freshproduce.com with any questions or concerns. Please recognize the continued dedication of the entire grocery and produce supply chains, from farm to retailer. #produce #joyoffresh #SupermarketSuperHeroes.
- 2019: 52 weeks ending 12/28/2019
- 2020: 52 weeks ending 12/27/2020
- 2021: 52 weeks ending 12/26/2021
- 2022: 52 weeks ending 1/1/2023
- Q4 2022: 13 weeks ending 1/1/2023
- January 2023: 4 weeks ending 1/29/2023
- February 2023: 4 weeks ending 2/26/2023
