

The April Marketplace
The shift in Easter/Passover dates from early- to mid-April moved holiday dollars from March to April, and as such, from the first to the second quarter. Easter is typically a big selling season for fresh produce and was the most disrupted of the major holidays in 2020 when most states were under shelter-in-place mandates.
In its Easter 2022 overview, the National Retail Federation found that consumer engagement was nearly back to pre-pandemic levels, with 80% celebrating. Average per person spending on all holiday-related purchases was $170 — a three-year low. Amid 40-year high inflation, consumers expected to spend more on food, but pulled back on spending in all other categories, including clothing, gifts and decorations.
Inflation not only took the headlines for the Easter holiday, but also dominated everyday spending.
“The April 2022 IRI survey of primary shoppers found that 90% of consumers believe food prices are somewhat or a lot higher than last year, of whom 96% are concerned about it,” shared Jonna Parker, Team Lead Fresh for IRI. “This includes 53% who are extremely concerned — the first time this number has moved past half of the population. This compares to 23% of consumers being extremely concerned over coronavirus in this same survey — meaning inflation has a far greater grip on the nation’s food spending than COVID-19 at this point in time.”
As a result of inflation, consumers are taking a wide variety of measures, according to the April IRI survey:
- 35% of consumers are planning on cutting back on restaurant spending, however, that may not automatically translate into fewer restaurant visits. In fact, the consumer estimated share of meals prepared at home dropped slightly below 80%, to 78.8%. This points to consumers visiting restaurants a bit more than during December through February, but they are finding ways to reduce their spending. Restaurant takeout remains big, at 52% of consumers having ordered restaurant takeout in April 2022, which may also be a money-saving tactic versus eating on premise. “There is an opportunity here for fresh produce,” said Parker. “Items like salad kits, fruit or veggie platters or fresh produce snack items are ideally positioned to complement takeout food such as pizza, burgers, etc. In this way, retail may not get all the dollars, but remains in the game.”
- Opportunities for retail remain the home-cooked meal with 91% of consumers expecting they will cook from scratch as much (72%) or more often (19%) as last year. Another opportunity is renewed in-person socializing with friends and family with 15% expecting to entertain more. “We absolutely see this in the numbers,” added Parker. “For several months now, sales of fruit and vegetable trays and platters have been among the growth leaders. In-stock availability, a variety of sizes and playing into the hot streak of charcuterie are great ways to grow sales.”
- The slight increase in online shopping hand-in-hand with the Omicron wave of COVID-19 has also receded. Describing their last grocery shopping trip, 13% of consumers shopped online and 87% shopped in person. Among those shopping online, pickup was slightly more popular (7%) than delivery (6%).
- An ever-growing 78% of consumers, up from 72% in March, are making one or more changes to save money while shopping for groceries. While consumers tried to combine all grocery needs into one store, one trip in the past few years, 17% of consumers now visit multiple retailers to get the best deals. More commonly, 47% of consumers are looking for sales promotions. However, in the volatile market, both the frequency of promotions and the depth of the discounts are down significantly versus pre-pandemic across departments and consumers are recognizing this. The survey found that 55% of consumers are finding fewer items they want on sale and 44% believe that when they find promotions, the discounts offered are not as deep as in prior years.
- More than half of consumers, 51%, are now stocking up on certain items. This is driven by concerns over out-of-stocks (24%) and worries that prices may rise further (20%).
“These consumer money-saving measures combined with the continued volatility on the supply side are creating an environment of continued change and uncertainty,” said Joe Watson, VP, Retail, Foodservice & Wholesale for IFPA. To document the ever-changing nature of the marketplace, IRI, 210 Analytics and IFPA continue to team up to bring the latest trends and analysis relative to the produce department.
Inflation Insights
The price per unit across all foods and beverages in the IRI-measured multi-outlet stores, including supermarkets, club, mass, supercenter, drug and military, accelerated further to an increase of 10.7% in the four weeks ending April 24, 2022 (“April”) versus the same four weeks in 2021. Inflation was in the double digits in the center of the store as well as in perishables and compared to April 2019, prices across all foods and beverages were up 21.3%.

Fresh produce prices were also up from last year, at +8.7% level on a per unit basis and +10.1% on a per pound basis. The increases are predominantly driven by fruit, that had double-digit inflation once more in both the four-week and 52-week view.
“The average price per pound across fruits and vegetables was $1.89, unchanged from March,” said Watson. “The moderation in inflation on the vegetable side is finally leading to some price stability month-over-month, even if compared to year ago, we are still looking at robust increases. Based on input from retail produce professionals around the country, I remain positive going into the summer season. While elevated freight costs will likely persist, summer typically means more regional crops, which could lessen the burden of high transportation costs.”

April 2022 Sales
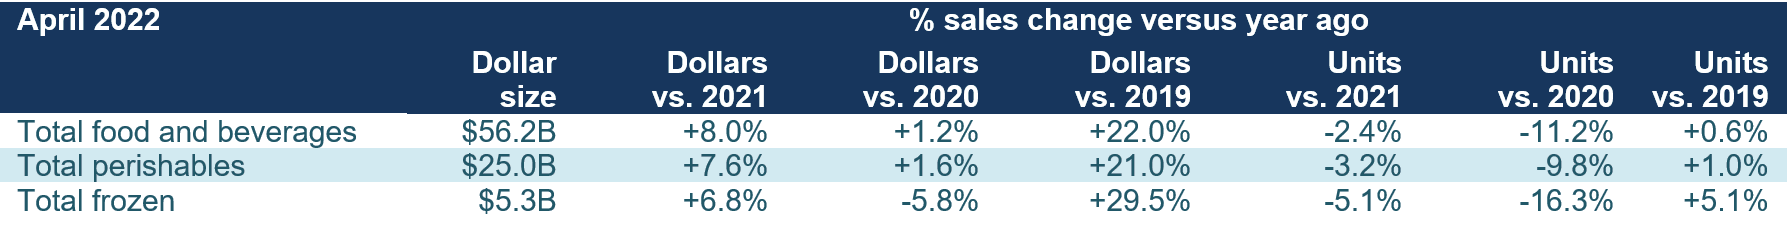
The four April 2022 weeks brought $56.2 billion in total food and beverage sales, which was up from $54.3 billion in March — likely boosted by the later Easter/Passover timing. Compared with April 2021, dollars increased 8.0% and compared with pre-pandemic, April sales were up 22.0%. Inflation played a significant role with year-on-year unit sales down 2.4%. Perishables, including produce, seafood, meat, bakery and deli, had slightly above average growth, at +7.6%. Frozen foods had the highest increase versus pre-pandemic, at +29.5%.
April 2022 fresh produce sales reached $5.7 billion, surpassing the record set in 2021 by 4.3%. Month-over-month, April sales were slightly higher than March, likely because of the shift in Easter/Passover timing. However, looking beyond dollars that were highly affected by inflation shows unit and volume declines.
“There are many forces at play relative to the volume pressure,” said Watson. “Restaurant sales are ticking up a bit again, frozen and shelf-stable play a role, and there is the impact of supply chain disruption and out-of-stocks. Assortment has been affected by the labor, transportation and other supply chain issues. We can’t sell what we don’t have, so some of the unit and volume pressure may simply be our inability to meet demand. Fresh mushrooms are a good example of that.”

The changes in the timing of Easter/Passover prompted some ups and downs in the individual April weeks. As Easter fell on April 4th last year, sales were down year-on-year the first week of April.
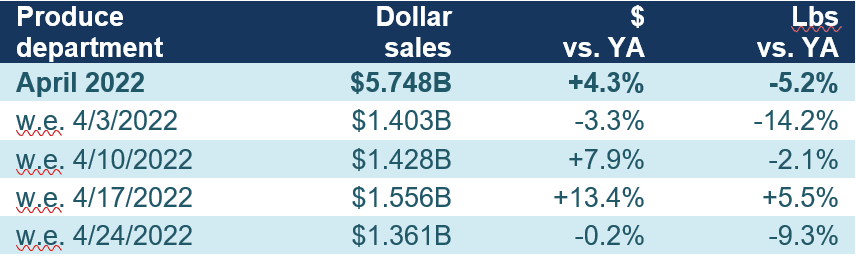
However, sales during Easter week this year reached $1.6 billion, the biggest week of the four. That translated into a 13.4% increase over year ago and a 5.5% increase in volume. The non-holiday weeks generated about $1.4 billion, each, which is very similar to the weekly levels seen in the December through March weeks.
April was the first time vegetable sales were decidedly above year-ago levels since the second quarter of 2021.
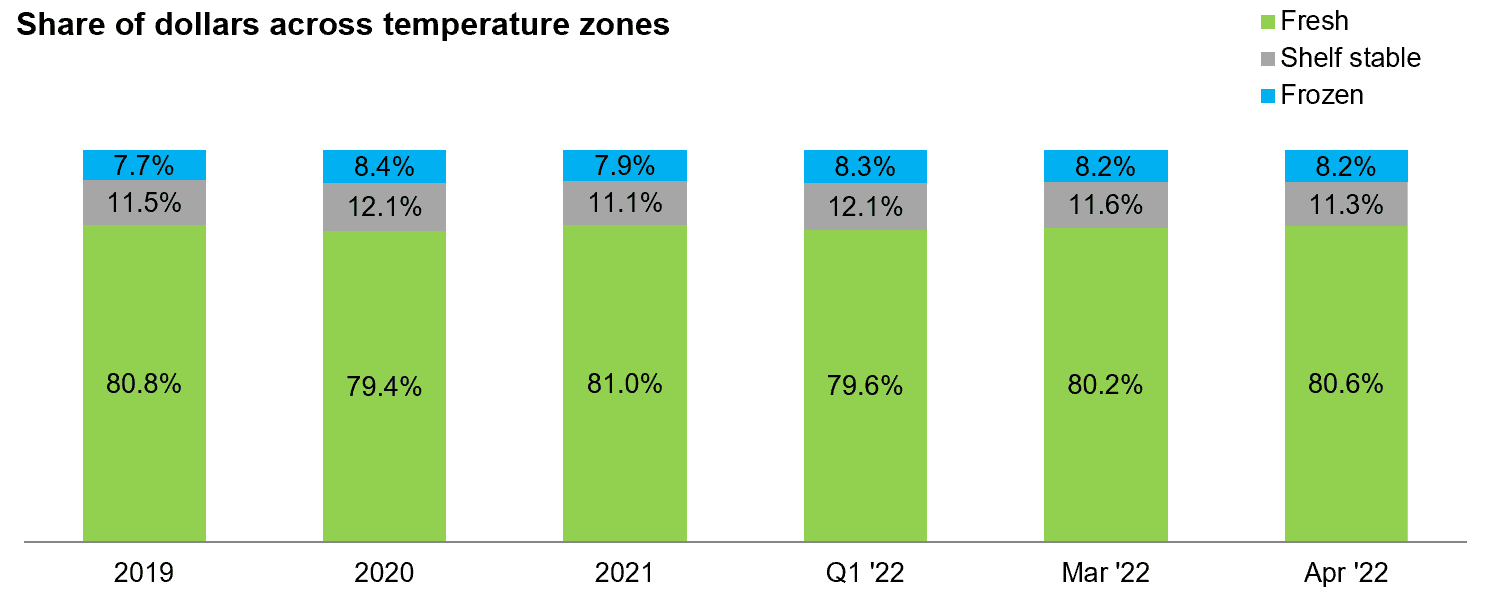
Fresh Produce Share of Total Fruits and Vegetables
Shelf-stable fruits and vegetables had double-digit inflation in April 2022 compared with April 2021. This resulted in above average dollar gains. Both frozen and shelf-stable are heavily impacted by supply chain disruptions. Both assortment and inventory levels have been down significantly over recent months.
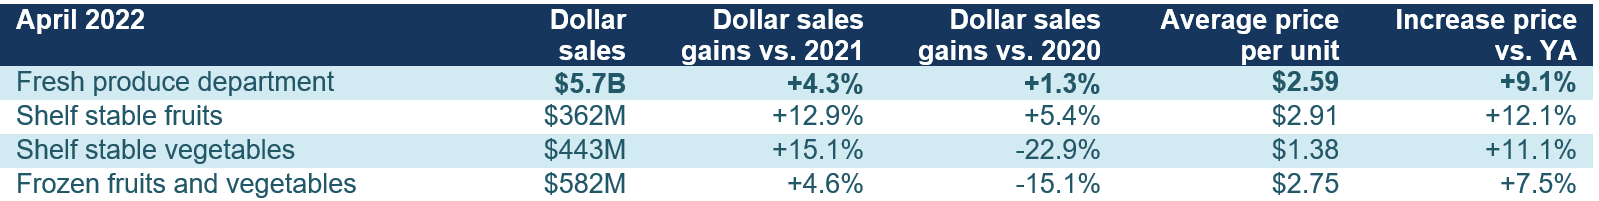
In the first quarter of 2022, just under 80% of total fruit and vegetable dollars were generated by the fresh produce department. March and April 2022 brought some recovery to the fresh share. In April, fresh produce represented 80.6% of total fruit and vegetable dollars. Frozen remained at 8.2% despite below-average inflation. As a share of total pounds sold across the three areas, fresh produce made up 78.9%, which was up from 78.3% in March and 77.2% in the first quarter. Shelf-stable fruits and vegetables represented 13.0% of pounds in the first quarter.
Fresh Produce Dollars versus Volume
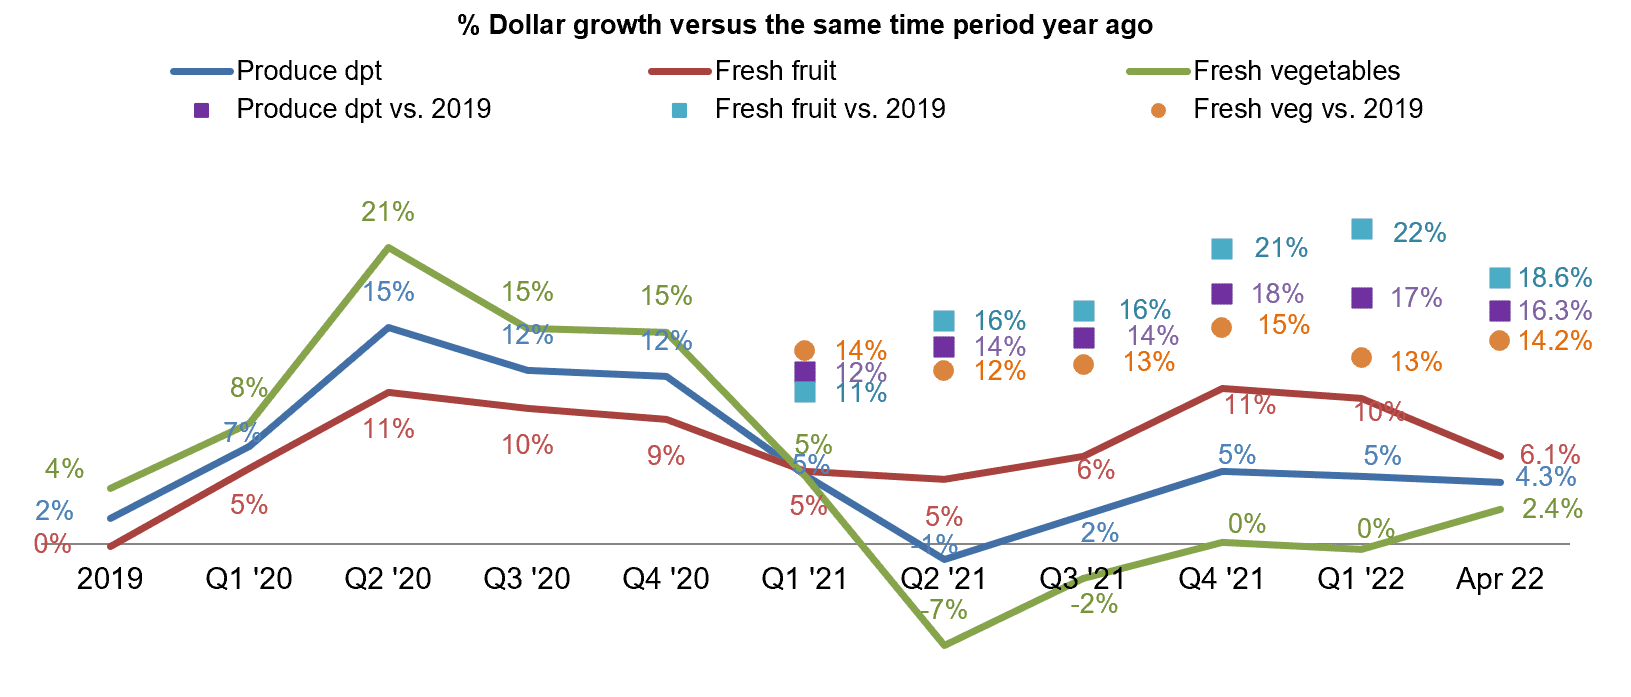
Fresh produce pound sales trailed behind year ago levels all throughout 2021 and the first quarter of 2022. In April 2022, pound sales were down 5.2% year-on-year — its lowest level since the second quarter of 2021. Importantly, compared with 2019, the pre-pandemic normal, dollars remain 16.3% ahead (green triangles) but pound sales were a mere 0.7% higher (purple squares). When following the purple square trendline (pounds versus 2019), there is a continued month-to-month decrease from +10% in the first quarter of 2021 to +0.7% in April 2022.

“The volume pressure came from the fruit side,” explained Parker. “Fruit pound sales were down 1.6% versus the pre-pandemic normal of 2019. Vegetables, on the other hand, did still sell 3.2% more in pounds than they did in April 2019.”

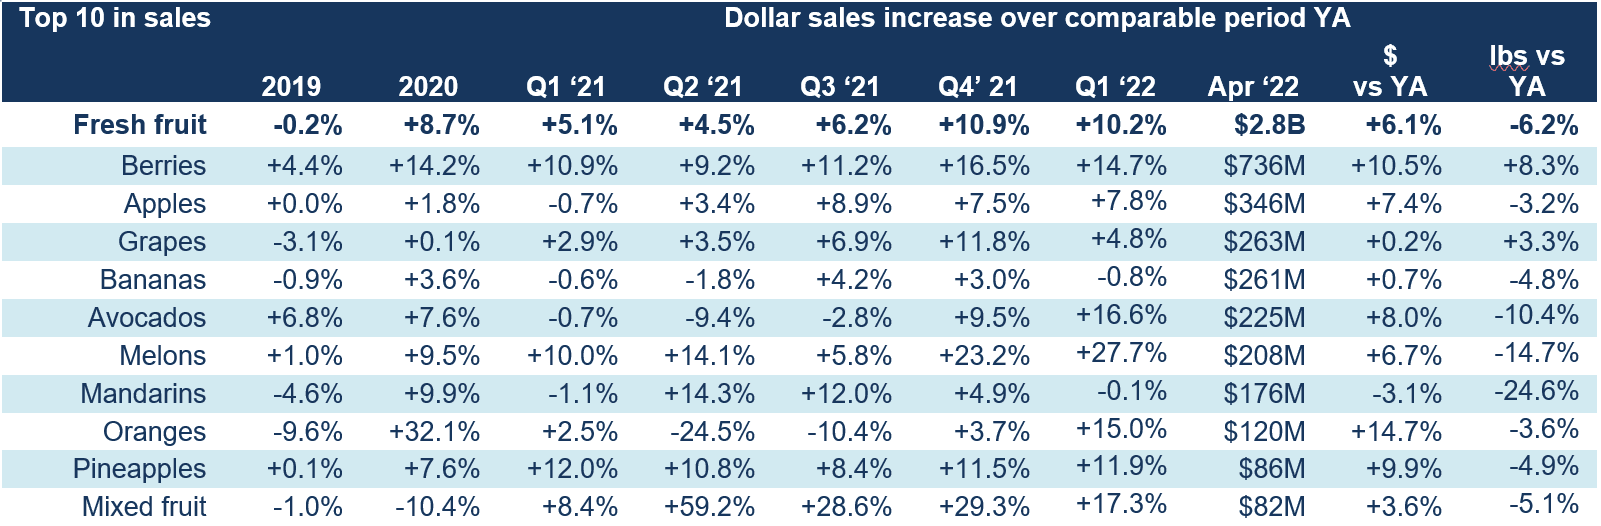
Fresh Fruit Sales in April
“April, unsurprisingly, saw continued dominance in berries with sales more than double that of the second-largest seller, apples,” said Parker. “Pineapples were of course the Easter seasonal highlight, but grapes were an interesting story as the only other category besides berries to achieve volume gains.”
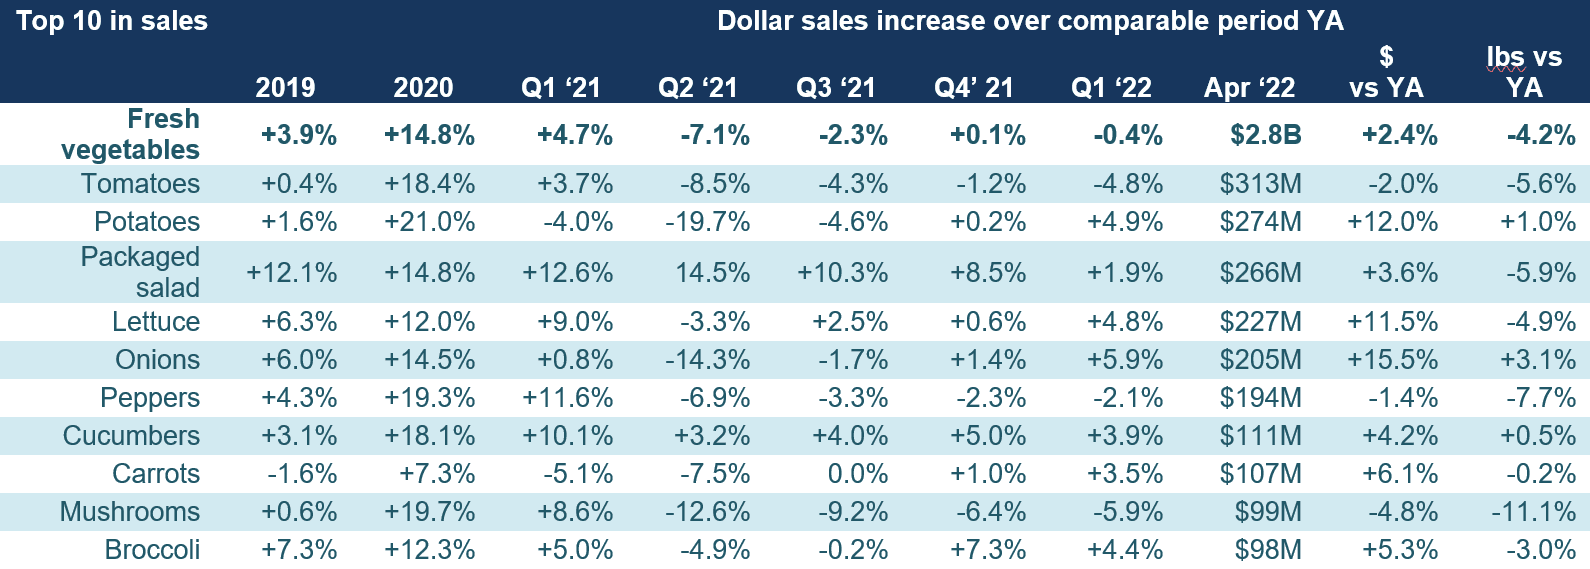
Fresh Vegetables Sales in March
“Seven out of the top 10 vegetable sellers grew sales versus year ago,” said Watson. “Pound sales were down for most fresh vegetables, with a few exceptions, being potatoes, onions and cucumbers.”
Fresh Produce Absolute Dollar Gains
“The top 10 in absolute dollar gains shows the overwhelming strength of berries in today’s marketplace as well as Easter dinner staples in potatoes and onions,” said Parker. “Berries have, by far, the lowest level of inflation, at +2.0% and yet added $70 million in new dollars. The inflation boost was clearest for limes, at 44%, resulting in $13 million in new dollars.”

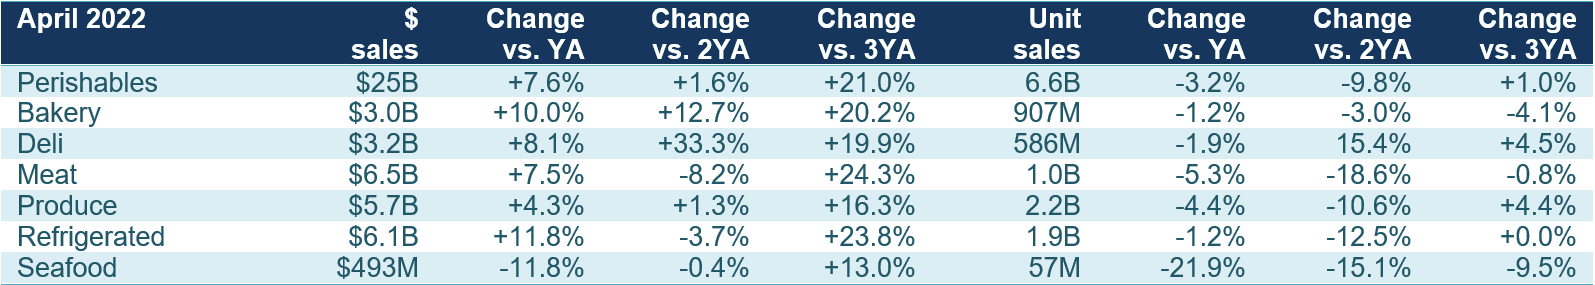
Perishables Performance
In April, total perishables grew 7.6%, with above-average increases for bakery and refrigerated, which includes dairy. The highest gain versus the pre-pandemic normal was generated by meat, up 24.3% in April of 2022 versus April 2019. The departments still selling more units in April 2022 than they did in April 2019 are deli and produce.
What’s Next?
The war in Ukraine, the renewed COVID lockdowns in China, record inflation, labor shortages and supply chain challenges will have a continued effect on food and frozen food sales in the months to come.
- Inflation is likely to boost dollar sales while pressuring unit and volume sales.
- More Americans are growing worried about their financial health and ability to purchase what they need.
- 38% of households report that their current financial health is strained.
- 32% of household expect their financial situation will look worse a year from now.
- Online shopping seems to be plateauing in engagement: 3% expect to purchase all groceries online, whereas 69% expect to exclusively purchase in-store. The remaining 28% have a hybrid system in which they buy some items online, others in person. This is the most likely area of continued sales growth for grocery e-commerce in case of increased online shopping frequency and/or greater online spending.
The next report, covering May, will be released in mid-June. In addition to the data provided here, the IFPA also now offers InSite – an online interactive data set covering both produce and floral performance as well as a look at the 2021 consumer sentiment surveys. Start your free trial today! See www.freshproduce.com/insite for more detail. We also encourage you to contact Joe Watson, IFPA’s VP, Retail, Foodservice and Wholesale, at jwatson@freshproduce.com with any questions or concerns. Please recognize the continued dedication of the entire grocery and produce supply chains, from farm to retailer. #produce #joyoffresh #SupermarketSuperHeroes.
Date ranges:
2019: 52 weeks ending 12/28/2019
2020: 52 weeks ending 12/27/2020
Q1 2021: 13 weeks ending 3/28/2021
Q2 2021: 13 weeks ending 6/27/2021
Q3 2021: 13 weeks ending 9/26/2021
Q4 2021: 13 weeks ending 12/26/2021
Q1 2022: 13 weeks ending 3/27/2022
January 2022: 5 weeks ending 1/30/2022
February 2022: 4 weeks ending 2/27/2022
March 2022: 4 weeks ending 3/27/2022
April: 4 weeks ending 4/24/2022
