
November 2021 picked up where October left off: grocery shopping and food consumption patterns remained in flux, especially as holiday purchases started much earlier.
Combined with record-setting inflation and substantial supply chain constraints, the market has yet to find a new and consistent level of balance.
IRI, 210 Analytics and the Produce Marketing Association (PMA) have teamed up since March 2020 to document the ever-changing marketplace and its impact on fresh produce sales.
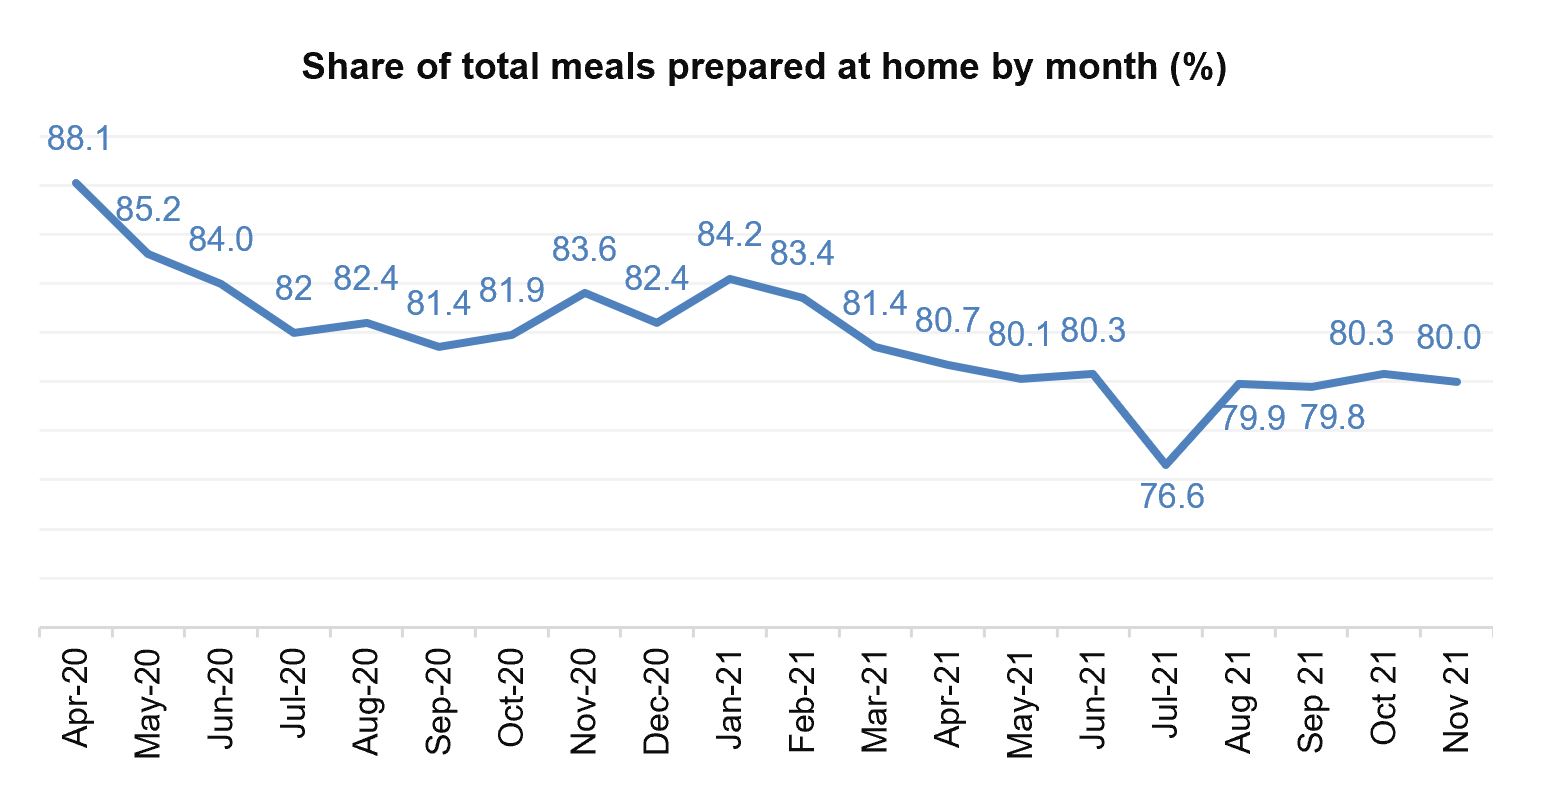
Meals continued to be home-centric in November. Jonna Parker shared some insights from the November IRI primary shopper survey. “The share of meals prepared at home remains around 80% despite more people working away from home and most of the nation’s school children being back to in-person education.”
While retail prices for most categories rose to their highest point in many decades, the cost for eating out rose even faster. Restaurant inflation typically results in more at-home meal preparation but those levels have already been elevated since the onset of the pandemic.
Parker noted that shoppers are very aware of the widespread inflation: 90% of primary shoppers reported grocery item prices being a little (42%) or much (48%) higher. Among consumers who noted higher prices, 92% are extremely (41%) or somewhat concerned (51%).
“This translates into 83% of primary shoppers being aware and concerned of the inflationary conditions,” said Parker.
Consumers selected categories across the store as areas where they have noted higher prices, led by the meat, produce and dairy categories. In response, 61% of consumers have made changes to their grocery selection. Looking for money-saving measures, including stocking up, is the most common response, followed by cutting back on non-essentials and switching to store brand alternatives.
Beyond inflation, COVID-19 continues its grip on shopping patterns. During the early months of the pandemic, as many as 20% of trips were online, according to the IRI survey tracker. This dropped to a low of 11% in July of 2021 and the share has ticked back up every month since. In November, the online share of trips increased to 17%.
Yet online shopping remains a complementary trip for most consumers. Only 4% of survey respondents believe they will buy all their groceries online in the next month. This compares to 19% who will only buy some or a little online. While shopping in person, fewer people browsed for new items or ideas and 17% spent less time in the store than pre-pandemic.
“This underscores the importance of cross-merchandising, eye-catching displays, suggestive selling and more to make sure fresh produce remains on the consumer radar,” added Parker.
November sales are typically dominated by the Thanksgiving holiday, which tends to push an above-average share of dollars to the fresh departments. In 2020, Thanksgiving was very home-centric. Many fewer people traveled, parties were smaller and Thanksgiving sales patterns were vasty different.
In the October 2021 IRI survey among primary grocery shoppers, more people planned to celebrate Thanksgiving this year and party sizes were expected to be bigger. At the same time, celebrations remained mostly home-centric though many restaurants and grocery deli’s offered turnkey holiday meal solutions and shoppers planned to shop earlier. The Transportation Security Administration (TSA) reported its highest passenger volume since the onset of the pandemic, at about 88% of the pre-pandemic volume.
Year-to-Date Sales
The first 11 months of the year brought $633 billion in food and beverage sales —up 1.3% over 2020 and 15.6% over the 2019 pre-pandemic normal. However, inflation played a significant role with year-on-year unit sales still down 3.5%. Perishables, including produce, seafood, meat, bakery and deli, had the highest year-over-year growth during the first 10 months of 2021, at +1.8%. Frozen foods had the highest increase versus the pre-pandemic normal of 2019, at +22.8%.

Inflation
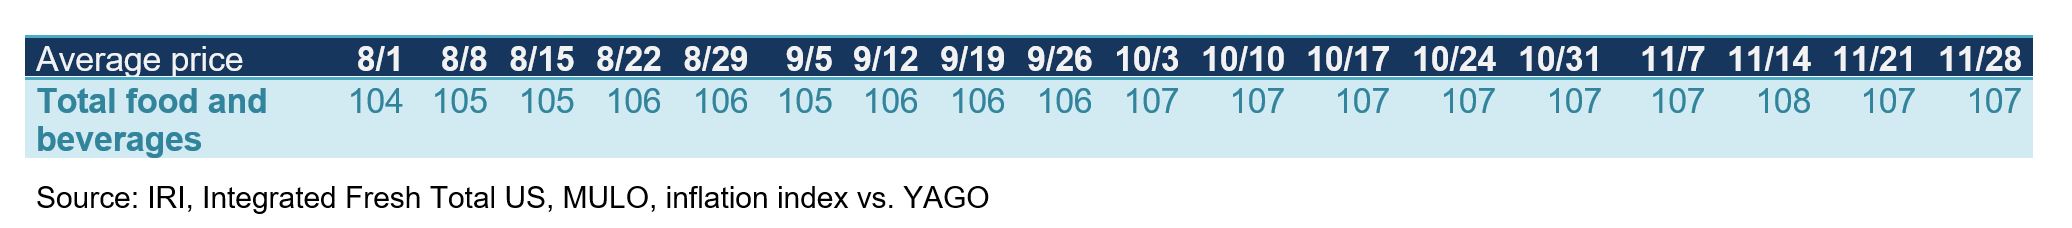
The consumer price index increased 6.8% in November 2021, the largest year-over-year increase in 39 years, according to the Labor Department. IRI-measured price per volume also shows that prices continued to rise over and above their elevated 2020 levels for food and beverages, indexing at 107 for each of the November weeks.
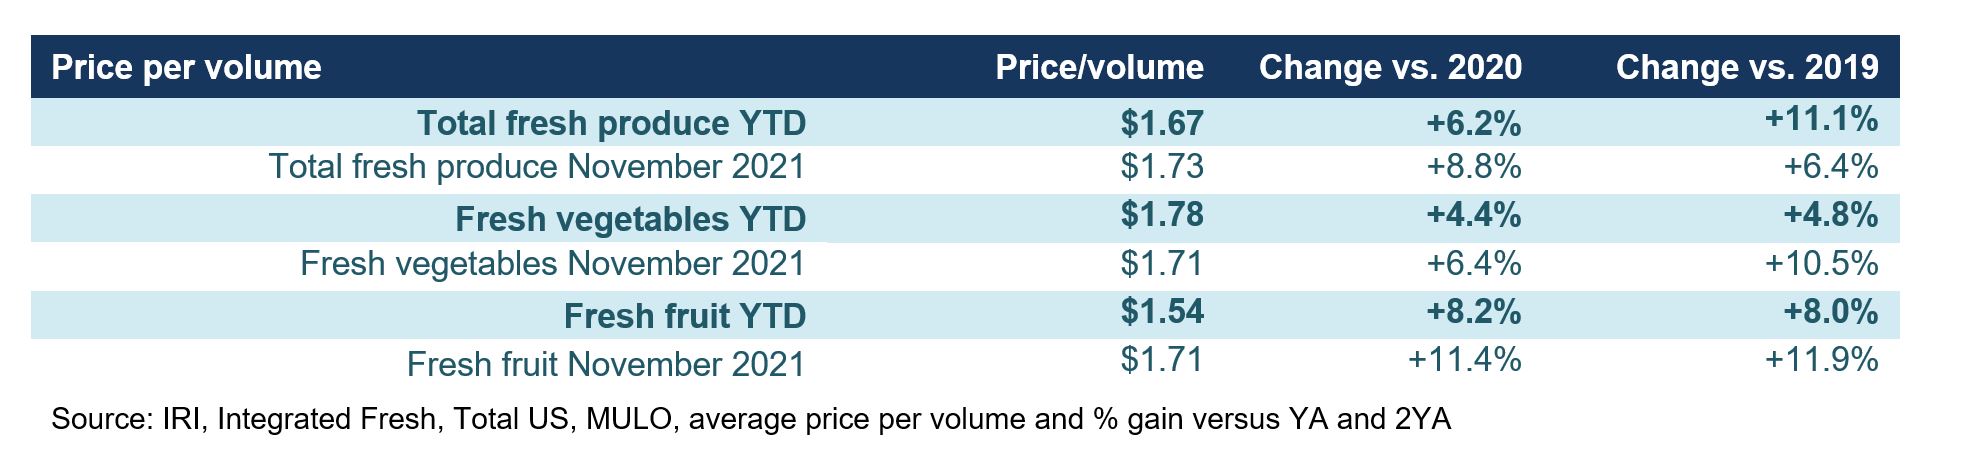
Fresh produce prices are also higher than last year. Year-to-date, prices for total fresh produce are about 6% higher than they were last year. Inflation for fruit is above average, at +8.2% year-to-date through November 28. Fruit prices during November 2021 were 11.9% higher than in November 2020.
“Supply chain challenges continue to affect fresh produce pricing and availability,” said Joe Watson, VP of Membership and Engagement for PMA. “Fresh produce certainly is not alone in this but shoppers are also more fluid than I have ever seen before in switching between fresh, frozen and shelf-stable, which means inflation and promotional levels in those other areas can affect the fresh purchase more than ever.”
Inflation for frozen fruit and vegetables was lower in November 2021, at +4.9% versus year and shelf-stable fruit and vegetables saw price increases of 5.6%.
Week-by-Week Sales Fresh Produce
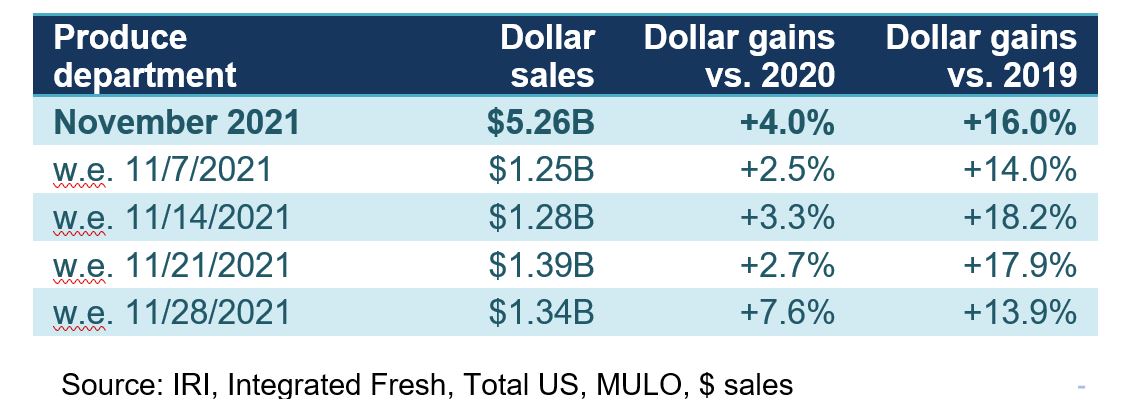
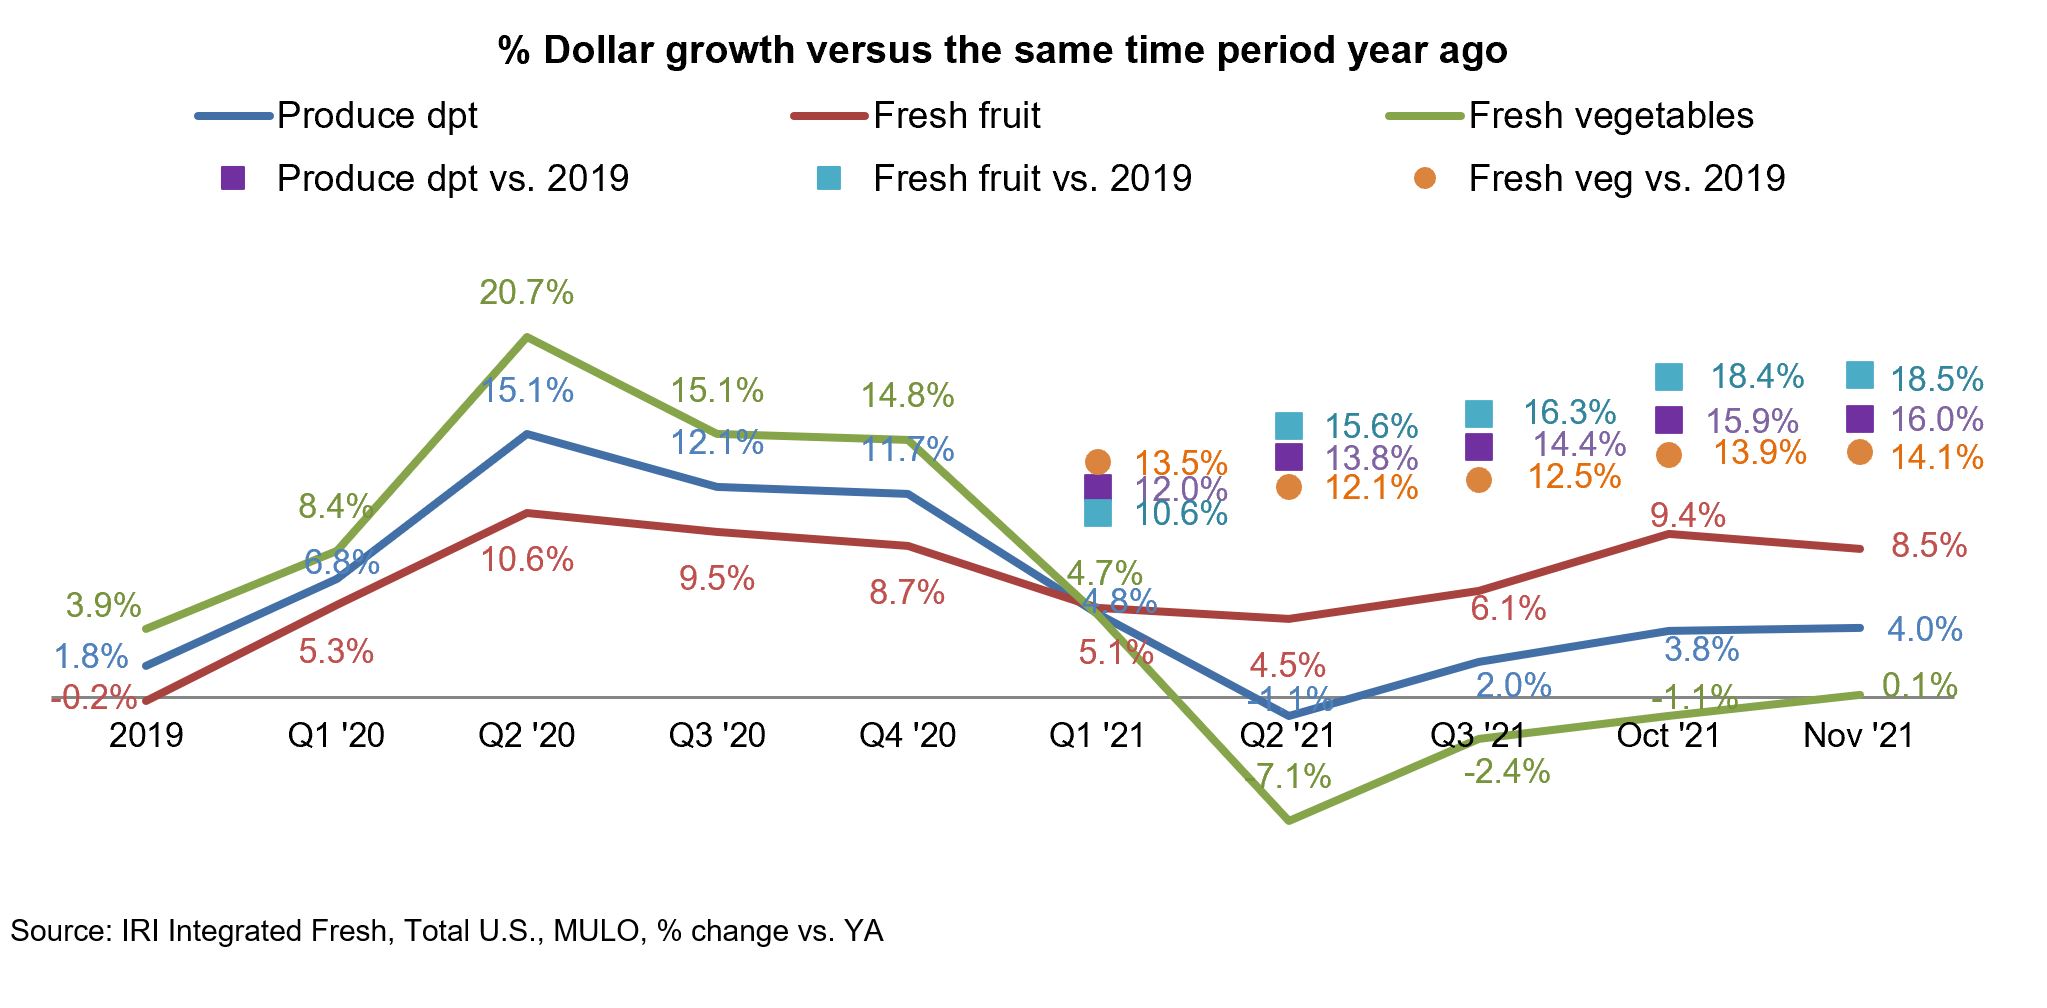
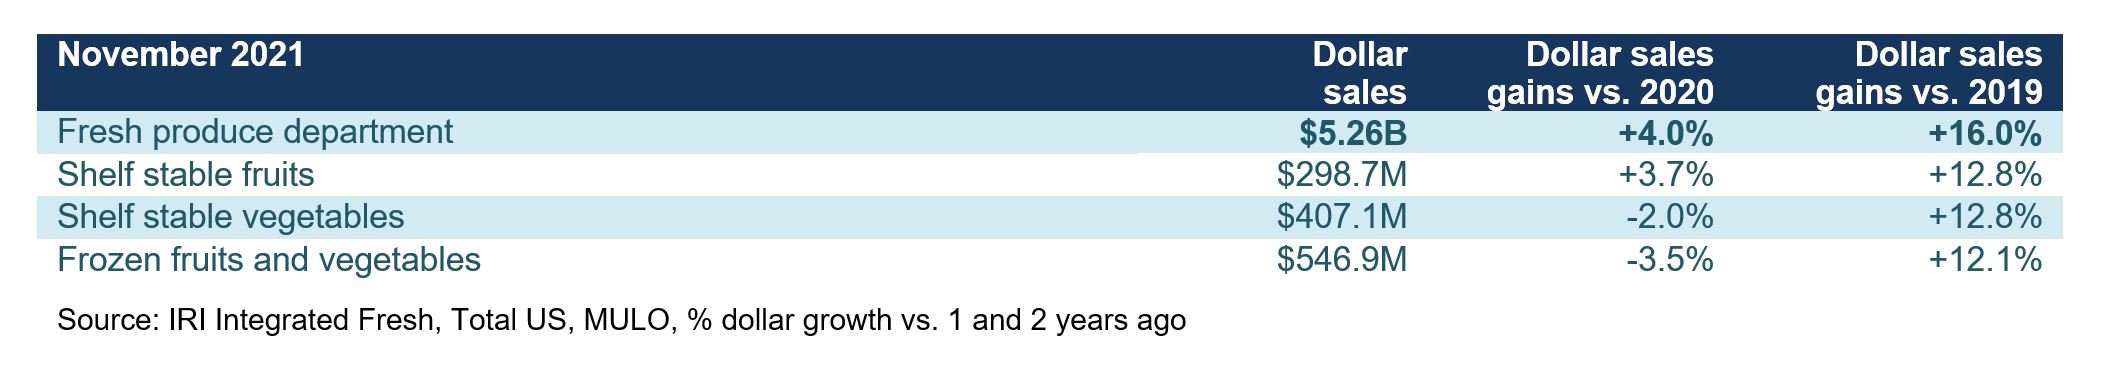
Fresh produce sales were very consistent with November levels between $1.2 and $1.4 billion each week. Despite the high consumer demand in 2020, sales exceeded last year’s levels by 4.0% and remained about 16% ahead of the 2019 pre-pandemic normal.
“Both the week before the holiday and Thanksgiving week itself were big for fresh produce,” said Watson. “As we have been seeing since the start of the pandemic, consumers started holiday purchases earlier — making the week prior to the holiday the bigger of the two. I noticed a lot of consumer media coverage about potential shortages, resulting in some consumers being surprised to find certain items in stock. We have an opportunity to clearly communicate about supply chain availability and provide substitution suggestions, where needed.”
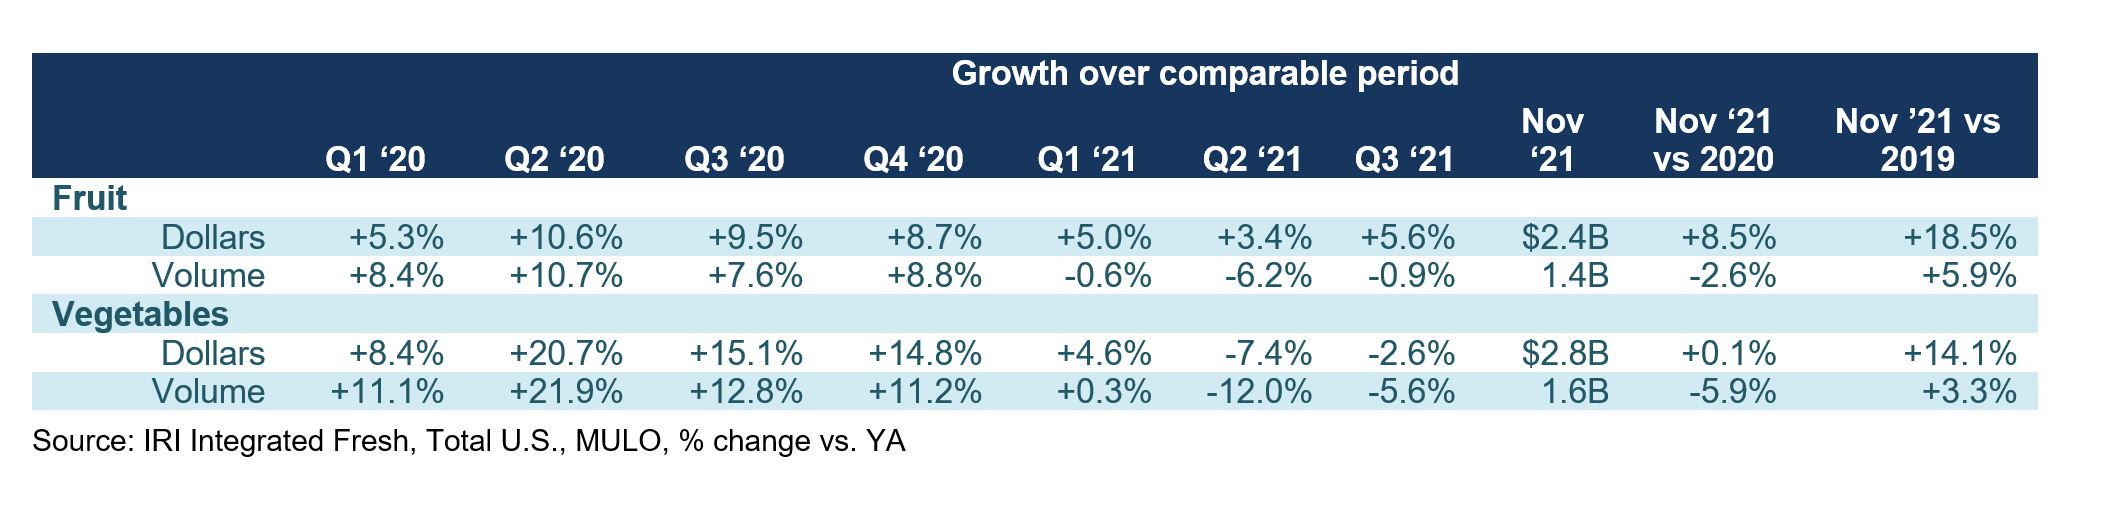
November was the first time since March that vegetable sales tracked ahead when compared to 2020. Fruit sales growth slowed a little to +8.5% versus November 2020, but gains remained more than 18% ahead of the pre-pandemic 2019 levels. Vegetable sales were 14.1% ahead of 2019 — for a total department gain of 16.0%.
Fresh Share
Fresh produce sales were strong in November and its share of dollars rebounded from the October 2021 low point of 79.5% to 80.8%. As such, it did remain below summer levels, despite having the highest inflation of the three areas, which would artificially boost its share of dollars.

In frozen, fruit represented 18.6% of frozen fruit/vegetable sales and dollars were flat year-on-year. Frozen vegetables declined 6.5%. In canned, fruit also outperformed vegetables. Fruit sales increased 3.7% in November 2021 versus year ago compared with -2.0% for shelf-stable vegetables. All areas are still benefiting from robust demand versus the 2019 pre-pandemic normal.
Fresh Produce Dollars versus Volume
September was the high water mark for volume sales when pounds came within 2.5 points of last year’s levels. In November, volume retreated further, at -4.4% versus year ago levels. Pound sales are still 4.4% ahead of the pre-pandemic normal. This is down from a high of 9.6% in September.
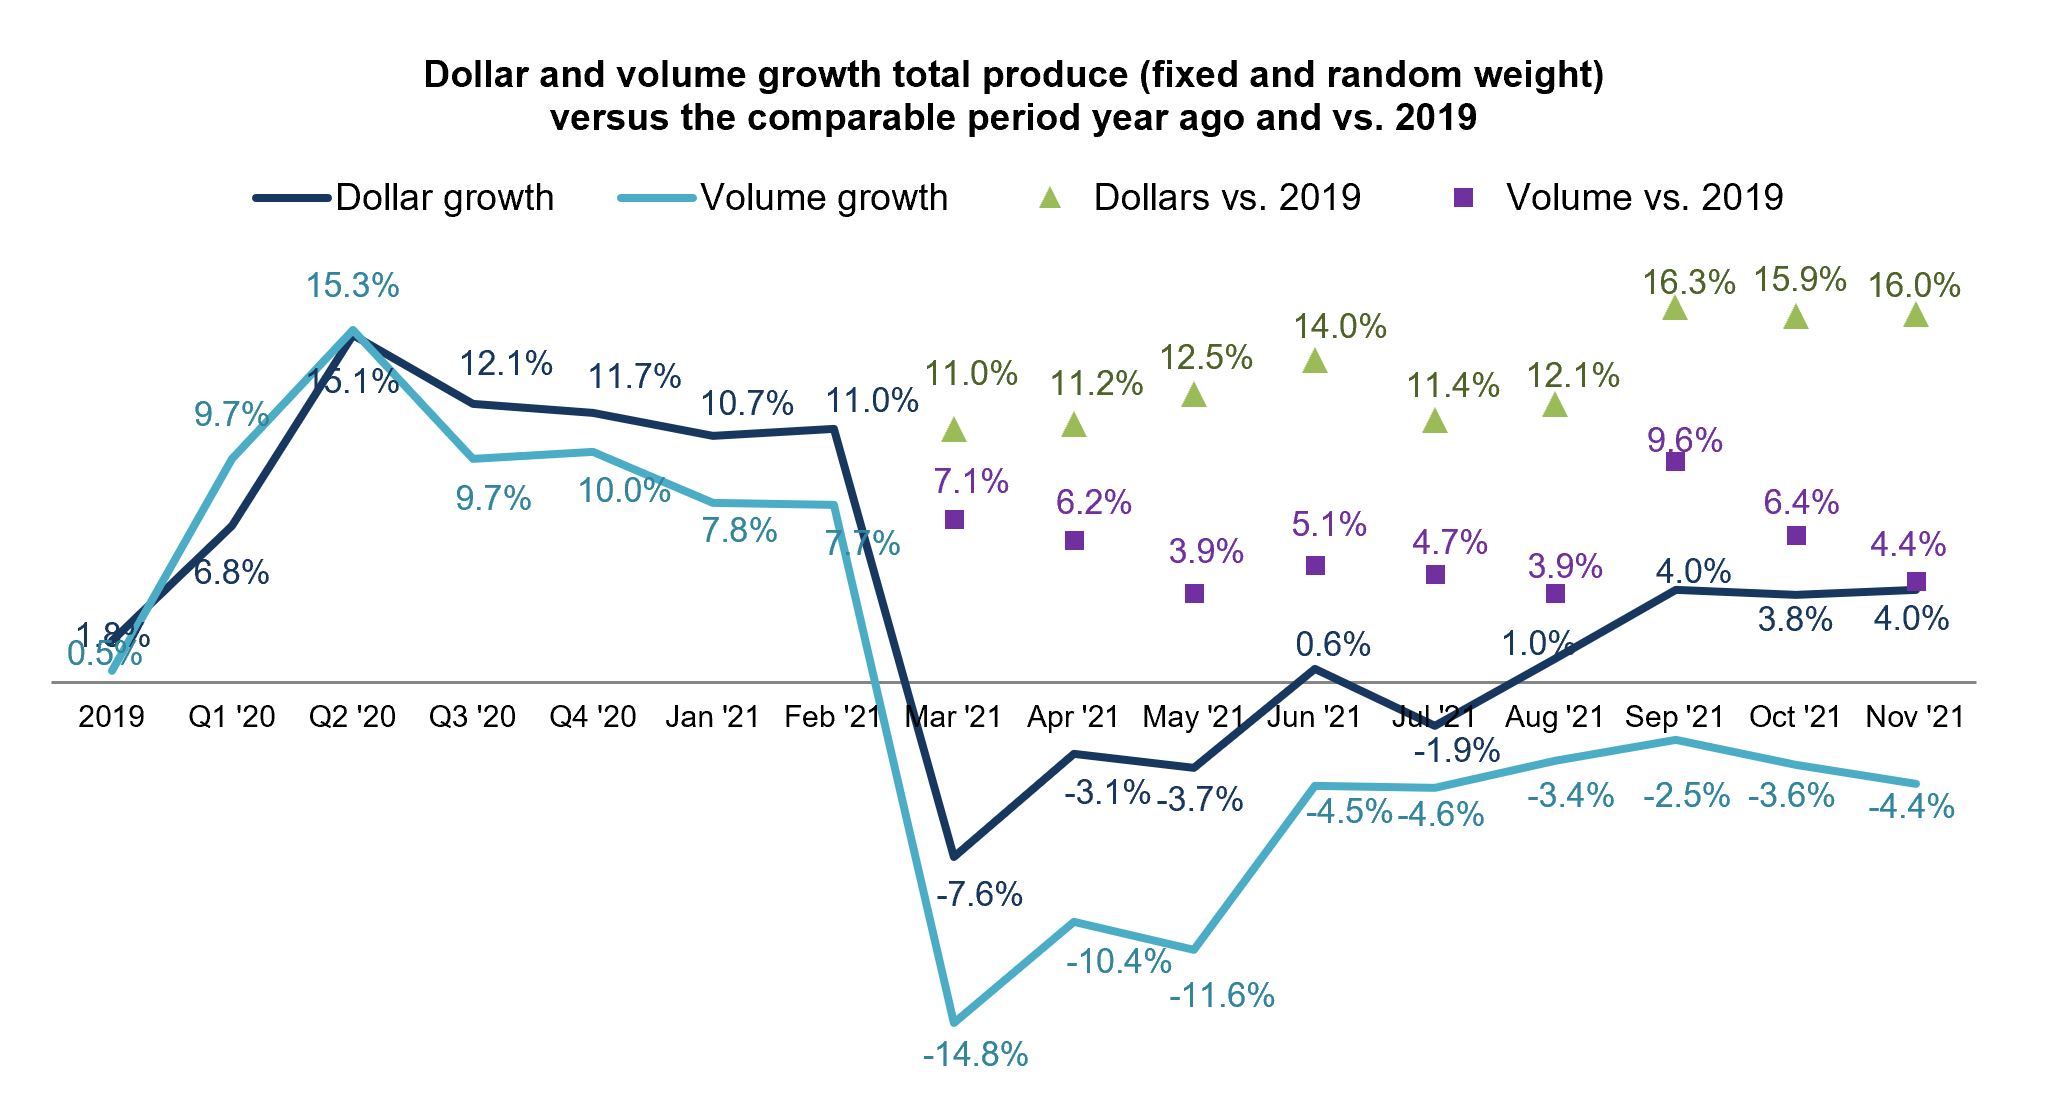
Comparing November fruit pound sales versus the pre-pandemic 2019 normal shows that the industry is still moving many more pounds through the system. Free and clear of the effect of inflation, it shows that U.S. retailers sold 5.9% more pounds of fruit versus 3.3% more pounds of vegetables in November 2021 than the same month in 2019. While volume is down year-over-year, it shows that the home-centric meal consumption is still driving robust demand for produce at retail.
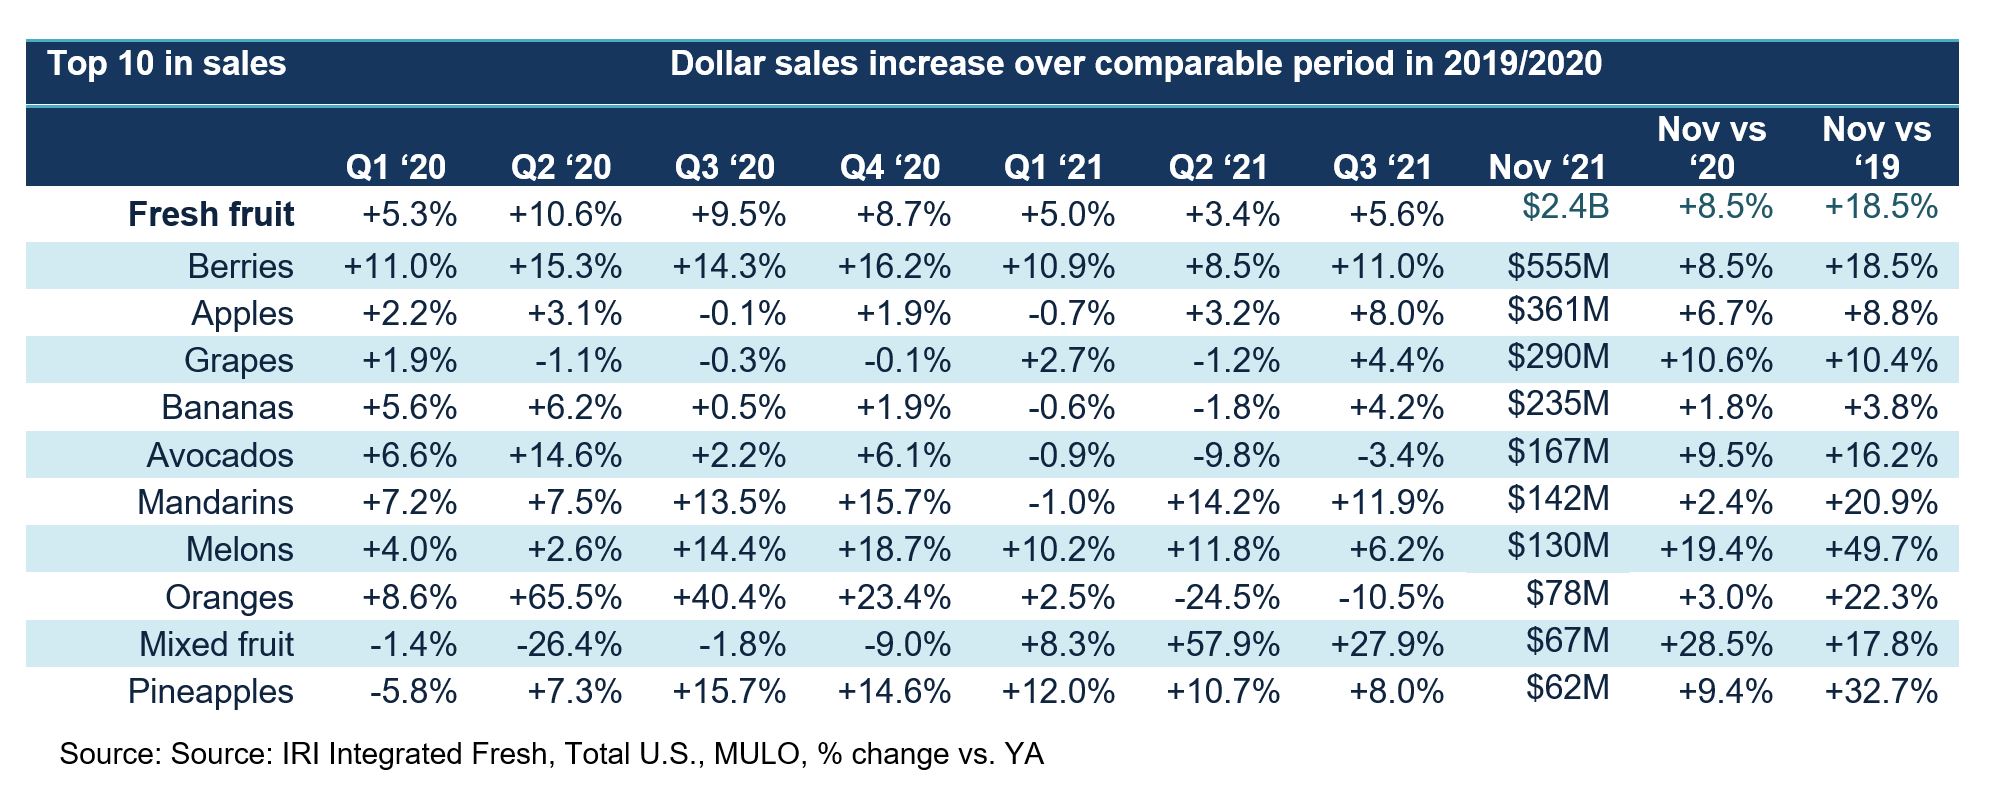
Fresh Fruit Sales in November
“On the fruit side, all top 10 items gained versus year ago,” said Parker. “Berries are by far the biggest fruit, yet still growing nearly 9% year-on-year. Three items reached double-digit gains: grapes, melons and mixed fruit. Grapes had mostly a flat year in 2020 but sales have been accelerating since the third quarter of 2021.”
Citrus fruits have a big representation between mandarins and oranges. Lemons fell just outside of the top 10 with $62 million and a gain of 3.3% versus 2020.
Fresh Vegetables Sales in November
“Looking at the top 10 in vegetable dollar sales just conjures up Thanksgiving dinner,” said Watson. “Between potatoes moving in first place, onions and carrots having a big month and celery moving into the top 10, it is clear that the holiday had a big impact on fresh vegetable sales this November. By and large, sales increased versus year ago, with the exceptions of tomatoes, peppers and mushrooms, which each had a strong 2020.”

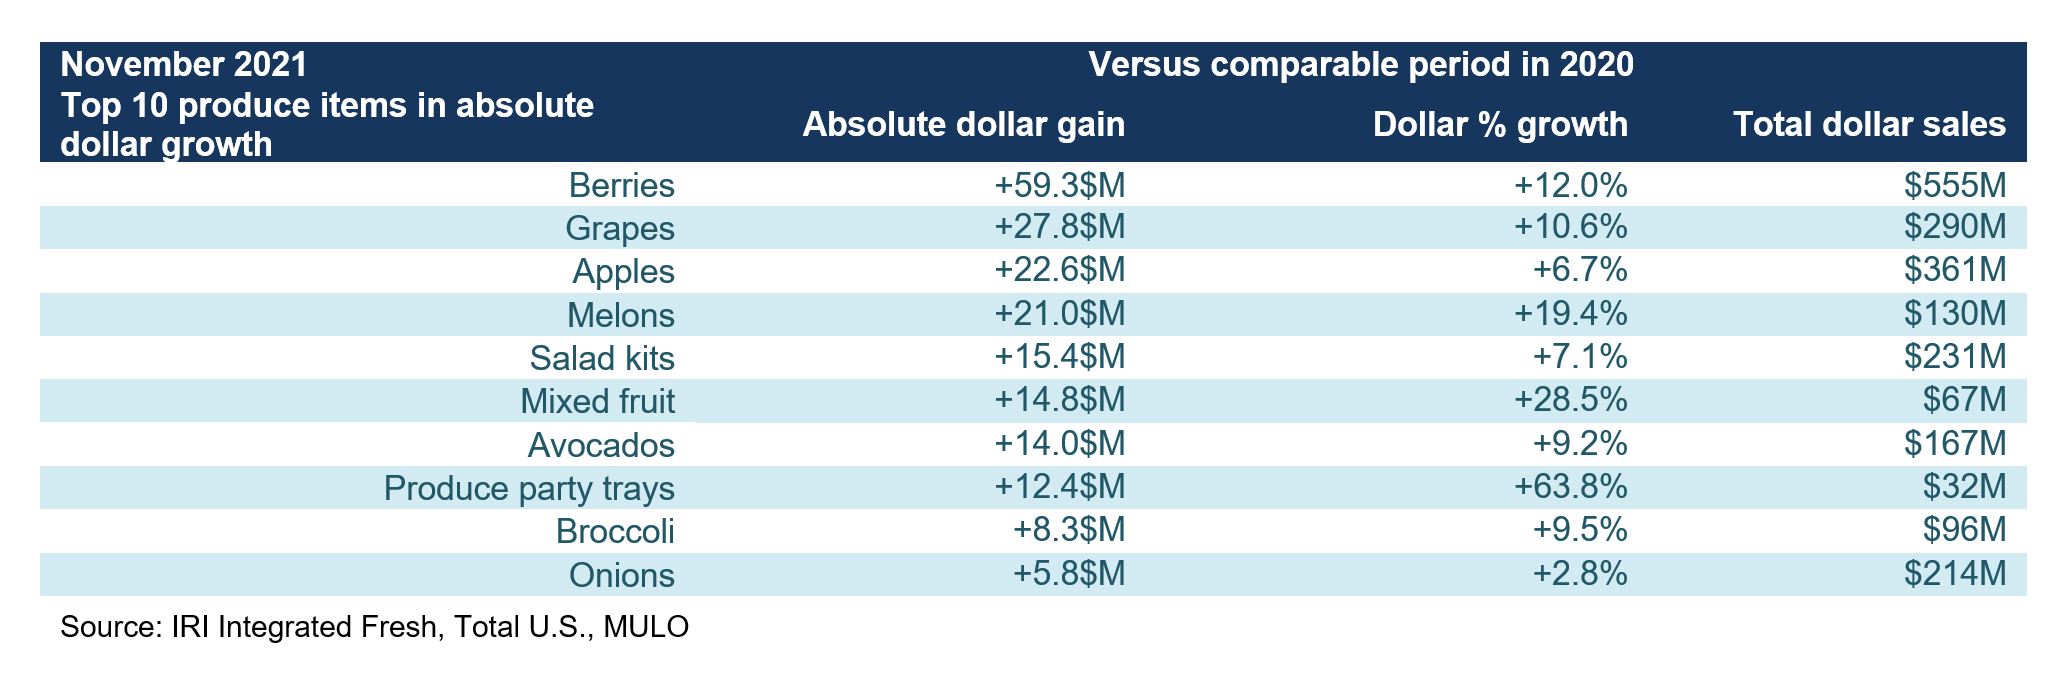
Absolute Dollar Gains
“The top 10 in absolute dollar gains showed both small and large categories are important for department growth,” said Parker. “It is always interesting to keep an eye on some of the smaller sellers that manage to gain in a big way. This month, that included mixed fruit and party trays — a clear sign that people were entertaining this month.”
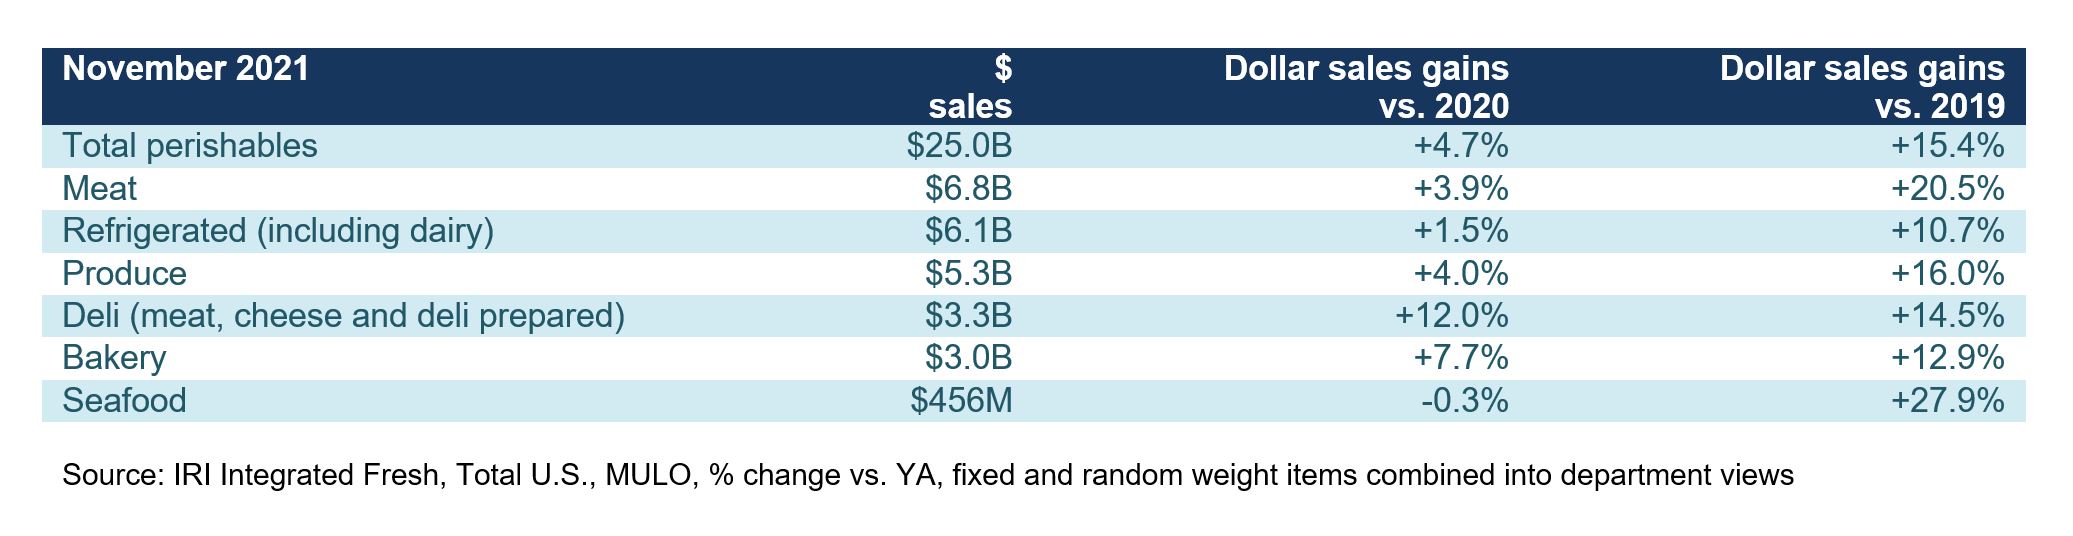
Perishables Performance
A look across fresh foods departments for the four November weeks shows perimeter strength. All departments, with the exception of seafood, gained year-over-year, with the highest increases going to deli. Seafood is significantly smaller than the other fresh departments and deli sales overtook bakery sales this month, with November sales of $3.3 billion.
Floral
Floral dollar sales grew by 24.5% over the first 11 months of 2021 compared with the same period in 2020, reaching nearly $6.7 billion for the year. In November, sales exceeded $417 million, which was an improvement of 15.9% versus year ago. It was indoor floral generating the bulk of sales, at $388 million, which was up 17.3% versus year ago. Outdoor floral was down about 1% on sales of $28 million. The top three biggest sellers this month were potted plants, bouquets and roses. Growth for roses is still upwards of 24% versus year ago and sales are up an astounding 57% versus 2019. Unit sales for roses, on the other hand, are up 11.7%.
What’s Next?
The IRI primary shopper survey found many examples of consumers encountering inflation and out-of-stocks.
• 37% encountered issues with availability on their list trip. Highest out-of-stocks were reported for toilet paper, canned goods, carbonated soft drinks, paper towels and milk.
• In response to not being able to buy what they came for, 39% of shoppers spent their money elsewhere and 29% ended up not purchasing the planned item at all — underscoring the significant impact of out-of-stocks on sales.
– 29% went to a different store and another 10% went online and bought it from another store
– 29% forewent the purchase
– 28% bought a different brand or variety
– 22% returned to the store later

While the upswing in new COVID-19 cases in the latter half of 2021 has reversed some of the normalization seen in the first half of the year, concern levels are not quite what they have been. This explains the small reversals in areas such as online sales, browsing for new items and time spent in store, but not anywhere near the levels seen at the onset of the pandemic.
• 33% is extremely concerned — a ratio that was double as high during the early months.
• Despite the arrival of the Omicron variant, 78% are not any more or less worried; 12% are more worried and 10% are less worried
• 50% expect to start Christmas grocery shopping a bit earlier than usual. Celebrations are likely to be very home-centric yet again, with only 3% expecting to go out to a restaurant.
Consumer mobility remains high, especially in the area of virtual versus in-person education:
• 81% of the nation’s children attend school in person full time, another 4% are in a hybrid system.
• 15% of parents now pack food to bring to school more often that they did pre-pandemic. In contrast, 19% now do school lunch more often. 62% go about school lunch the same way they did pre-pandemic.
• 9% of parents pack more drinks to bring to school as water fountains remain off limits in some schools.
Restaurant engagement, at 82%, remained high in November, driven by takeout and delivery:
• 58% of primary shoppers have gotten takeout, a few points higher than in the summer, and 22% have ordered home delivery.
• 50% have dined inside at a restaurant and 15% have eaten outdoors at a restaurant.
The next report, covering December, will be released in mid-January. We encourage you to contact Joe Watson, PMA’s Vice President of Membership and Engagement, at jwatson@pma.com with any questions or concerns. Please recognize the continued dedication of the entire grocery and produce supply chains, from farm to retailer. #produce #joyoffresh #SupermarketSuperHeroes.
Date ranges:
2019: 52 weeks ending 12/28/2019
Q1 2020: 13 weeks ending 3/29/2020
Q2 2020: 13 weeks ending 6/28/2020
Q3 2020: 13 weeks ending 9/27/2020
Q4 2020: 13 weeks ending 12/27/2020
Q1 2021: 13 weeks ending 3/28/2021
Q2 2021: 13 weeks ending 6/27/2021
Q3 2021: 13 weeks ending 9/26/2021
November 2021: 4 weeks ending 11/28/2021
