September brought cooler temperatures around the country and kids returned to school.
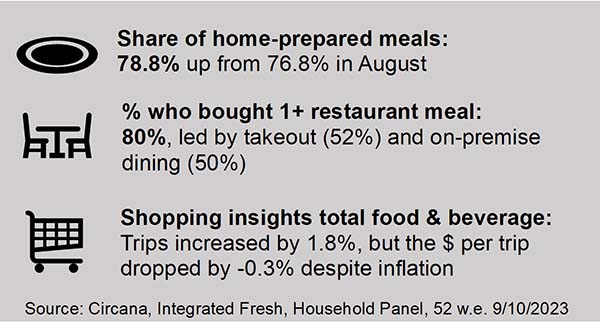
“With it, the share of meals prepared at home increased to 78.8%,” said Jonna Parker, Team Lead Fresh for Circana, citing the September edition of the Circana primary shopper survey. “This upholds the patterns observed in 2021 and 2022, in which at-home meal preparation dips in the summer and increases month-over-month throughout the fall and holiday season,” Parker added.
At-home meal preparation patterns themselves continue to be affected by the sustained pressure on income. The Circana survey found that 24% of consumers to do more scratch-cooking and 42% do more with leftovers. Consumers also make changes to what they prepare, capitalizing on sales promotions and using more simple ingredients to help balance budgets as 89% of consumers continue to perceive groceries as being more expensive than last year.
Popular savings measures include looking for sales specials more often (58%), now led by in-store signage and app searches rather than relying on paper ads. Cutting back on non-essentials (49%) and purchasing private-brands (39%) also remain popular measures. Consumers are also sticking to routine purchases a bit more with only 16% browsing the aisle for new and different products.
Home-centric life provides many occasion-based opportunities for departments around the store. For example, 45% of Americans expect to tune into one or more NFL games from their homes this season. When doing so, 45% serve up salty snacks like chips; 35% have pizza; 28% enjoy wings; and 21% have some sweet snacks like cookies or candy. “These are big opportunities for snacking fruit and vegetables,” said Joe Watson, IFPA’s VP of Retail, Foodservice and Wholesale. “Merchandising addressing big college, national or international sporting events add to the lineup of important holidays and everyday celebrations and are key times when consumers are willing to splurge a little more.”
As consumers still shift their dollars across items, brands, sizes, stores and restaurants, Circana, 210 Analytics and the International Fresh Produce Association (IFPA) team up to document the impact on sales patterns in fresh produce.
Inflation Insights
The price per unit across all foods and beverages in the Circana-measured multi-outlet stores, including supermarkets, club, mass, supercenter, drug and military, increased by 3.1% in September 2023 (the four weeks ending 10/1/2023) versus September 2022. While more in line with pre-pandemic inflation levels, the ongoing high levels of consumer concern relate to the cumulative effect of many months of high inflation. When comparing September 2023 to September 2020, prices have increased by 25.8%.
Average price/unit vs. YA
2018
2019
2020
2021
2022
Q4 22
Q1 23
Q2 23
Q3 23
Sep 23
Total food & beverages
+1.5%
+2.0%
+5.1%
+5.4%
+12.5%
+13.5%
+11.4%
+7.2%
+4.1%
+3.1%
Source: Circana, Integrated Fresh, Total US, MULO, average price per unit and % gain versus YA
Fresh produce prices continued to increase in September versus their year-ago levels, but much less so than total food and beverages. On a per-pound basis, fruit prices increased by 1.3% year-on-year whereas vegetable prices were nearly flat, with just a small increase of 0.5% in September.
Price per volume (lbs)
Price/volume
Change vs. YA
Change vs. 3YA
Total fresh produce September 2023
$1.85
+0.8%
+17.7%
Total fresh produce latest 52 weeks thru 10/1/23
$1.86
+2.9%
+18.0%
Fresh fruit September 2023
$1.73
+1.3%
+20.3%
Fresh fruit latest 52 weeks thru 10/1/23
$1.71
+1.2%
+20.3%
Fresh vegetables September 2023
$1.94
+0.5%
+15.8%
Fresh vegetables latest 52 weeks thru 10/1/23
$1.99
+4.8%
+16.1%
Source: Circana, Integrated Fresh, Total US, MULO, average price per volume and % gain versus YA and 3YA
September 2023 Sales
The four September 2023 weeks generated $58.2 billion total food and beverage sales, up 0.2% over September 2022, though unit sales trailed behind. Perishables, including produce, seafood, meat, bakery and deli, had a below-average dollar growth performance (-0.6%) but this was entirely prompted by the different levels of inflation as illustrated by the better-than-average unit performance (-1.3% versus -3.9% for center-store grocery).
September 2023 % change
Latest 52 weeks % change
Dollar size
Dollars vs. YA
Dollars vs. 2YA
Units vs. YA
Units vs. 2YA
Dollars vs. YA
Dollars vs. 2YA
Units vs. YA
Units vs. 2YA
Total food & beverages
$58.2B
+0.2%
+10.8%
-2.8%
-6.0%
+6.1%
+14.4%
-2.6%
-5.6%
Center-store grocery
$29.1B
+1.2%
+14.7%
-3.9%
-7.3%
+8.4%
+18.3%
-3.5%
-6.4%
Total perishables
$25.7B
-0.6%
+8.3%
-1.3%
-4.3%
+4.5%
+12.4%
-1.5%
-4.5%
Source: Circana, Integrated Fresh, Total US, MULO
September 2023 fresh produce sales reached $5.7 billion. “What a performance by the fresh produce department with gains in dollars, units and pounds,” Watson noted. “The third consecutive month of positive pound ground marks the official comeback for the department going into the fall months.”
September 2023 % change
Latest 52 weeks % change
Dollar size
Dollars vs. YA
Dollars vs. 2YA
Units vs. YA
Units vs. 2YA
Dollars vs. YA
Dollars vs. 2YA
Units vs. YA
Units vs. 2YA
Total fresh produce
$5.7B
+1.3%
+5.4%
+0.2%
-3.8%
+2.3%
+7.5%
-0.1%
-4.1%
Fresh fruit
$2.8B
+2.9%
+6.2%
+0.6%
-2.7%
+0.9%
+8.6%
+1.1%
-1.2%
Fresh vegetables
$2.8B
-0.5%
+4.8%
-0.1%
-4.7%
+3.7%
+6.3%
-1.1%
-6.2%
Source: Circana, Integrated Fresh, Total US, MULO, % change vs. year ago.
Produce department
Dollar sales
$vs. YA
lbsvs. YA
September 2023
$5.7B
+1.3%
+0.4%
w.e. 9/10/2023
$1.5B
+1.7%
+2.0%
w.e. 9/17/2023
$1.4B
+2.0%
+1.7%
w.e. 9/24/2023
$1.4B
-0.4%
-1.2%
w.e. 10/1/2023
$1.4B
+1.7%
-0.8%
Source: Circana, Integrated Fresh, Total US, MULO
The first week of September had a bit of a holiday boost, at $1.5 billion versus $1.4 billion the remaining three weeks.
Total Store Comparison
“The fresh produce share in September was not as high as other years,” commented Parker. “However, this has everything to do with the big difference in inflationary levels that boost dollar gains for frozen and shelf-stable, while fresh has the far better unit performance.
September 2023
Dollar sales
Share of dollars
Dollar sales gains vs. YA
Unit gains vs. YA
Average price per pound
Increase price vs. YA
Fresh produce department
$5.7B
79.2%
+1.3%
+0.2%
$1.85
+0.8%
Frozen fruits and vegetables
$645M
89.6%
+10.7%
-2.4%
$2.41
+14.2%
Shelf stable fruits
$340M
4.7%
+5.9%
-8.3%
$2.72
+13.6%
Shelf stable vegetables
$512M
7.1%
+7.9%
-5.4%
$1.41
+13.8%
Source: Circana Integrated Fresh, Total US, MULO
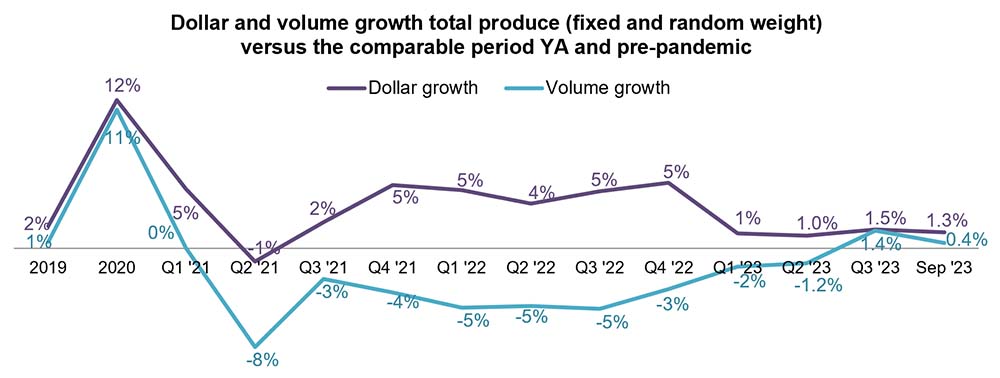
Fresh Produce Dollars versus Volume
Three months of positive pound gains averaged into a 1.4% increase in pounds for fresh produce during the third quarter of the year when compared to 2022.
Source: Circana Integrated Fresh, Total U.S., MULO
The investment in price on the fruit side paid off in large volume gains of 1.6% over September 2022.
Growth over comparable period
2019
2020
2021
Q1 22
Q2 22
Q3 22
Q4 22
Q1 23
Q2 23
Q3 23
Sep 23
Vs. YA
Vs. 2YA
Fruit
Dollars
+0%
+9%
+7%
+10%
+4%
+5%
+1%
-1.2%
+0.0%
+1.6%
$2.8B
+2.9%
+6.2%
Volume
-1%
+9%
-2%
-4%
-5%
-5%
-2%
-0.7%
-1.7%
+2.3%
1.6B
+1.6%
-3.4%
Vegetables
Dollars
+4%
+15%
-1%
+0%
+3%
+5%
+7%
+3.5%
+2.1%
+1.2%
$2.8B
-0.5%
+4.8%
Volume
+2%
+14%
-5%
-6%
-5%
-5%
-1%
-2.5%
-0.4%
-0.0%
1.4B
-1.0%
-5.6%
Source: Circana Integrated Fresh, Total U.S., MULO
Fresh Fruit Sales
“Berries, grapes and apples were the dollar leaders in September,” said Watson. “The four September weeks generated $615 million in berry sales alone with substantial dollar and pound gains. Seasonal powerhouse cherries made way for peaches and pineapples.”
Other fruits with increased volume sales were melons, avocados, mandarins, mixed fruit and pineapples.
Top 10 in sales
September 2023
Type
$ sales
$ vs. YA
Lbs vs. YA
Fresh fruit
$2.8B
+2.9%
+1.6%
Berries
$615M
+6.1%
+1.4%
Grapes
$370M
+4.5%
-4.3%
Apples
$333M
-2.5%
-3.6%
Melons
$292M
+11.8%
+16.3%
Bananas
$251M
-1.3%
-3.3%
Avocados
$176M
-1.6%
+4.0%
Mandarins
$129M
+5.9%
+7.2%
Peaches
$89M
+6.3%
-5.6%
Mixed Fruit
$77M
+5.4%
+4.2%
Pineapples
$76M
+10.9%
+9.1%
Source: Circana Integrated Fresh, Total U.S., MULO
Fresh Vegetables Sales
“The dollar and pound performance among the top 10 vegetable sellers was all over the board,” Parker said. “Tomatoes remain a remarkable story with strong volume sales pushing dollars 3.1% over year-ago levels.”
Other vegetables with year-over-year pound increases were onions, peppers, carrots and cucumbers.
Top 10 in sales
September 2023
Type
$ sales
$ vs. YA
Lbs vs. YA
Fresh vegetables
$2.8B
-0.5%
-1.0%
Potatoes
$306M
-1.0%
-0.8%
Tomatoes
$282M
+3.1%
+2.1%
Lettuce
$238M
-0.9%
-0.7%
Salad kits
$222M
-4.9%
-4.1%
Onions
$219M
-2.3%
+4.0%
Peppers
$189M
+2.2%
+2.7%
Cucumbers
$111M
+6.0%
+1.4%
Carrots
$105M
+3.8%
+0.6%
Broccoli
$93M
+2.6%
-2.9%
Mushrooms
$89M
-4.5%
-3.6%
Source: Circana Integrated Fresh, Total U.S., MULO
Fresh Produce Absolute Dollar Gains
The improvement in pound sales is seen in the top 10 commodities that added the most new dollars as well. Whereas earlier in the year inflation was a primary driver of the top 10 in absolute dollar gains, eight items experienced pound growth in September 2023 when compared to September 2022. Berries added the most new dollars, at +$612 million, followed by melons and grapes. Plums and peaches are the new additions this month.
Top 10 absolute
September 2023
dollar growth
$ gain
$ sales
Lbs vs. YA
Berries
+$35.2M
$615M
+1.4%
Melons
+$30.8M
$292M
+16.3%
Grapes
+$15.9M
$370M
-4.3%
Tomatoes
+$8.5M
$282M
+2.1%
Pineapples
+$7.5M
$76M
+9.1%
Mandarins
+$7.2M
$129M
+7.2%
Limes
+$6.8M
$59M
+5.0%
Cucumbers
+$6.3M
$111M
+1.4%
Plums
+$6.0M
$37M
+6.0%
Peaches
+$5.3M
$89M
-5.6%
Source: Circana Integrated Fresh, Total U.S., MULO
Perishables Performance
The meat department had the highest sales in September, but fresh produce was the only one to achieve both dollar and unit gains. Unit pressure was highest for seafood, followed by meat.
Perimeter
September 2023
departments
$ sales
$ vs. YA
Units vs. YA
Meat dpt.
$6.5B
-1.4%
-3.2%
Produce dpt.
$5.7B
+1.3%
+0.2%
Dairy aisle
$5.2B
-3.3%
-0.3%
Deli dpt.
$3.5B
+0.3%
-1.4%
Bakery dpt.
$3.3B
+1.5%
-3.2%
Seafood dpt.
$438M
-6.6%
-4.1%
Source: Circana Integrated Fresh, Total U.S., MULO, fixed and random weight items combined into department views
What’s Next?
Looking toward the Thanksgiving and December holiday season, the majority of consumers expect to celebrate in similar fashion as they did last year. This includes similar expectations for the size and nature of home-cooked meals for family and friends. While unit pressure has had a profound impact on grocery sales for the past two years, holidays are an important reason to include more premium items and treats — underscoring the importance of suggestive selling in-store, online and utilizing social media.
We also encourage you to contact Joe Watson, IFPA’s VP, Retail, Foodservice and Wholesale, at jwatson@freshproduce.com with any questions or concerns. Please recognize the continued dedication of the entire grocery and produce supply chains, from farm to retailer. #produce #joyoffresh
Date ranges:
2019: 52 weeks ending 12/28/2019
2020: 52 weeks ending 12/27/2020
2021: 52 weeks ending 12/26/2021
2022: 52 weeks ending 1/1/2023
Q4 2022: 13 weeks ending 1/1/2023
Q1 2023: 13 weeks ending 4/2/2023
Q2 2023: 13 weeks ending 7/2/2023
Q3 2023: 13 weeks ending 10/1/2023
September 2023: 4 weeks ending 10/1/2023
September brought cooler temperatures around the country and kids returned to school.
“With it, the share of meals prepared at home increased to 78.8%,” said Jonna Parker, Team Lead Fresh for Circana, citing the September edition of the Circana primary shopper survey. “This upholds the patterns observed in 2021 and 2022, in which at-home meal preparation dips in the summer and increases month-over-month throughout the fall and holiday season,” Parker added.
At-home meal preparation patterns themselves continue to be affected by the sustained pressure on income. The Circana survey found that 24% of consumers to do more scratch-cooking and 42% do more with leftovers. Consumers also make changes to what they prepare, capitalizing on sales promotions and using more simple ingredients to help balance budgets as 89% of consumers continue to perceive groceries as being more expensive than last year.
Popular savings measures include looking for sales specials more often (58%), now led by in-store signage and app searches rather than relying on paper ads. Cutting back on non-essentials (49%) and purchasing private-brands (39%) also remain popular measures. Consumers are also sticking to routine purchases a bit more with only 16% browsing the aisle for new and different products.
Home-centric life provides many occasion-based opportunities for departments around the store. For example, 45% of Americans expect to tune into one or more NFL games from their homes this season. When doing so, 45% serve up salty snacks like chips; 35% have pizza; 28% enjoy wings; and 21% have some sweet snacks like cookies or candy. “These are big opportunities for snacking fruit and vegetables,” said Joe Watson, IFPA’s VP of Retail, Foodservice and Wholesale. “Merchandising addressing big college, national or international sporting events add to the lineup of important holidays and everyday celebrations and are key times when consumers are willing to splurge a little more.”
As consumers still shift their dollars across items, brands, sizes, stores and restaurants, Circana, 210 Analytics and the International Fresh Produce Association (IFPA) team up to document the impact on sales patterns in fresh produce.
Inflation Insights
The price per unit across all foods and beverages in the Circana-measured multi-outlet stores, including supermarkets, club, mass, supercenter, drug and military, increased by 3.1% in September 2023 (the four weeks ending 10/1/2023) versus September 2022. While more in line with pre-pandemic inflation levels, the ongoing high levels of consumer concern relate to the cumulative effect of many months of high inflation. When comparing September 2023 to September 2020, prices have increased by 25.8%.
Average price/unit vs. YA
2018
2019
2020
2021
2022
Q4 22
Q1 23
Q2 23
Q3 23
Sep 23
Total food & beverages
+1.5%
+2.0%
+5.1%
+5.4%
+12.5%
+13.5%
+11.4%
+7.2%
+4.1%
+3.1%
Source: Circana, Integrated Fresh, Total US, MULO, average price per unit and % gain versus YA
Fresh produce prices continued to increase in September versus their year-ago levels, but much less so than total food and beverages. On a per-pound basis, fruit prices increased by 1.3% year-on-year whereas vegetable prices were nearly flat, with just a small increase of 0.5% in September.
Price per volume (lbs)
Price/volume
Change vs. YA
Change vs. 3YA
Total fresh produce September 2023
$1.85
+0.8%
+17.7%
Total fresh produce latest 52 weeks thru 10/1/23
$1.86
+2.9%
+18.0%
Fresh fruit September 2023
$1.73
+1.3%
+20.3%
Fresh fruit latest 52 weeks thru 10/1/23
$1.71
+1.2%
+20.3%
Fresh vegetables September 2023
$1.94
+0.5%
+15.8%
Fresh vegetables latest 52 weeks thru 10/1/23
$1.99
+4.8%
+16.1%
Source: Circana, Integrated Fresh, Total US, MULO, average price per volume and % gain versus YA and 3YA
September 2023 Sales
The four September 2023 weeks generated $58.2 billion total food and beverage sales, up 0.2% over September 2022, though unit sales trailed behind. Perishables, including produce, seafood, meat, bakery and deli, had a below-average dollar growth performance (-0.6%) but this was entirely prompted by the different levels of inflation as illustrated by the better-than-average unit performance (-1.3% versus -3.9% for center-store grocery).
September 2023 % change
Latest 52 weeks % change
Dollar size
Dollars vs. YA
Dollars vs. 2YA
Units vs. YA
Units vs. 2YA
Dollars vs. YA
Dollars vs. 2YA
Units vs. YA
Units vs. 2YA
Total food & beverages
$58.2B
+0.2%
+10.8%
-2.8%
-6.0%
+6.1%
+14.4%
-2.6%
-5.6%
Center-store grocery
$29.1B
+1.2%
+14.7%
-3.9%
-7.3%
+8.4%
+18.3%
-3.5%
-6.4%
Total perishables
$25.7B
-0.6%
+8.3%
-1.3%
-4.3%
+4.5%
+12.4%
-1.5%
-4.5%
Source: Circana, Integrated Fresh, Total US, MULO
September 2023 fresh produce sales reached $5.7 billion. “What a performance by the fresh produce department with gains in dollars, units and pounds,” Watson noted. “The third consecutive month of positive pound ground marks the official comeback for the department going into the fall months.”
September 2023 % change
Latest 52 weeks % change
Dollar size
Dollars vs. YA
Dollars vs. 2YA
Units vs. YA
Units vs. 2YA
Dollars vs. YA
Dollars vs. 2YA
Units vs. YA
Units vs. 2YA
Total fresh produce
$5.7B
+1.3%
+5.4%
+0.2%
-3.8%
+2.3%
+7.5%
-0.1%
-4.1%
Fresh fruit
$2.8B
+2.9%
+6.2%
+0.6%
-2.7%
+0.9%
+8.6%
+1.1%
-1.2%
Fresh vegetables
$2.8B
-0.5%
+4.8%
-0.1%
-4.7%
+3.7%
+6.3%
-1.1%
-6.2%
Source: Circana, Integrated Fresh, Total US, MULO, % change vs. year ago.
Produce department
Dollar sales
$vs. YA
lbsvs. YA
September 2023
$5.7B
+1.3%
+0.4%
w.e. 9/10/2023
$1.5B
+1.7%
+2.0%
w.e. 9/17/2023
$1.4B
+2.0%
+1.7%
w.e. 9/24/2023
$1.4B
-0.4%
-1.2%
w.e. 10/1/2023
$1.4B
+1.7%
-0.8%
Source: Circana, Integrated Fresh, Total US, MULO
The first week of September had a bit of a holiday boost, at $1.5 billion versus $1.4 billion the remaining three weeks.
Total Store Comparison
“The fresh produce share in September was not as high as other years,” commented Parker. “However, this has everything to do with the big difference in inflationary levels that boost dollar gains for frozen and shelf-stable, while fresh has the far better unit performance.
September 2023
Dollar sales
Share of dollars
Dollar sales gains vs. YA
Unit gains vs. YA
Average price per pound
Increase price vs. YA
Fresh produce department
$5.7B
79.2%
+1.3%
+0.2%
$1.85
+0.8%
Frozen fruits and vegetables
$645M
89.6%
+10.7%
-2.4%
$2.41
+14.2%
Shelf stable fruits
$340M
4.7%
+5.9%
-8.3%
$2.72
+13.6%
Shelf stable vegetables
$512M
7.1%
+7.9%
-5.4%
$1.41
+13.8%
Source: Circana Integrated Fresh, Total US, MULO
Fresh Produce Dollars versus Volume
Three months of positive pound gains averaged into a 1.4% increase in pounds for fresh produce during the third quarter of the year when compared to 2022.
Source: Circana Integrated Fresh, Total U.S., MULO
The investment in price on the fruit side paid off in large volume gains of 1.6% over September 2022.
Growth over comparable period
2019
2020
2021
Q1 22
Q2 22
Q3 22
Q4 22
Q1 23
Q2 23
Q3 23
Sep 23
Vs. YA
Vs. 2YA
Fruit
Dollars
+0%
+9%
+7%
+10%
+4%
+5%
+1%
-1.2%
+0.0%
+1.6%
$2.8B
+2.9%
+6.2%
Volume
-1%
+9%
-2%
-4%
-5%
-5%
-2%
-0.7%
-1.7%
+2.3%
1.6B
+1.6%
-3.4%
Vegetables
Dollars
+4%
+15%
-1%
+0%
+3%
+5%
+7%
+3.5%
+2.1%
+1.2%
$2.8B
-0.5%
+4.8%
Volume
+2%
+14%
-5%
-6%
-5%
-5%
-1%
-2.5%
-0.4%
-0.0%
1.4B
-1.0%
-5.6%
Source: Circana Integrated Fresh, Total U.S., MULO
Fresh Fruit Sales
“Berries, grapes and apples were the dollar leaders in September,” said Watson. “The four September weeks generated $615 million in berry sales alone with substantial dollar and pound gains. Seasonal powerhouse cherries made way for peaches and pineapples.”
Other fruits with increased volume sales were melons, avocados, mandarins, mixed fruit and pineapples.
Top 10 in sales
September 2023
Type
$ sales
$ vs. YA
Lbs vs. YA
Fresh fruit
$2.8B
+2.9%
+1.6%
Berries
$615M
+6.1%
+1.4%
Grapes
$370M
+4.5%
-4.3%
Apples
$333M
-2.5%
-3.6%
Melons
$292M
+11.8%
+16.3%
Bananas
$251M
-1.3%
-3.3%
Avocados
$176M
-1.6%
+4.0%
Mandarins
$129M
+5.9%
+7.2%
Peaches
$89M
+6.3%
-5.6%
Mixed Fruit
$77M
+5.4%
+4.2%
Pineapples
$76M
+10.9%
+9.1%
Source: Circana Integrated Fresh, Total U.S., MULO
Fresh Vegetables Sales
“The dollar and pound performance among the top 10 vegetable sellers was all over the board,” Parker said. “Tomatoes remain a remarkable story with strong volume sales pushing dollars 3.1% over year-ago levels.”
Other vegetables with year-over-year pound increases were onions, peppers, carrots and cucumbers.
Top 10 in sales
September 2023
Type
$ sales
$ vs. YA
Lbs vs. YA
Fresh vegetables
$2.8B
-0.5%
-1.0%
Potatoes
$306M
-1.0%
-0.8%
Tomatoes
$282M
+3.1%
+2.1%
Lettuce
$238M
-0.9%
-0.7%
Salad kits
$222M
-4.9%
-4.1%
Onions
$219M
-2.3%
+4.0%
Peppers
$189M
+2.2%
+2.7%
Cucumbers
$111M
+6.0%
+1.4%
Carrots
$105M
+3.8%
+0.6%
Broccoli
$93M
+2.6%
-2.9%
Mushrooms
$89M
-4.5%
-3.6%
Source: Circana Integrated Fresh, Total U.S., MULO
Fresh Produce Absolute Dollar Gains
The improvement in pound sales is seen in the top 10 commodities that added the most new dollars as well. Whereas earlier in the year inflation was a primary driver of the top 10 in absolute dollar gains, eight items experienced pound growth in September 2023 when compared to September 2022. Berries added the most new dollars, at +$612 million, followed by melons and grapes. Plums and peaches are the new additions this month.
Top 10 absolute
September 2023
dollar growth
$ gain
$ sales
Lbs vs. YA
Berries
+$35.2M
$615M
+1.4%
Melons
+$30.8M
$292M
+16.3%
Grapes
+$15.9M
$370M
-4.3%
Tomatoes
+$8.5M
$282M
+2.1%
Pineapples
+$7.5M
$76M
+9.1%
Mandarins
+$7.2M
$129M
+7.2%
Limes
+$6.8M
$59M
+5.0%
Cucumbers
+$6.3M
$111M
+1.4%
Plums
+$6.0M
$37M
+6.0%
Peaches
+$5.3M
$89M
-5.6%
Source: Circana Integrated Fresh, Total U.S., MULO
Perishables Performance
The meat department had the highest sales in September, but fresh produce was the only one to achieve both dollar and unit gains. Unit pressure was highest for seafood, followed by meat.
Perimeter
September 2023
departments
$ sales
$ vs. YA
Units vs. YA
Meat dpt.
$6.5B
-1.4%
-3.2%
Produce dpt.
$5.7B
+1.3%
+0.2%
Dairy aisle
$5.2B
-3.3%
-0.3%
Deli dpt.
$3.5B
+0.3%
-1.4%
Bakery dpt.
$3.3B
+1.5%
-3.2%
Seafood dpt.
$438M
-6.6%
-4.1%
Source: Circana Integrated Fresh, Total U.S., MULO, fixed and random weight items combined into department views
What’s Next?
Looking toward the Thanksgiving and December holiday season, the majority of consumers expect to celebrate in similar fashion as they did last year. This includes similar expectations for the size and nature of home-cooked meals for family and friends. While unit pressure has had a profound impact on grocery sales for the past two years, holidays are an important reason to include more premium items and treats — underscoring the importance of suggestive selling in-store, online and utilizing social media.
We also encourage you to contact Joe Watson, IFPA’s VP, Retail, Foodservice and Wholesale, at jwatson@freshproduce.com with any questions or concerns. Please recognize the continued dedication of the entire grocery and produce supply chains, from farm to retailer. #produce #joyoffresh
Date ranges:
2019: 52 weeks ending 12/28/2019
2020: 52 weeks ending 12/27/2020
2021: 52 weeks ending 12/26/2021
2022: 52 weeks ending 1/1/2023
Q4 2022: 13 weeks ending 1/1/2023
Q1 2023: 13 weeks ending 4/2/2023
Q2 2023: 13 weeks ending 7/2/2023
Q3 2023: 13 weeks ending 10/1/2023
September 2023: 4 weeks ending 10/1/2023
Anne-Marie Roerink is the President of 210 Analytics