

The March Marketplace
For the first time in many months, inflation for total food and beverages stayed in the single digits.
“The March 2023 average price per unit across all foods and beverages and channels increased 9.8% over March 2022,” shared Jonna Parker, Team Lead with Circana (formerly IRI). “However, prices averaged 21.43% above the March 2021 and 27.4% above the March 2020 levels. Salaries are not keeping pace and the grocery marketplace continues to be in flux as consumers move around dollars between channels, products and brands.”
Circana, 210 Analytics and the International Fresh Produce Association BB #:378962 continue to team up to document the impact on sales patterns in fresh produce.
The Bureau of Labor Statistics reported that restaurant prices increased 8.4% in March. Major metropolitan areas such as Detroit, Dallas and Philadelphia, have experienced far greater food and beverage inflation, per the BLS.
The 2022 record, double-digit gains in store brands seemed to be a tough act to follow. However, the first quarter 2023 shows continued private brand growth with dollar sales up 10.3% across items and channels, twice the gain of national brands that grew 5.6%. The dollar share of private brands rose to 19.1% and the unit share to 20.8%.
The online grocery market in March posted $8.0 billion in total sales, down 7.6% compared to last year, according to Brick Meets Click. All three areas of delivery, pickup and ship-to-home declined year-on-year.
“Growth in the second quarter of 2023 will require firing on all cylinders,” Joe Watson, IFPA’s VP, Retail, Foodservice and Wholesale said. “The March report demonstrates that are pockets of growth when zeroing in on certain meal occasions, commodities, holiday periods, private brands, etc. Winning in the current environment will require a laser sharp focus on delivering operational excellence in everything we do from pricing and assortment decisions to in-store execution.”
Inflation Insights
The price per unit across all foods and beverages in the Circana-measured multi-outlet stores, including supermarkets, club, mass, supercenter, drug and military, increased 9.8% in March (the five weeks ending 4/2/2023), which was down from 11.2% in February and +13.2% in January 2023.
| Average price/unit vs. YA | 2018 | 2019 | 2020 | 2021 | 2022 | Q4 2022 | Q1 2023 | Mar 23 |
| Total food & beverages | +1.5% | +2.0% | +5.1% | +5.4% | +12.5% | +13.5% | +11.3% | +9.8% |
In contrast, March fresh produce prices were relatively flat on a per-pound basis. Fresh fruit prices decreased 2.4% in comparison to March 2022. Vegetable inflation averaged 3.0% in March, which is also down from the 52-week levels.
| Price per volume (lbs) | Price/volume | Change vs. YA | Change vs. 3YA |
| Total fresh produce March 2023 | $1.90 | +0.3% | +19.8% |
| Total fresh produce latest 52 weeks thru 2/26/23 | $1.84 | +6.9% | +17.6% |
| Fresh fruit March 2023 | $1.77 | -2.4% | +19.8% |
| Fresh fruit latest 52 weeks thru 2/26/23 | $1.69 | +5.8% | +19.4% |
| Fresh vegetables March 2023 | $2.01 | +3.0% | +20.4% |
| Fresh vegetables latest 52 weeks thru 2/26/23 | $1.97 | +7.9% | +16.1% |
March 2023 Sales
The five March 2023 weeks brought $73.2 billion in total food and beverage sales, up 7.0% over March 2022 though units trailed behind. Perishables, including produce, seafood, meat, bakery and deli, had a slightly below-average dollar performance (+4.7%) but had the better unit performance (-6.1%).
| March 2023 % change | Latest 52 weeks % change | ||||||||
| Dollar size | Dollars vs. YA | Dollars vs. 2YA | Units vs. YA | Units vs. 2YA | Dollars vs. YA | Dollars vs. 2YA | Units vs. YA | Units vs. 2YA | |
| Total food & beverages | $73.2B | +7.0% | +11.9% | -2.5% | -7.7% | +9.3% | +12.7% | -3.1% | -6.2% |
| Center-store grocery | $36.8B | +10.2% | +16.3% | -3.0% | -8.6% | +11.5% | +15.7% | -3.4% | -6.6% |
| Total perishables | $32.3B | +4.7% | +10.4% | -1.7% | -6.1% | +8.2% | +11.8% | -2.7% | -5.5% |
March 2023 fresh produce sales reached $7.1 billion, virtually unchanged from March 2022. “Positive unit gains in fruit demonstrate that consumers are starting to respond to the more favorable pricing,” Parker noted.
| March 2023 % change | Latest 52 weeks % change | ||||||||
| Dollar size | Dollars vs. YA | Dollars vs. 2YA | Units vs. YA | Units vs. 2YA | Dollars vs. YA | Dollars vs. 2YA | Units vs. YA | Units vs. 2YA | |
| Total fresh produce | $7.1B | -0.2% | +4.1% | -0.3% | -5.7% | +3.9% | +6.8% | -2.6% | -6.3% |
| Fresh fruit | $3.4B | -2.4% | +5.6% | +2.0% | -0.6% | +2.9% | +11.0% | -1.5% | -2.4% |
| Fresh vegetables | $3.6B | +2.1% | +2.7% | -1.8% | -9.3% | +5.0% | +2.6% | -3.4% | -9.3% |
| Produce departmentz | Dollar sales | $ vs. YA | lbs vs. YA |
| March 2023 | $7.1B | -0.2% | -0.5% |
| w.e. 3/5/2023 | $1.442B | +1.1% | -0.1% |
| w.e. 3/12/2023 | $1.440B | +0.0% | -2.0% |
| w.e. 3/19/2023 | $1.426B | +0.8% | +1.5% |
| w.e. 3/26/2023 | $1.397B | -1.0% | -0.6% |
| w.e. 4/2/2023 | $1.394B | -1.8% | -1.1% |
Weekly fresh produce sales averaged between $1.394 billion and $1.442 billion. “March madness is an excellent occasion to extend Super Bowl-type merchandising,” Watson pointed out. Pound sales were down four out of the five weeks with the exception of the middle week.
Total Store Comparison
“The difference in inflationary levels between fresh, frozen and canned is staggering,” Parker commented. “The average price per unit for fresh was flat versus +23.5% for frozen.”
| March 2023 | Dollar sales | Share of dollars | Dollar sales gains vs. YA | Unit gains vs. YA | Average price per unit | Increase price vs. YA |
| Fresh produce department | $7.1B | 78.6% | -0.2% | -0.3% | $2.58 | +0.1% |
| Frozen fruits and vegetables | $841M | 9.3% | +17.2% | -5.1% | $3.38 | +23.5% |
| Shelf stable fruits | $470M | 5.2% | +6.2% | -8.1% | $3.44 | +15.5% |
| Shelf stable vegetables | $616M | 6.8% | +6.9% | -5.8% | $1.52 | +13.4% |
Fresh Produce Dollars versus Volume
Fresh produce pound sales have trailed behind year ago levels since March 2021, but got to within 0.5% of year-ago levels in March 2023. However, pound gains seem to be coming at the expense of dollar pressure, where deflation is helping to boost pound sales but not to the extent of staying ahead of year-ago levels in dollars.
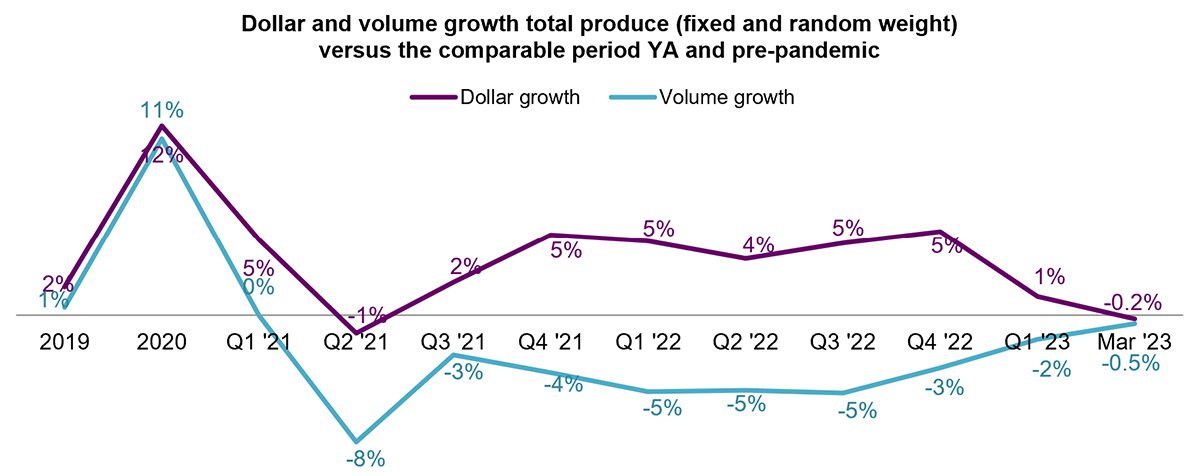
The more favorable retail prices for fruit resulted in steady volume sales when compared to March 2022. Volume demand for vegetables continued to trend below year ago levels, but moved within 1 percentage point.
| Growth over comparable period | ||||||||||||||
| 2019 | 2020 | 2021 | Q1 22 | Q2 22 | Q3 22 | Q4 22 | Q1 23 | Mar 23 | Vs. YA | Vs. 2YA | ||||
| Fruit | ||||||||||||||
| Dollars | +0% | +9% | +6.5% | +10% | +4% | +4.6% | +1.3% | -1.2% | $3.4B | -2.4% | +5.6% | |||
| Volume | -1% | +9% | -1.9% | -4% | -5% | -5.0% | -1.8% | -0.7% | 1.9B | +0.0% | -4.6% | |||
| Vegetables | ||||||||||||||
| Dollars | +4% | +15% | -1.2% | +0% | +3% | +4.8% | +6.8% | +3.5% | $3.6B | +2.1% | +2.7% | |||
| Volume | +2% | +14% | -5.3% | -6% | -5% | -4.7% | -1.4% | -2.5% | 1.8B | -0.9% | -7.9% | |||
Fresh Fruit Sales
“March sales on the fruit side were a mix of dollar gains and losses and a mix of unit gains and losses,” Parker said. “Avocados are a perfect example of the pricing conundrum in the current marketplace. The average price per pound for avocados was down 28.2% in March 2023 versus March 2022. This prompted a year-on-year increase of 14.5% in pounds, but it meant dollar sales fell by 17.8%.” Other items with increased volume sales were grapes, melons, mandarins and pineapples.
Items with increased dollar sales in March 2023 compared with last year were berries, bananas, melons, pineapples and mixed fruit.
| Top 10 in sales | March 2023 | ||||
| Type | $ sales | $ vs. YA | Lbs vs. YA | ||
| Fresh fruit | $3.4B | -2.4% | +0.0% | ||
| Berries | $906M | +1.3% | -5.4% | ||
| Apples | $433M | -3.8% | -5.2% | ||
| Grapes | $337M | -5.5% | +3.5% | ||
| Bananas | $333M | +2.0% | -0.3% | ||
| Avocados | $227M | -17.8% | +14.5% | ||
| Melons | $222M | +4.8% | +0.6% | ||
| Mandarins | $219M | -3.4% | +6.2% | ||
| Oranges | $137M | -12.4% | -9.6% | ||
| Pineapples | $99M | +6.5% | +9.9% | ||
| Mixed fruit | $96M | +1.8% | -0.9% | ||
Fresh Vegetables Sales
“The dollar and unit performance on the vegetable side is equally uneven,” Watson said. “A few items managed to grow both pounds and dollars, being tomatoes, onions and cucumbers.” Carrots kept pounds steady while growing dollar sales by nearly 5%.
The dual power of value versus convenience can be seen in strong sales for both lettuce and salad kits, the number three and four sellers. However, whereas lettuce grew dollar sales, salad kits sales decreased in both pounds and dollars.
| Top 10 in sales | March 2023 | |||
| Type | $ sales | $ vs. YA | Lbs vs. YA | |
| Fresh vegetables | $3.6B | +2.1% | -0.9% | |
| Tomatoes | $388M | +2.7% | +0.1% | |
| Potatoes | $385M | +13.2% | -2.1% | |
| Salad kits | $301M | -3.9% | -7.8% | |
| Lettuce | $288M | +0.6% | -4.7% | |
| Onions | $263M | +4.6% | +9.2% | |
| Peppers | $244M | +0.5% | -3.3% | |
| Cucumbers | $148M | +9.0% | +2.3% | |
| Carrots | $144M | +4.9% | -0.0% | |
| Broccoli | $122M | +0.8% | -4.4% | |
| Mushrooms | $117M | -7.1% | -11.9% | |
Fresh Produce Absolute Dollar Gains
In March 2023, fresh vegetables added $74.6 million in additional dollars versus March 2022 whereas total fruit lost $84.3 million in sales. While a few fruits made it into the top 10 items that gained the most in dollars, the top three placements go to vegetables. “Pineapples popped back into the top 10 in absolute growth on nearly 10% pound growth,” said Watson.
| Top 10 absolute | March 2023 | |||
| dollar growth | $ gain | $ sales | Lbs vs. YA | |
| Potatoes | +$44.9M | $385M | -2.1% | |
| Cucumbers | +$12.2M | $148M | +2.3% | |
| Onions | +$11.6M | $263M | +9.2% | |
| Berries | +$11.4M | $906M | -5.4% | |
| Melons | +$10.2M | $221M | +0.6% | |
| Tomatoes | +$10.1M | $388M | +0.1% | |
| Carrots | +$6.7M | $144M | +0.0% | |
| Bananas | +$6.6M | $333M | -0.3% | |
| Celery | +$6.1M | $89M | -4.7% | |
| Pineapples | +$6.1M | $99M | +9.9% | |
Perishables Performance
The heavy inflation in eggs, cheese, butter, etc. boosted sales for the dairy department by 13.4% to reach $7.0 billion in March 2023. The deli and bakery departments also achieved dollar gains. On the unit side, all departments were down, with seafood experiencing the highest losses, at -4.5%.
| Perimeter | March 2023 | ||||
| departments | $ sales | $ vs. YA | Units vs. YA | ||
| Meat dpt. | $7.9B | -0.6% | -3.2% | ||
| Produce dpt. | $7.1B | -0.2% | -0.3% | ||
| Dairy aisle | $7.0B | +13.4% | -1.2% | ||
| Deli dpt. | $4.3B | +5.9% | -2.7% | ||
| Bakery dpt. | $4.1B | +10.4% | -2.7% | ||
| Seafood dpt. | $621M | -2.0% | -4.5% | ||
What’s Next?
Circana’s monthly shopper survey looked ahead to the kick off of grilling season:
The meal preparation landscape continues to change as well.
The next report, covering April, will be released in mid-May. In addition to the data provided here, the IFPA also provides a look at the floral performance and consumer sentiment. We also encourage you to contact Joe Watson, IFPA’s VP, Retail, Foodservice and Wholesale, at jwatson@freshproduce.com with any questions or concerns.
Please recognize the continued dedication of the entire grocery and produce supply chains, from farm to retailer. #produce #joyoffresh #SupermarketSuperHeroes.
- 2019: 52 weeks ending 12/28/2019
- 2020: 52 weeks ending 12/27/2020
- 2021: 52 weeks ending 12/26/2021
- 2022: 52 weeks ending 1/1/2023
- Q4 2022: 13 weeks ending 1/1/2023
- Q1 2023: 13 weeks ending 4/2/2023
- March 2023: 5 weeks ending 4/2/2023
