

The January Marketplace
“January brought a host of New Year’s resolutions,” shared Jonna Parker, Team Lead, Fresh with IRI. “The January IRI survey found that 40% of primary shoppers plan to eat healthier, 24% aim to get more sleep and 23% want to spend more time with friends and family. However, saving more money was the second highest resolution, at 35% — demonstrating that inflation continues to make its mark.” To understand the impact on fresh produce, IRI, 210 Analytics and the International Fresh Produce Association will continue to team up in 2023 with monthly performance reports.
Nine in 10 consumers perceive the cost of groceries and everyday household items to be much (67%) or somewhat (22%) higher than last year, according to the IRI survey. Eggs continue to lead the list of examples cited by consumers for being more expensive, followed by milk, beef/pork, fresh produce, chicken/turkey and bread. “Fresh produce is consistently in the top five of examples shoppers cite as having significantly higher prices,” said Joe Watson, IFPA’s VP, Retail, Foodservice and Wholesale. “Perception is reality and that means it is extra important to underscore the value fresh produce delivers.”
Inflationary pressure on income is real, with 96% being concerned over the high cost of groceries.
“Special occasions remain a big opportunity for food retail in 2023,” noted Parker. “During the pandemic years, several foodservice-focused holidays, such as Valentine’s Day and Mother’s Day, turned home-centric. This moved significant spending into retail, adding to holidays that were already mostly celebrated at home, such as Labor Day and the Fourth of July.” Holidays typically boost spending far above a normal week with opportunities for departments around the store.
Following the typical December uptick in the estimated share of meals prepared at home (81.5%), January’s estimated share dropped slightly to 80.0% of meals. Restaurant engagement was fairly steady, with 78% of households having purchased restaurant food at least once, according to the January survey. In-store shopping remained prevalent, at 85% of trips. Two-thirds of shoppers exclusively buy in-store, whereas 11% buy most or all groceries online.
Inflation Insights
The price per unit across all foods and beverages in the IRI-measured multi-outlet stores, including supermarkets, club, mass, supercenter, drug and military, increased 13.2% in January (the four weeks ending 1/29/2023), which was up from 12.8% in December 2022. Compared with January 2020, prices across all foods and beverages were up 30.3%.
| Average price/unit vs. YA | 2018 | 2019 | 2020 | 2021 | 2022 | Q4 2022 | Jan 23 |
| Total food & beverages | +1.5% | +2.0% | +5.1% | +5.4% | +12.5% | +13.5% | +13.2% |
Fresh produce prices were also up over 2022, but a relatively low +5.6% on a per-pound basis, with very low price increases for fresh fruit. Vegetable inflation averaged 5.6% in January, which is also down from the full-year levels.
| Price per volume (lbs) | Price/volume | Change vs. YA | Change vs. 3YA |
| Total fresh produce January 2023 | $1.97 | +5.6% | +17.7% |
| Total fresh produce latest 52 weeks thru 1/29/23 | $1.83 | +8.4% | +16.8% |
| Fresh fruit January 2023 | $1.83 | +2.2% | +21.1% |
| Fresh fruit latest 52 weeks thru 1/29/23 | $1.70 | +8.5% | +19.4% |
| Fresh vegetables January 2023 | $2.09 | +8.9% | +14.6% |
| Fresh vegetables latest 52 weeks thru 1/29/23 | $1.96 | +8.3% | +14.4% |
January 2023 Sales
The four January 2023 weeks brought $57.9 billion in total food and beverage sales, substantially less than the $64.4 billion in the four December weeks — illustrating the holiday boost of retail sales. Dollars were up 6.6% versus year ago levels in January, but unit sales dropped nearly 6% behind and trailed January 2020. Perishables, including produce, seafood, meat, bakery and deli, had a slightly below-average dollar performance that was largely related to below-average inflation. Center store item sales increased 8.5%.
| January 2023 % change | Latest 52 weeks % change | ||||||||
| Dollar size | Dollars vs. YA | Dollars vs. 3YA | Units vs. YA | Units vs. 3YA | Dollars vs. YA | Dollars vs. 3YA | Units vs. YA | Units vs. 3YA | |
| Total food & beverages | $57.9B | +6.6% | +27.8% | -5.8% | -1.9% | +8.9% | +27.0% | -3.5% | +1.2% |
| Total perishables | $26.1B | +5.5% | +25.6% | -4.9% | -1.4% | +8.2% | +25.4% | -3.1% | +1.6% |
| Total grocery (center store) | $28.8B | +8.5% | +32.3% | -6.6% | -2.1% | +10.7% | +30.5% | -3.7% | +0.9% |
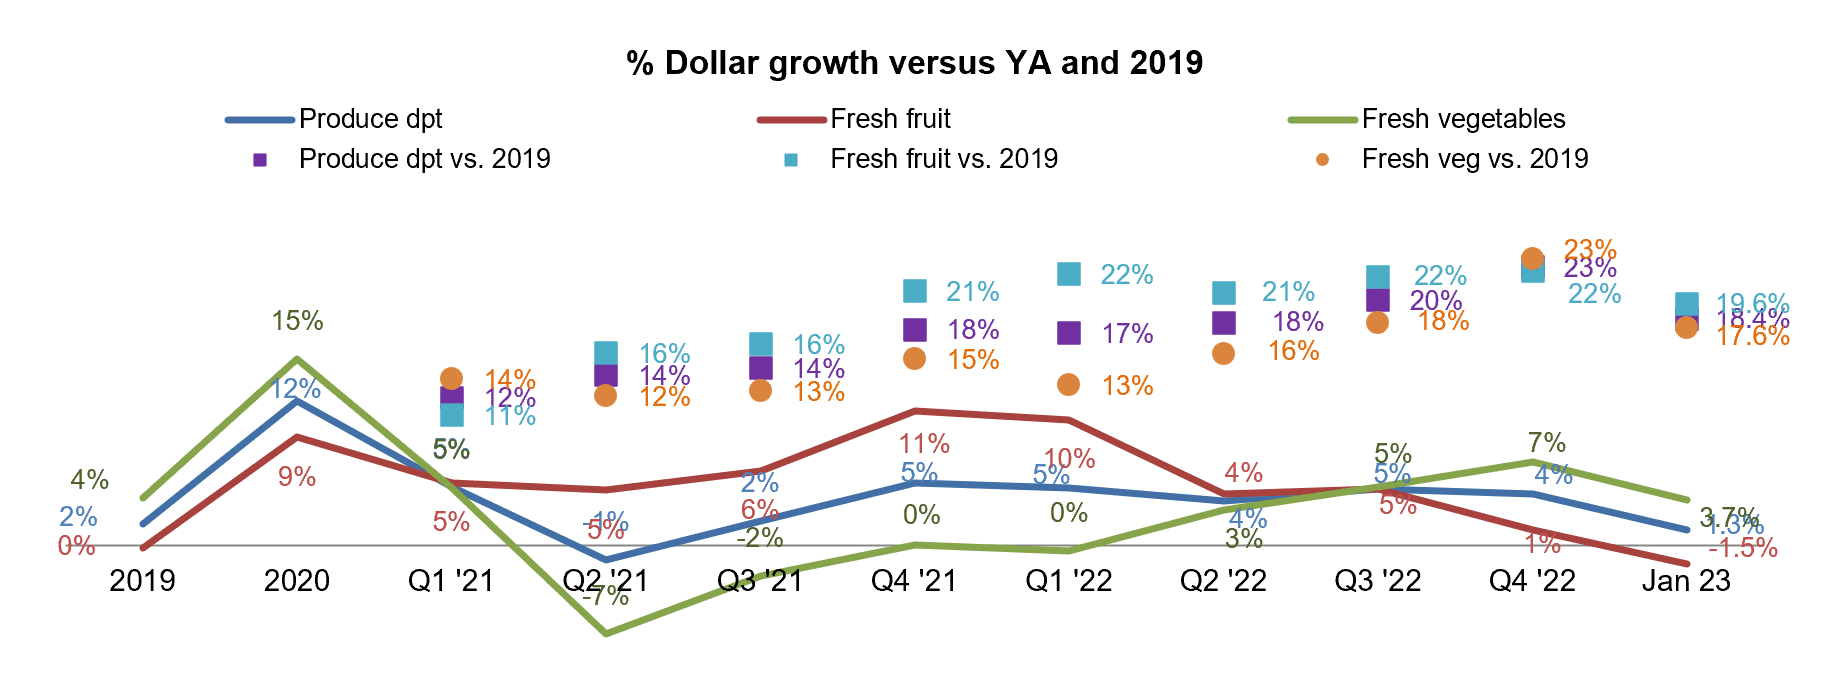
January 2023 fresh produce sales reached $5.7 billion, up from $5.5 billion in December and an increase of 1.3% over January 2022 levels. “Though January sales certainly did not disappoint, we did not see strengthening demand in response to favorable fruit prices,” Parker said. “In fact, units continue to sit below year-ago levels, though in the comparison to pre-pandemic, fresh produce looks quite favorable in unit sales, unlike other categories.”
| January 2023 % change | Latest 52 weeks % change | ||||||||
| Dollar size | Dollars vs. YA | Dollars vs. 3YA | Units vs. YA | Units vs. 3YA | Dollars vs. YA | Dollars vs. 3YA | Units vs. YA | Units vs. 3YA | |
| Total fresh produce | $5.7B | +1.3% | +18.4% | -3.2% | +1.3% | +4.5% | +20.3% | -3.4% | +5.0% |
| Fresh fruit | $2.6B | -1.5% | +19.6% | -1.4% | +2.3% | +4.7% | +22.4% | -2.2% | +7.0% |
| Fresh vegetables | $3.0B | +3.7% | +17.6% | -4.6% | +0.6% | +4.3% | +18.4% | -4.4% | +3.5% |
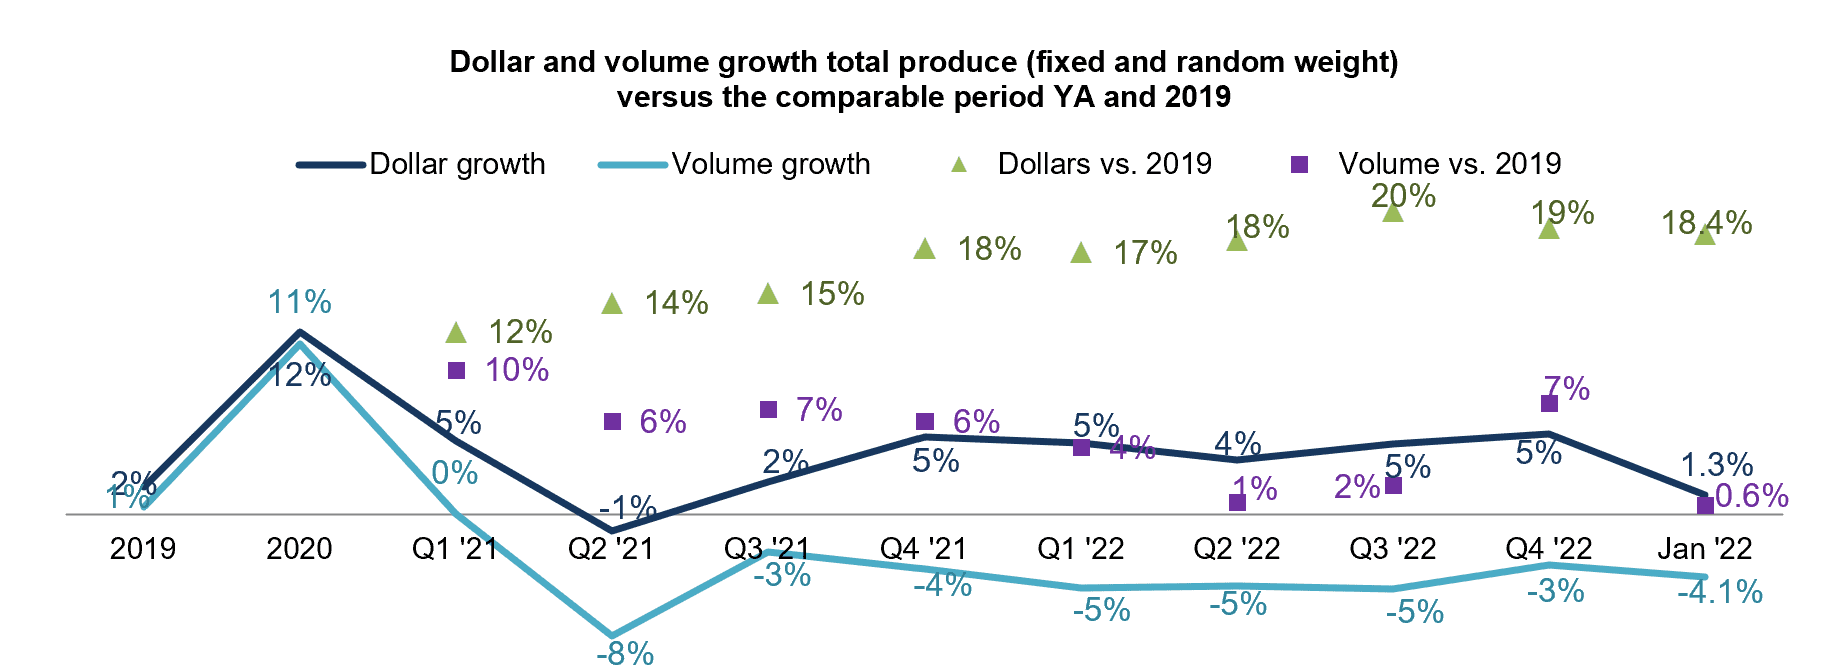
Weekly sales were fairly consistent in January, averaging around $1.4 billion each. Pound sales trailed January 2022 by 4.1%, while units were down 3.2%. The difference in the decrease in pounds versus units shows that consumers are switching to smaller pack sizes, at least in some cases.
| Produce department | Dollar sales | $ vs. YA | lbs vs. YA |
| January 2023 | $5.695B | +1.3% | -4.1% |
| w.e. 1/8/2023 | $1.420B | +2.2% | -3.2% |
| w.e. 1/15/2023 | $1.440B | +0.0% | -6.2% |
| w.e. 1/22/2023 | $1.431B | +3.6% | -1.9% |
| w.e. 1/29/2023 | $1.404B | -0.5% | -5.0% |
“Dollar growth for fruit had been slowing in the past few months due to moderating levels of inflation,” said Watson. “In January, dollars dipped below year ago levels as inflation no longer offset the drop in pounds. Prices are favorable, but demand is just not at the levels we would like to see. That emphasizes all the ways in which fresh produce tends to drive impulse purchases: quality, eye-catching displays, hot promotions and sampling —making operational excellence in execution is extremely important in today’s marketplace.”
Fresh Produce Share of Total Fruits and Vegetables
“The difference in inflationary levels between fresh, frozen and canned is staggering,” Parker commented. “Per Joe’s earlier point, despite fresh produce having much less inflation, consumers still name it among the top five examples of items that cost more now than last year. At the same time, when voting with their wallets, consumers are pulling back on fresh product units much less than in frozen and canned.”
| January 2023 | Dollar sales | Dollar sales gains vs. YA | Unit gains vs. YA | Average price per unit | Increase price vs. YA |
| Fresh produce department | $5.7B | +1.3% | -3.2% | $2.63 | +4.7% |
| Frozen fruits and vegetables | $678M | +11.1% | -7.0% | $3.19 | +22.0% |
| Shelf stable fruits | $367M | +6.5% | -11.6% | $3.40 | +20.4% |
| Shelf stable vegetables | $576M | +4.5% | -12.8% | $1.49 | +19.8% |
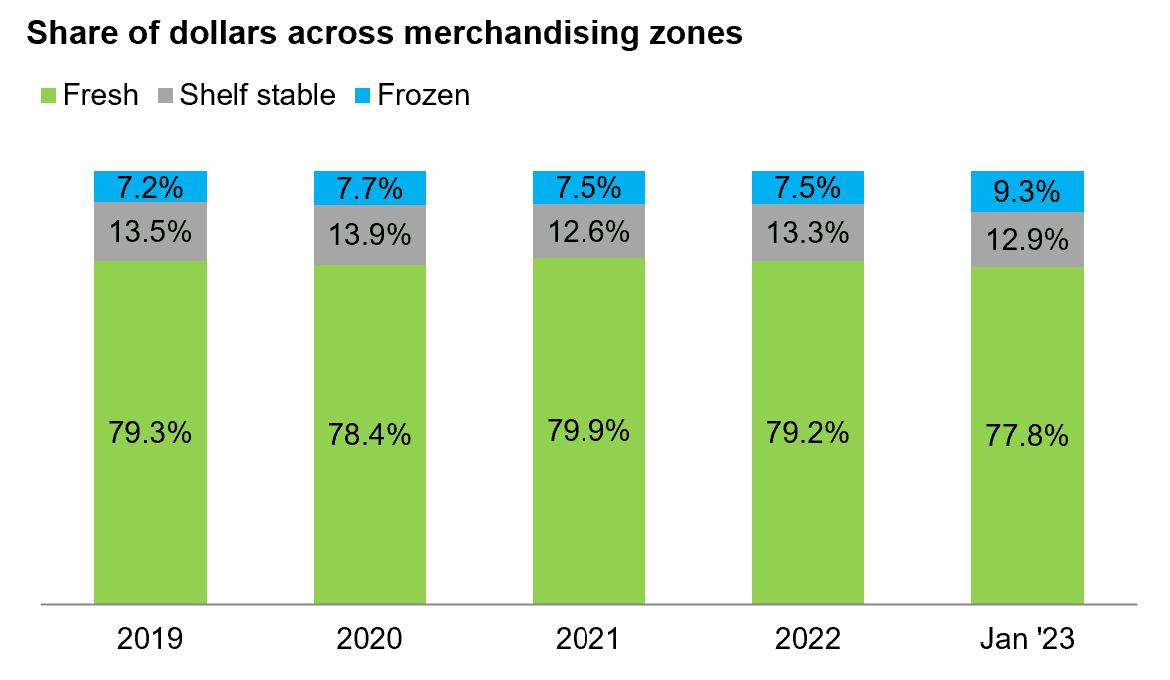
In January 2023, the share of fresh fruit and vegetables dropped to 77.8% in large part due to the below-average inflation. The share of frozen increased to 9.3%. Winter months do tend to see higher levels of frozen foods as meal choices shift to soups, stews and casseroles versus summer salad and barbecue season.
Fresh produce represented 77.3% of pounds, with 8.2% for frozen fruit and vegetables and 14.6% for shelf-stable produce.
Fresh Produce Dollars versus Volume
Fresh produce pound sales have trailed behind year ago levels since March 2021. Pound volume had been recovering but dropped a bit in January to -4.1% when compared to January 2022. After a very strong fourth quarter, fresh produce pounds are back in line with the second and third quarter performance of 2022 in terms of its levels versus pre-pandemic.
After a strong December, the fresh fruit and vegetable performance retreated a bit in January.
Fresh Fruit Sales
| Top 10 in sales | January 2023 | ||||
| Type | $ sales | $ vs. YA | Lbs vs. YA | ||
| Fresh fruit | $2.6B | -1.5% | -3.6% | ||
| Berries | $657M | -0.5% | -4.5% | ||
| Apples | $362M | -2.6% | -7.6% | ||
| Grapes | $273M | +5.4% | +2.6% | ||
| Bananas | $260M | +1.0% | -1.6% | ||
| Avocados | $184M | -13.8% | +4.0% | ||
| Mandarins | $159M | -11.0% | -8.9% | ||
| Melons | $139M | +2.2% | -5.2% | ||
| Oranges | $123M | -13.7% | -16.6% | ||
| Mixed fruit | $70M | +4.1% | +0.5% | ||
| Pineapples | $69M | +3.6% | +1.1% | ||
“The fruit performance in January 2023 was more mixed than we have seen in recent months,” said Parker. “Berries are still the powerhouse, but even berries could not hold the line on pounds that were down 4.5%.” Only four out of the top 10 fruit sellers increased in pounds, being grapes, avocados, mixed fruit and pineapples.
Fresh Vegetables Sales
| Top 10 in sales | January 2023 | |||
| Type | $ sales | $ vs. YA | Lbs vs. YA | |
| Fresh vegetables | $3.0B | +3.7% | -4.8% | |
| Tomatoes | $325M | +7.0% | -0.9% | |
| Potatoes | $306M | +9.0% | -8.5% | |
| Salad kits | $259M | +5.6% | -0.1% | |
| Lettuce | $248M | +15.6% | +0.9% | |
| Onions | $222M | +5.4% | -0.2% | |
| Peppers | $208M | -0.2% | -3.4% | |
| Cucumbers | $116M | +13.4% | +6.0% | |
| Carrots | $116M | -4.6% | -11.2% | |
| Broccoli | $114M | +6.5% | -10.5% | |
| Mushrooms | $100M | -9.9% | -14.2% | |
“The same mixed performance is seen for fresh vegetable as well,” said Watson. “A few items got close to or exceeded year-ago levels in terms of pound sales, being tomatoes, salad kits and onions. Others continue to trend significantly behind, including carrots, broccoli and mushrooms.
Fresh Produce Absolute Dollar Gains
| Top 10 absolute | January 2023 | |||
| dollar growth | $ gain | $ sales | Lbs vs. YA | |
| Lettuce | +$33.6M | $248M | +0.9% | |
| Potatoes | +$25.4M | $306M | -8.5% | |
| Tomatoes | +$21.2M | $325M | -0.9% | |
| Cherries | +$15.7M | $45M | +61.4% | |
| Grapes | +$13.9M | $273M | +2.7% | |
| Salad kits | +$13.7M | $259M | -0.1% | |
| Cucumbers | +$13.7M | $116M | +6.0% | |
| Onions | +$11.4M | $222M | -0.2% | |
| Broccoli | +$7.0M | $114M | -10.5% | |
| Pomegranates | +$6.1M | $20M | +77.1% | |
In January 2023, fresh vegetables added $106 million in additional dollars versus January 2022 whereas total fruit lost some ground. While a few fruits made it into the top 10 items that gained the most in dollars, the top five placements go to vegetables. “While inflation obviously plays a large role as well, the top 10 in dollar growth is also a reflection of consumers retreating into staple purchases,” said Watson. “Potatoes, lettuce, onions, bananas, apples, etc. those are the items with the greatest household penetration any year.”
Gains were achieved in many different ways, but inflation played a big role for all. Others gained on strong demand with volume gains contributing to the inflationary boost, including lettuce, cherries, grapes, cucumbers and pomegranates.
Perishables Performance
| Perimeter | January 2023 | ||||
| departments | $ sales | $ vs. YA | Units vs. YA | ||
| Meat | $6.5B | -1.7% | -4.8% | ||
| Refrigerated (mostly dairy) | $7.0B | +15.9% | -6.8% | ||
| Produce | $5.7B | +1.3% | -3.2% | ||
| Deli | $3.4B | +5.8% | -3.8% | ||
| Bakery | $3.1B | +9.1% | -5.7% | ||
| Seafood | $484M | -1.8% | -4.9% | ||
With heavy inflation in eggs and other dairy items, the total refrigerated department generated a +15.9% increase in sales to reach $7.0 billion in January. However, unit sales were down more than other departments. Fresh produce had the strongest unit performance, even if it was down as well. Seafood, by far the smallest seller, continued to trend in negative territory despite price deflation.
The first quarter of 2023 looks to be little different from 2022. Consumers remain worried about inflation and money-saving measures continue to pressure units and volume. While fresh produce is one of the better performing departments, volume has been trending behind year-ago levels since March 2021. Ingredient inputs, weather and transportation conditions remain areas of concern as prices are lapping the double-digit increases of 2022.
The next report, covering February, including Valentine’s Day and Super Bowl, will be released in mid-March. In addition to the data provided here, the IFPA also now offers InSite – an online interactive data set covering both produce and floral performance as well as a look at the 2023 consumer sentiment surveys. Start your free trial today! See www.freshproduce.com/insite for more detail. We also encourage you to contact Joe Watson, IFPA’s VP, Retail, Foodservice and Wholesale, at jwatson@freshproduce.com with any questions or concerns. Please recognize the continued dedication of the entire grocery and produce supply chains, from farm to retailer. #produce #joyoffresh #SupermarketSuperHeroes.
- 2019: 52 weeks ending 12/28/2019
- 2020: 52 weeks ending 12/27/2020
- 2021: 52 weeks ending 12/26/2021
- 2022: 52 weeks ending 1/1/2023
- Q4 2022: 13 weeks ending 1/1/2023
- January 2023: 4 weeks ending 1/29/2023
