Inflation has dominated the trade and consumer headlines since early fall of last year and June 2022 is no different.
“While consumer money-saving when buying groceries are plentiful, it is important to note that it is not a race to the bottom nor a complete abandoning of restaurant visits,” noted Jonna Parker, Team Lead Fresh at IRI. “However, the 40-year high inflation does mean consumers are much more strategic about their grocery and restaurant choices. That means cooking from scratch one day and leaning on value-added solutions the next. Likewise, we’re seeing consumers seamlessly switching between value and premium — creating a complex pattern of marketplace trends.”
According to the June edition of the IRI monthly survey of primary shoppers, consumers are applying many of the lessons learned during the Great Recession to tighten spending.
Fully 96% of consumers say they are paying somewhat or a lot more for groceries than they did last year — listing examples of price inflation across virtually every department in the store.
“Fresh produce is among the most frequently mentioned items when shoppers reflect on inflation,” said Parker. “Fresh produce has a very high trip frequency, making consumers ultra-aware of the price increases plus produce has always played a key role in store choice.”
Concern over inflation reached its most widespread level yet, at 93% of all grocery shoppers. Up month over month, 81% of grocery shoppers made changes to what and where they purchased in June. This is up from 50% in the fall of 2021. The dominant changes are looking for sales specials (54%), skipping non-essentials (45%), finding coupons (33%) and buying more private or other low-cost brands (29%). Despite the high gas prices, 17% cherry pick specials across retailers and 16% now do some of their shopping at lower-cost retailers.
Sales specials, while popular, are still far below pre-pandemic levels and consumers are taking notice: 59% say fewer of the items they want are on sale and 43% say items are not discounted as much as they used to be. About half of shoppers, 51%, are stocking up on certain items more than usual, 18% out of fear they will not be available next time and 26% out of concern that prices may rise further.
“All this points to great power of relevant, targeted promotions if supply chain conditions allow for it,” said Joe Watson, VP, Retail, Foodservice & Wholesale for IFPA. “It could be a happy hour sale, one-day or three-day promotion, but try to keep fresh produce promotions front and center to retain a greater share of primary shoppers instead of them cherry picking competitors’ deals and losing a vital part of the total store basket.”
Additionally, 95% of shoppers are concerned about the higher gas prices and 72% changed their driving habits because of it, from trying to stock up more to delaying road trips.
“Now is the time to remind shoppers how to store fruits and vegetables for optimal shelf life,” Watson pointed out.
The share of home-prepared meals continued to average around 79-80%. The average share of home-prepared meals is higher among low-income shoppers, at 81.7%, versus high-income shoppers, at 76.7%.
Restaurant engagement remained high in June — virtually unchanged from spring levels. Fifty-five percent of consumers got restaurant takeout in June and 52% dined on-premise. An additional 19% had restaurant food delivered.
“Restaurant takeout and delivery open the door for grocery retailers to sell appetizers, sides, beverages or desserts,” Parker added. “And, each one of those is in the fresh produce department’s wheelhouse.”
The level of new COVID-19 cases no longer appears to have a significant impact on whether people shop in-store or online. Less than one-quarter of Americans are extremely concerned about COVID-19 as of June. In-store trips are holding at a high 87% of total trips. Online trips are near equally divided in home delivery (6%) and store pickup (7%).
The consumer reactions combined with supply side volatility are creating an environment of continued change and uncertainty. IRI, 210 Analytics and IFPA are committed to bringing the latest trends and analysis relative to the produce department.
Inflation Insights
The price per unit across all foods and beverages in the IRI-measured multi-outlet stores, including supermarkets, club, mass, supercenter, drug and military, accelerated further to an increase of 12.3% in the four weeks ending June 26, 2022 (“June”) versus year ago. This is up from +11.9% in the second quarter of the year. June inflation was in the double digits in the center of the store (+11.3%) as well as in perishables (+11.8%) and compared to two years ago (June 2019), prices across all foods and beverages were up 24.2%.
Source: IRI, Integrated Fresh, Total US, MULO, average price per unit and % gain versus YA
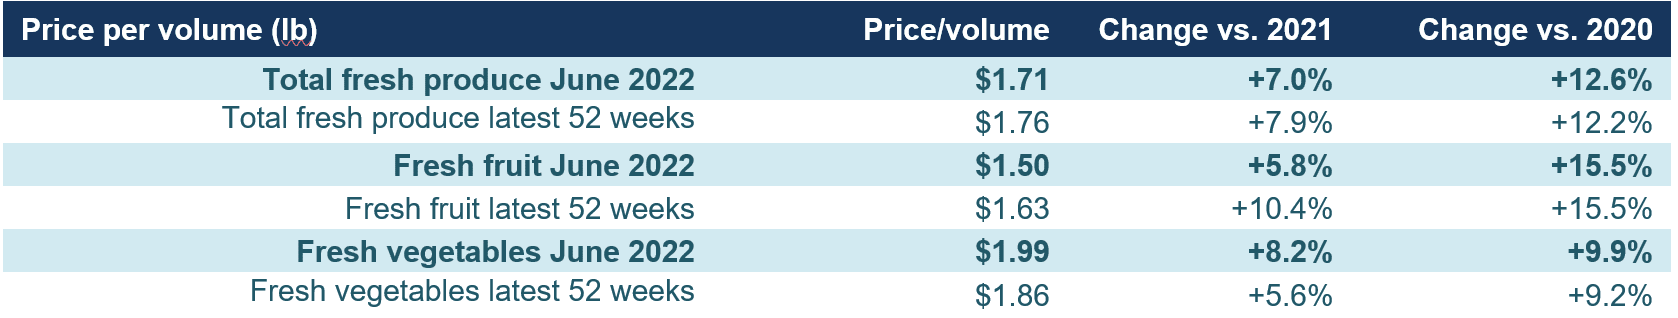
Fresh produce prices were also up from last year, at +8.0% level on a per-unit basis and +7.0% on a per-pound basis. This is far below the total store average as fruit prices dropped considerably in June. Unlike the beginning of the year where inflation was predominantly driven by fruit, it was vegetables that reached +8.2% inflation in June 2022 versus June 2019. In the 52-week view, fresh fruit inflation is still far above average.
Source: IRI, Integrated Fresh, Total US, MULO, average price per volume and % gain versus YA and 2YA
June 2022 Sales
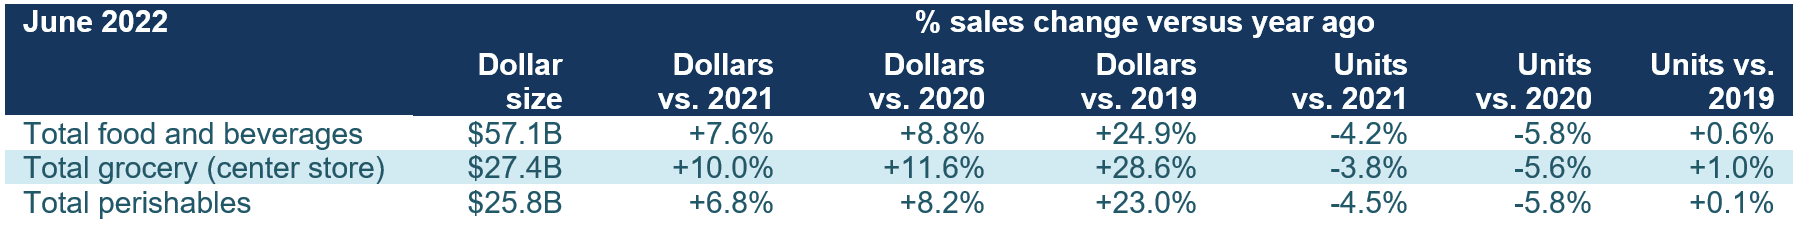
The four June 2022 weeks brought $57.1 billion in total food and beverage sales, which was up +7.6% versus year ago. This is an acceleration from +6.5% in May 2022. June 2022 dollar sales were up +24.9% versus June 2019 — the pre-pandemic normal. All gains were inflation-boosted year-on-year, with unit sales down -4.2%. This was slightly better than the -4.8% in May, but still down substantially from the -2.4% unit decline measured in April 2022. Much like seen in the surveys, consumers are compensating for the inflationary levels by buying fewer items. Perishables, including produce, seafood, meat, bakery and deli, had average dollar and unit performance, but center-store items did better than average in both dollars and units.
Source: IRI, Integrated Fresh, Total US, MULO
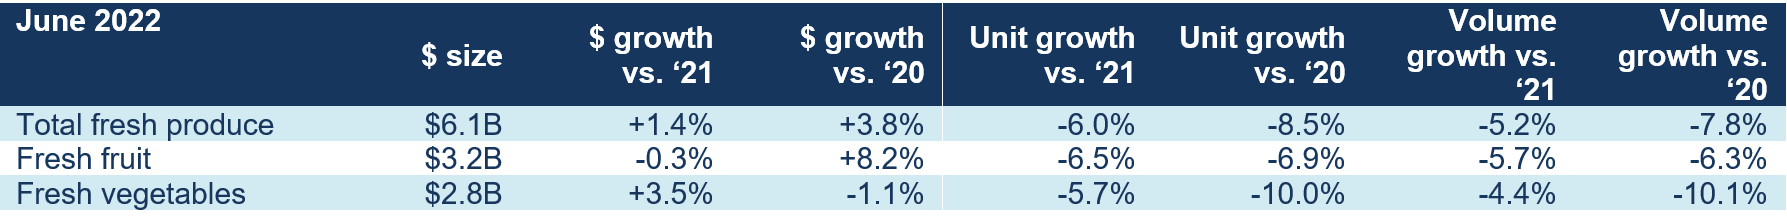
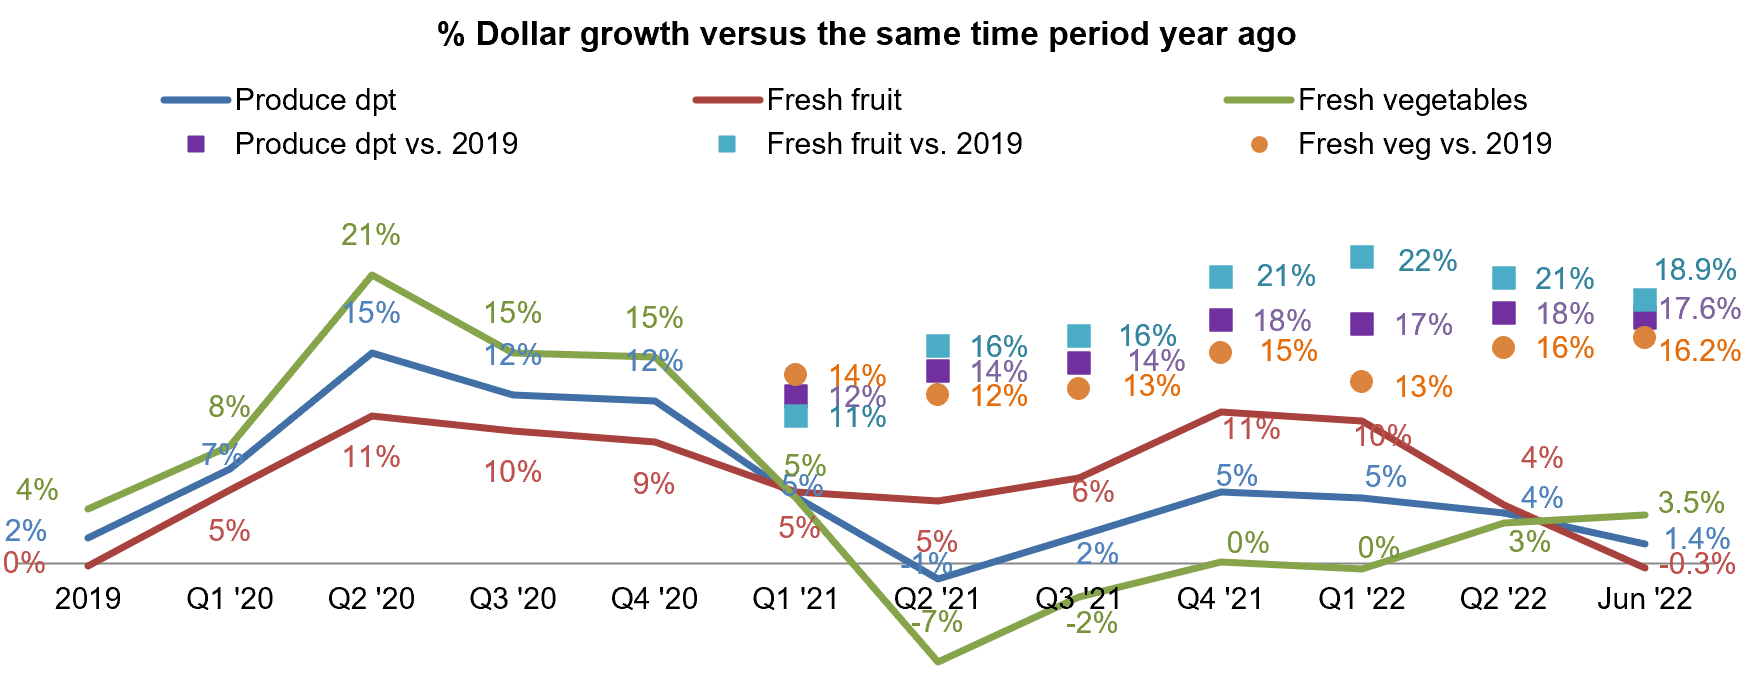
June 2022 fresh produce sales reached $6.1 billion, surpassing the record set the prior year by +1.4%. However, looking beyond dollars that were highly affected by inflation, unit and volume declined versus June 2021. “There are many forces at play relative to the volume pressure,” said Watson. “Consumers are hyper-focused on saving money, frozen and shelf-stable play a role, and there is the impact of supply chain disruption and out-of-stocks. Opportunities for the summer months lie with outdoor entertaining, on-the-go snacking and celebrating the summer holidays at home.”
Source: IRI, Integrated Fresh, Total US, MULO, % change vs. year ago.
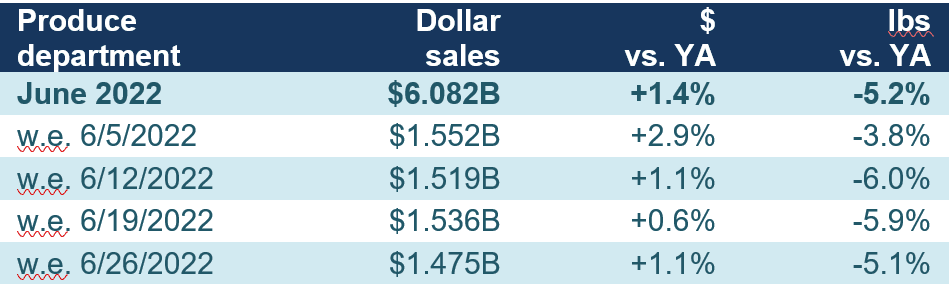
Each of the June weeks generated between $1.4 and $1.6 billion in fresh produce sales. The first week was the strongest, at $1.55 billion; however, the third week which proceeded Father’s Day, also saw $1.536B in sales. Volume sales, on the other hand, were down consistently, whether an everyday or holiday week, from June 2021 levels.
Source: IRI, Integrated Fresh, Total US, MULO
Sales patterns crossed over in the second quarter of 2022. Whereas fruit had been leading the 2021 and early 2022 growth, vegetables took over as the year-on-year growth leader come June. In part, this is due to vegetables showing higher inflation than fruit and in part it is because of going up against softer sales in June 2021 whereas fruit has the harder path to growth coming off a very strong 2021. “Shoppers continue to have around 79-80% of meals made in the home, as well as a continue boom in healthy snacking. Both trends favor produce strength, even despite year-over-year price increases,” said Parker.
Source: IRI Integrated Fresh, Total U.S., MULO
Fresh Produce Share of Total Fruits and Vegetables
Frozen and shelf-stable fruits and vegetables had double-digit inflation in June 2022 compared with 2021. This resulted in above average dollar gains. Both frozen and shelf-stable are heavily impacted by supply chain disruptions. Both assortment and inventory levels have been down significantly over recent months in these areas.
Source: IRI Integrated Fresh, Total US, MULO
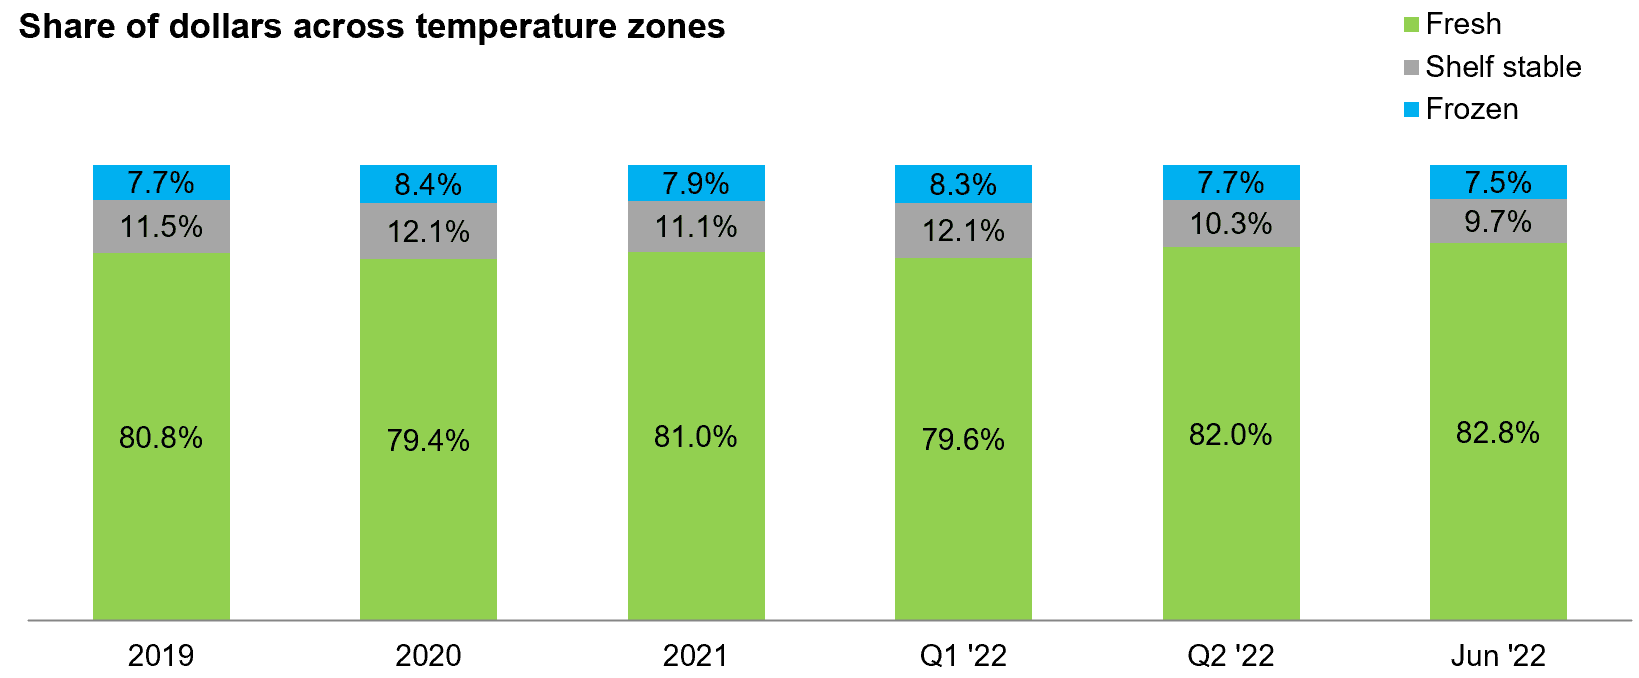
In the first quarter of 2022, just under 80% of total fruit and vegetable dollars were generated by the fresh produce department. Summer is typically the strongest selling season for fresh produce and 2022 is no different. The share of fresh produce dollars in the second quarter ticked up to 82% and it reached 82.8% in June, despite below-average inflation.
As a share of total pounds sold across the three areas, fresh produce made up 83.3% in June and 82.5% in the entire second quarter. Shelf-stable tends to represent a higher share in pounds than in dollars because of the lower price per volume. “With sales shares between fruit and vegetable spaces in the store holding steady, we are not expecting frozen or canned to fresh swap outs to increase – all three spaces are seen as unique by consumers in most produce categories,” said Parker.
Source: IRI Integrated Fresh, Total U.S., MULO
Fresh Produce Dollars versus Volume
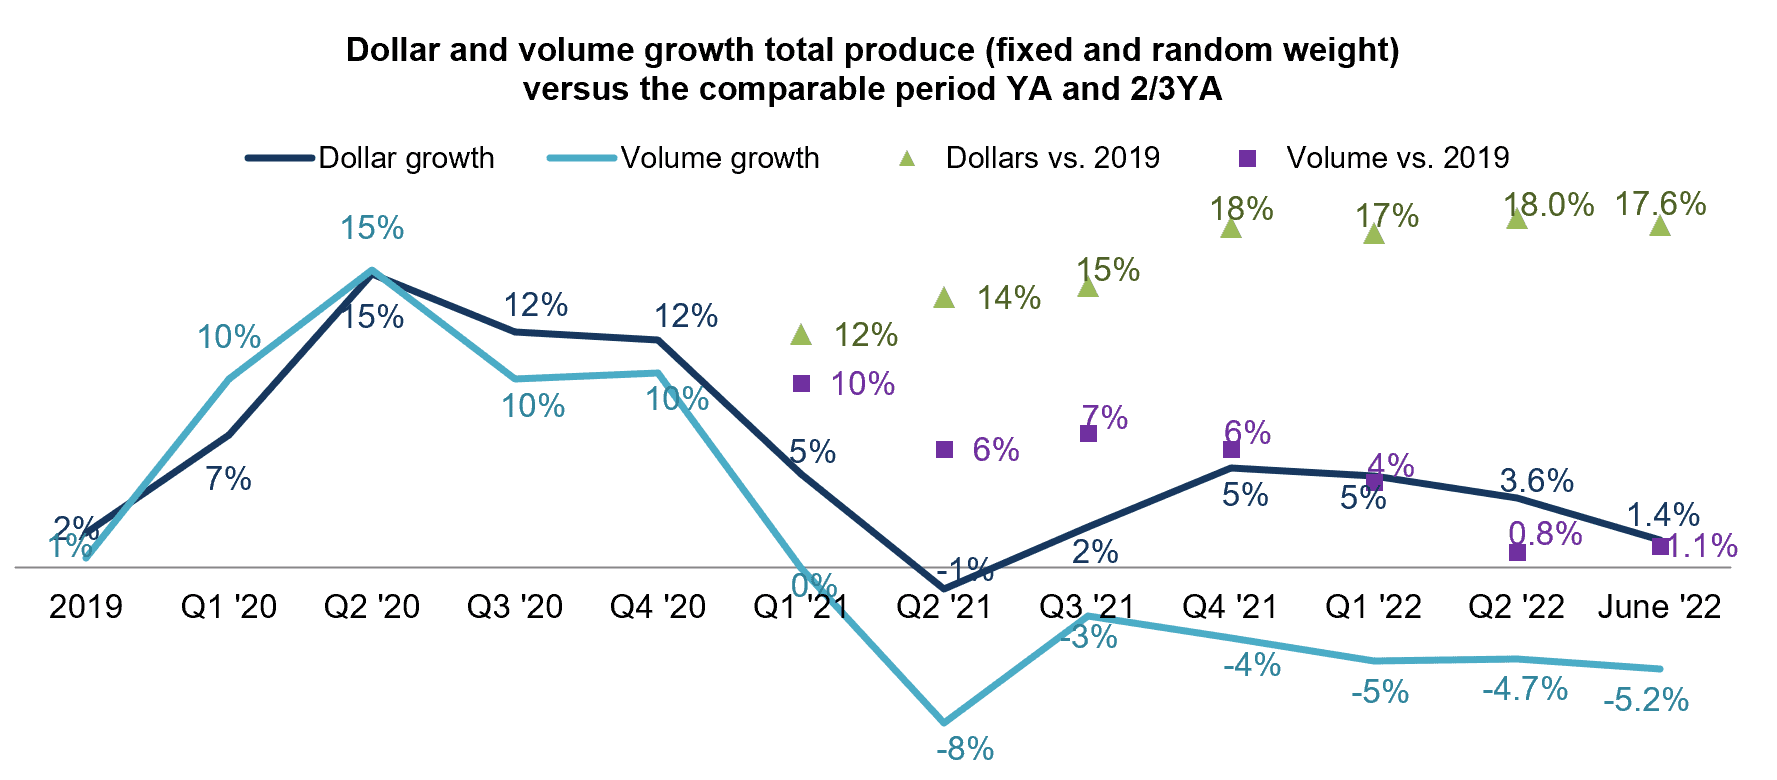
Fresh produce pound sales trailed behind year ago levels all throughout 2021 and the first quarter of 2022. In the second quarter of 2022, pound sales were down -4.7% year-on-year. Pounds saw an even greater year-on-year drop in June, at -5.2% — its lowest level since the second quarter of 2021. Importantly, compared with 2019, the pre-pandemic normal, dollars remain +17.6% ahead (green triangles) and pounds stayed above 2019 levels by +1.1% (purple squares).
Source: IRI Integrated Fresh, Total U.S., MULO
“Fruit had been experiencing some volume pressure lately, but managed to reverse that on much better prices in June,” Parker explained. “Vegetable pounds are down year-on-year as well, but also still well ahead of the 2019 pre-pandemic normal.”
Source: IRI Integrated Fresh, Total U.S., MULO
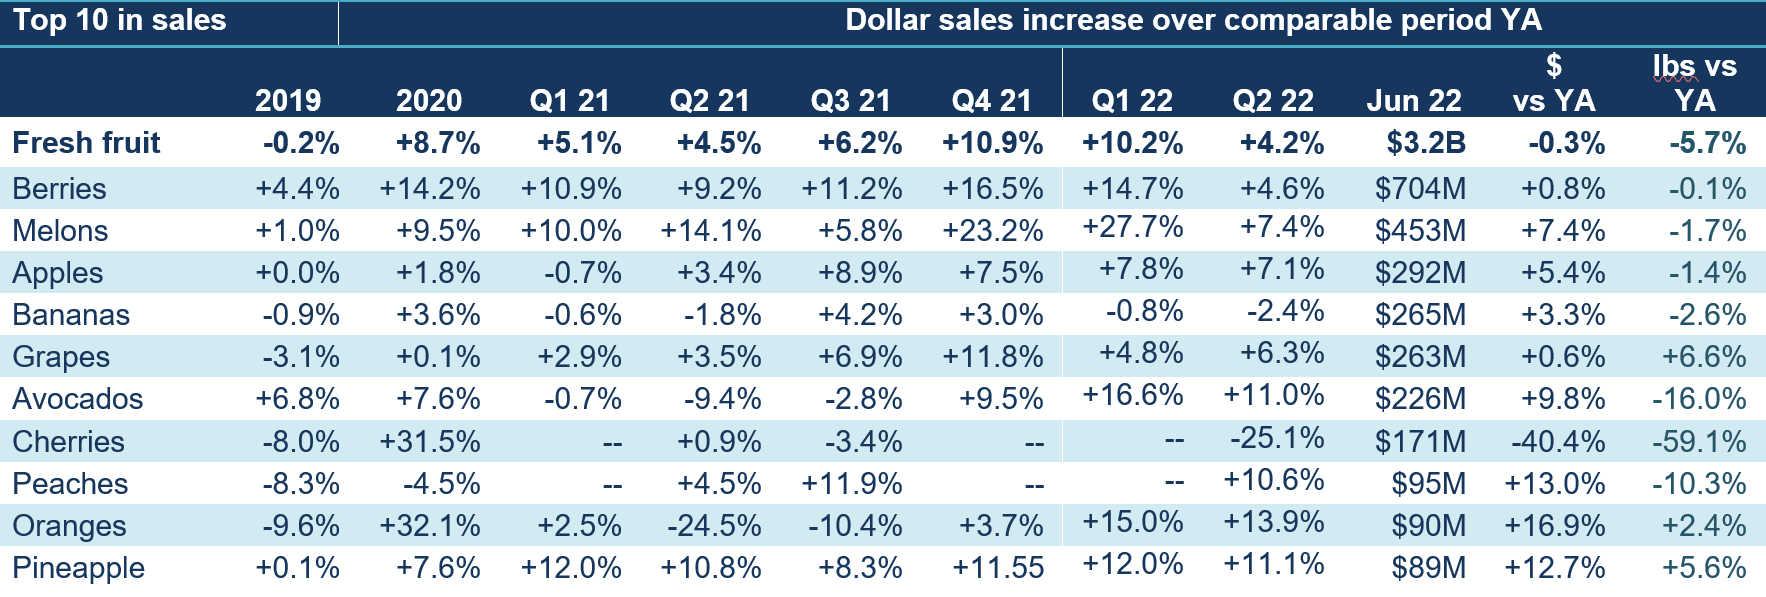
Fresh Fruit Sales in June
“In June 2022, berries sales continued to dominate but are no longer the slam-dunk growth driver they have been throughout the pandemic. Berries had slight dollar sales in June of +0.8% but pounds were flat,” Parker said. “Mixed fruit and mandarins dropped out of the top 10, and peaches and pineapples made their inroads. Volume sales were a mix with increases for grapes, oranges and pineapples but down results for all other top 10 sellers.”
Source: IRI Integrated Fresh, Total U.S., MULO
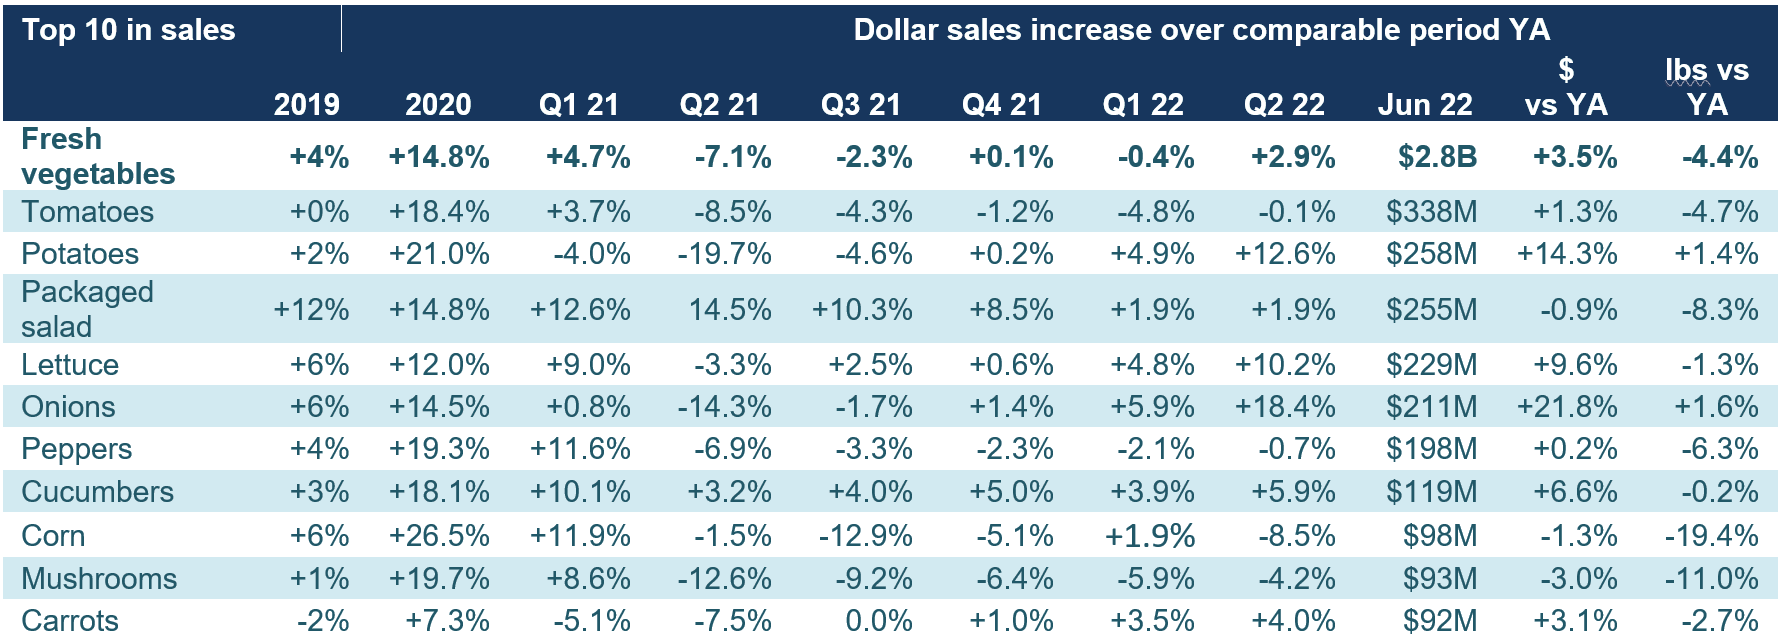
Fresh Vegetables Sales in June
“June’s vegetable performance was very mixed,” said Watson. “Seven out of the top 10 sellers increased dollar sales but only two areas had volume increases. These were potatoes and onions.”
Source: IRI Integrated Fresh, Total U.S., MULO
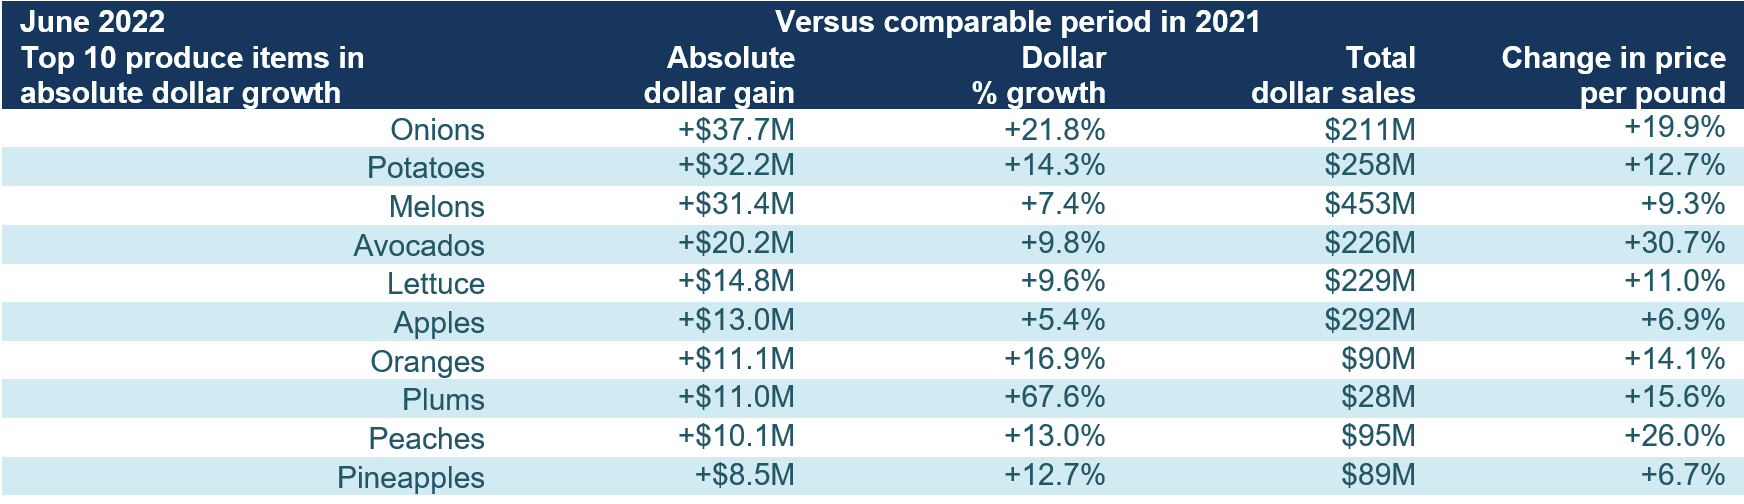
Fresh Produce Absolute Dollar Gains
In June 2022, fresh fruit added $78 million in sales and vegetables added $93 million when compared to June 2021. “The top 10 in absolute dollar gains shows the rising impact of inflation which tends to push shoppers to versatile cooking basics and cost-effective fruits, generally with an eye on shelf life,” said Parker. “But summer outdoor entertaining and the wide variety of in-season fruit is also driving growth. Peaches, plums and pineapples are all relatively small sellers that managed to add significant new dollars in June.”
Source: IRI Integrated Fresh, Total U.S., MULO
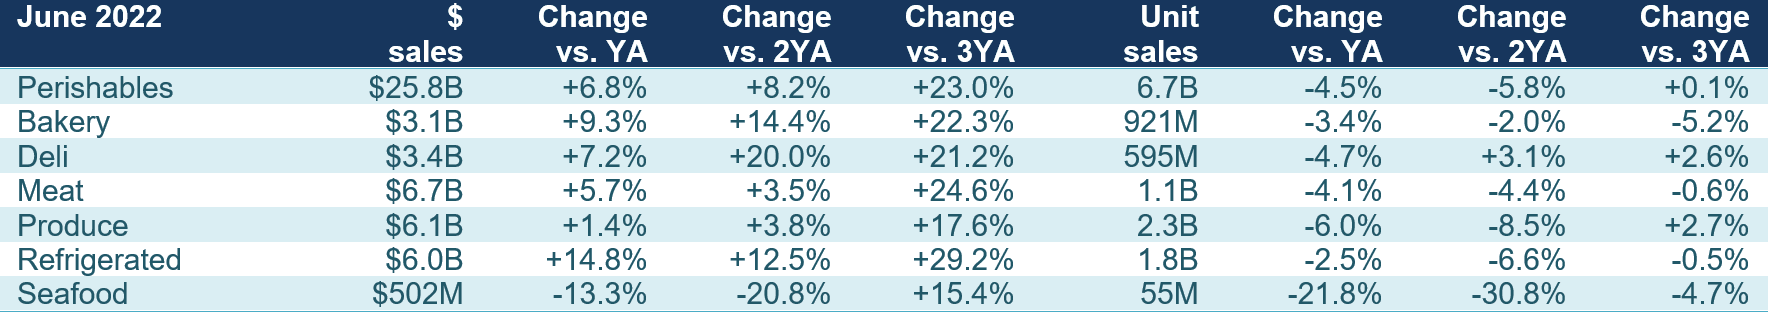
Perishables Performance
In May, total perishables grew +6.8%, with above-average increases for bakery, deli and refrigerated, which includes dairy. The highest gain versus the pre-pandemic normal was generated by refrigerated, up +29.2% in June of 2022 versus June 2019. The departments still selling more units in June 2022 than they did in May 2019 were deli and produce.
Source: IRI Integrated Fresh, Total U.S., MULO, fixed and random weight items combined into department views
What’s Next?
Continued supply chain disruptions, including the rising costs of gasoline and diesel, coupled with the Russian sanctions that went in effect on June 1 for a number of categories as well as rises in housing and rent prices are all combining to hit shoppers’ perceptions at the grocery store as well as actual pocketbooks.
Inflation will have a profound impact on grocery and total food spending. However, we are not seeing a race to the bottom for cost-savings measures. Depending on the meal occasion, consumers are moving between value and premiumization, scratch and convenience, brands and store brands — making grocery patterns more unpredictable than ever.
45% of American households describe their financial situation as being worse than a year ago.
41% feel their financial situation one year from now will look worse than it does today.
The next report, covering July, will be released in mid-August. In addition to the data provided here, the IFPA also now offers InSite – an online interactive data set covering both produce and floral performance as well as a look at the 2021 consumer sentiment surveys. Start your free trial today! See www.freshproduce.com/insite for more detail. We also encourage you to contact Joe Watson, IFPA’s VP, Retail, Foodservice and Wholesale, at jwatson@freshproduce.com with any questions or concerns. Please recognize the continued dedication of the entire grocery and produce supply chains, from farm to retailer. #produce #joyoffresh #SupermarketSuperHeroes.
Date ranges:
2019: 52 weeks ending 12/28/2019
2020: 52 weeks ending 12/27/2020
Q1 2021: 13 weeks ending 3/28/2021
Q2 2021: 13 weeks ending 6/27/2021
Q3 2021: 13 weeks ending 9/26/2021
Q4 2021: 13 weeks ending 12/26/2021
Q1 2022: 13 weeks ending 3/27/2022
Q2 2022: 13 weeks ending 6/26/2022
June 2022: 4 weeks ending 6/26/2022
The June Marketplace
Inflation has dominated the trade and consumer headlines since early fall of last year and June 2022 is no different.
“While consumer money-saving when buying groceries are plentiful, it is important to note that it is not a race to the bottom nor a complete abandoning of restaurant visits,” noted Jonna Parker, Team Lead Fresh at IRI. “However, the 40-year high inflation does mean consumers are much more strategic about their grocery and restaurant choices. That means cooking from scratch one day and leaning on value-added solutions the next. Likewise, we’re seeing consumers seamlessly switching between value and premium — creating a complex pattern of marketplace trends.”
According to the June edition of the IRI monthly survey of primary shoppers, consumers are applying many of the lessons learned during the Great Recession to tighten spending.
Fully 96% of consumers say they are paying somewhat or a lot more for groceries than they did last year — listing examples of price inflation across virtually every department in the store.
“Fresh produce is among the most frequently mentioned items when shoppers reflect on inflation,” said Parker. “Fresh produce has a very high trip frequency, making consumers ultra-aware of the price increases plus produce has always played a key role in store choice.”
Concern over inflation reached its most widespread level yet, at 93% of all grocery shoppers. Up month over month, 81% of grocery shoppers made changes to what and where they purchased in June. This is up from 50% in the fall of 2021. The dominant changes are looking for sales specials (54%), skipping non-essentials (45%), finding coupons (33%) and buying more private or other low-cost brands (29%). Despite the high gas prices, 17% cherry pick specials across retailers and 16% now do some of their shopping at lower-cost retailers.
Sales specials, while popular, are still far below pre-pandemic levels and consumers are taking notice: 59% say fewer of the items they want are on sale and 43% say items are not discounted as much as they used to be. About half of shoppers, 51%, are stocking up on certain items more than usual, 18% out of fear they will not be available next time and 26% out of concern that prices may rise further.
“All this points to great power of relevant, targeted promotions if supply chain conditions allow for it,” said Joe Watson, VP, Retail, Foodservice & Wholesale for IFPA. “It could be a happy hour sale, one-day or three-day promotion, but try to keep fresh produce promotions front and center to retain a greater share of primary shoppers instead of them cherry picking competitors’ deals and losing a vital part of the total store basket.”
Additionally, 95% of shoppers are concerned about the higher gas prices and 72% changed their driving habits because of it, from trying to stock up more to delaying road trips.
“Now is the time to remind shoppers how to store fruits and vegetables for optimal shelf life,” Watson pointed out.
The share of home-prepared meals continued to average around 79-80%. The average share of home-prepared meals is higher among low-income shoppers, at 81.7%, versus high-income shoppers, at 76.7%.
Restaurant engagement remained high in June — virtually unchanged from spring levels. Fifty-five percent of consumers got restaurant takeout in June and 52% dined on-premise. An additional 19% had restaurant food delivered.
“Restaurant takeout and delivery open the door for grocery retailers to sell appetizers, sides, beverages or desserts,” Parker added. “And, each one of those is in the fresh produce department’s wheelhouse.”
The level of new COVID-19 cases no longer appears to have a significant impact on whether people shop in-store or online. Less than one-quarter of Americans are extremely concerned about COVID-19 as of June. In-store trips are holding at a high 87% of total trips. Online trips are near equally divided in home delivery (6%) and store pickup (7%).
The consumer reactions combined with supply side volatility are creating an environment of continued change and uncertainty. IRI, 210 Analytics and IFPA are committed to bringing the latest trends and analysis relative to the produce department.
Inflation Insights
The price per unit across all foods and beverages in the IRI-measured multi-outlet stores, including supermarkets, club, mass, supercenter, drug and military, accelerated further to an increase of 12.3% in the four weeks ending June 26, 2022 (“June”) versus year ago. This is up from +11.9% in the second quarter of the year. June inflation was in the double digits in the center of the store (+11.3%) as well as in perishables (+11.8%) and compared to two years ago (June 2019), prices across all foods and beverages were up 24.2%.
Source: IRI, Integrated Fresh, Total US, MULO, average price per unit and % gain versus YA
Fresh produce prices were also up from last year, at +8.0% level on a per-unit basis and +7.0% on a per-pound basis. This is far below the total store average as fruit prices dropped considerably in June. Unlike the beginning of the year where inflation was predominantly driven by fruit, it was vegetables that reached +8.2% inflation in June 2022 versus June 2019. In the 52-week view, fresh fruit inflation is still far above average.
Source: IRI, Integrated Fresh, Total US, MULO, average price per volume and % gain versus YA and 2YA
June 2022 Sales
The four June 2022 weeks brought $57.1 billion in total food and beverage sales, which was up +7.6% versus year ago. This is an acceleration from +6.5% in May 2022. June 2022 dollar sales were up +24.9% versus June 2019 — the pre-pandemic normal. All gains were inflation-boosted year-on-year, with unit sales down -4.2%. This was slightly better than the -4.8% in May, but still down substantially from the -2.4% unit decline measured in April 2022. Much like seen in the surveys, consumers are compensating for the inflationary levels by buying fewer items. Perishables, including produce, seafood, meat, bakery and deli, had average dollar and unit performance, but center-store items did better than average in both dollars and units.
Source: IRI, Integrated Fresh, Total US, MULO
June 2022 fresh produce sales reached $6.1 billion, surpassing the record set the prior year by +1.4%. However, looking beyond dollars that were highly affected by inflation, unit and volume declined versus June 2021. “There are many forces at play relative to the volume pressure,” said Watson. “Consumers are hyper-focused on saving money, frozen and shelf-stable play a role, and there is the impact of supply chain disruption and out-of-stocks. Opportunities for the summer months lie with outdoor entertaining, on-the-go snacking and celebrating the summer holidays at home.”
Source: IRI, Integrated Fresh, Total US, MULO, % change vs. year ago.
Each of the June weeks generated between $1.4 and $1.6 billion in fresh produce sales. The first week was the strongest, at $1.55 billion; however, the third week which proceeded Father’s Day, also saw $1.536B in sales. Volume sales, on the other hand, were down consistently, whether an everyday or holiday week, from June 2021 levels.
Source: IRI, Integrated Fresh, Total US, MULO
Sales patterns crossed over in the second quarter of 2022. Whereas fruit had been leading the 2021 and early 2022 growth, vegetables took over as the year-on-year growth leader come June. In part, this is due to vegetables showing higher inflation than fruit and in part it is because of going up against softer sales in June 2021 whereas fruit has the harder path to growth coming off a very strong 2021. “Shoppers continue to have around 79-80% of meals made in the home, as well as a continue boom in healthy snacking. Both trends favor produce strength, even despite year-over-year price increases,” said Parker.
Source: IRI Integrated Fresh, Total U.S., MULO
Fresh Produce Share of Total Fruits and Vegetables
Frozen and shelf-stable fruits and vegetables had double-digit inflation in June 2022 compared with 2021. This resulted in above average dollar gains. Both frozen and shelf-stable are heavily impacted by supply chain disruptions. Both assortment and inventory levels have been down significantly over recent months in these areas.
Source: IRI Integrated Fresh, Total US, MULO
In the first quarter of 2022, just under 80% of total fruit and vegetable dollars were generated by the fresh produce department. Summer is typically the strongest selling season for fresh produce and 2022 is no different. The share of fresh produce dollars in the second quarter ticked up to 82% and it reached 82.8% in June, despite below-average inflation.
As a share of total pounds sold across the three areas, fresh produce made up 83.3% in June and 82.5% in the entire second quarter. Shelf-stable tends to represent a higher share in pounds than in dollars because of the lower price per volume. “With sales shares between fruit and vegetable spaces in the store holding steady, we are not expecting frozen or canned to fresh swap outs to increase – all three spaces are seen as unique by consumers in most produce categories,” said Parker.
Source: IRI Integrated Fresh, Total U.S., MULO
Fresh Produce Dollars versus Volume
Fresh produce pound sales trailed behind year ago levels all throughout 2021 and the first quarter of 2022. In the second quarter of 2022, pound sales were down -4.7% year-on-year. Pounds saw an even greater year-on-year drop in June, at -5.2% — its lowest level since the second quarter of 2021. Importantly, compared with 2019, the pre-pandemic normal, dollars remain +17.6% ahead (green triangles) and pounds stayed above 2019 levels by +1.1% (purple squares).
Source: IRI Integrated Fresh, Total U.S., MULO
“Fruit had been experiencing some volume pressure lately, but managed to reverse that on much better prices in June,” Parker explained. “Vegetable pounds are down year-on-year as well, but also still well ahead of the 2019 pre-pandemic normal.”
Source: IRI Integrated Fresh, Total U.S., MULO
Fresh Fruit Sales in June
“In June 2022, berries sales continued to dominate but are no longer the slam-dunk growth driver they have been throughout the pandemic. Berries had slight dollar sales in June of +0.8% but pounds were flat,” Parker said. “Mixed fruit and mandarins dropped out of the top 10, and peaches and pineapples made their inroads. Volume sales were a mix with increases for grapes, oranges and pineapples but down results for all other top 10 sellers.”
Source: IRI Integrated Fresh, Total U.S., MULO
Fresh Vegetables Sales in June
“June’s vegetable performance was very mixed,” said Watson. “Seven out of the top 10 sellers increased dollar sales but only two areas had volume increases. These were potatoes and onions.”
Source: IRI Integrated Fresh, Total U.S., MULO
Fresh Produce Absolute Dollar Gains
In June 2022, fresh fruit added $78 million in sales and vegetables added $93 million when compared to June 2021. “The top 10 in absolute dollar gains shows the rising impact of inflation which tends to push shoppers to versatile cooking basics and cost-effective fruits, generally with an eye on shelf life,” said Parker. “But summer outdoor entertaining and the wide variety of in-season fruit is also driving growth. Peaches, plums and pineapples are all relatively small sellers that managed to add significant new dollars in June.”
Source: IRI Integrated Fresh, Total U.S., MULO
Perishables Performance
In May, total perishables grew +6.8%, with above-average increases for bakery, deli and refrigerated, which includes dairy. The highest gain versus the pre-pandemic normal was generated by refrigerated, up +29.2% in June of 2022 versus June 2019. The departments still selling more units in June 2022 than they did in May 2019 were deli and produce.
Source: IRI Integrated Fresh, Total U.S., MULO, fixed and random weight items combined into department views
What’s Next?
Continued supply chain disruptions, including the rising costs of gasoline and diesel, coupled with the Russian sanctions that went in effect on June 1 for a number of categories as well as rises in housing and rent prices are all combining to hit shoppers’ perceptions at the grocery store as well as actual pocketbooks.
Inflation will have a profound impact on grocery and total food spending. However, we are not seeing a race to the bottom for cost-savings measures. Depending on the meal occasion, consumers are moving between value and premiumization, scratch and convenience, brands and store brands — making grocery patterns more unpredictable than ever.
45% of American households describe their financial situation as being worse than a year ago.
41% feel their financial situation one year from now will look worse than it does today.
The next report, covering July, will be released in mid-August. In addition to the data provided here, the IFPA also now offers InSite – an online interactive data set covering both produce and floral performance as well as a look at the 2021 consumer sentiment surveys. Start your free trial today! See www.freshproduce.com/insite for more detail. We also encourage you to contact Joe Watson, IFPA’s VP, Retail, Foodservice and Wholesale, at jwatson@freshproduce.com with any questions or concerns. Please recognize the continued dedication of the entire grocery and produce supply chains, from farm to retailer. #produce #joyoffresh #SupermarketSuperHeroes.
Date ranges:
2019: 52 weeks ending 12/28/2019
2020: 52 weeks ending 12/27/2020
Q1 2021: 13 weeks ending 3/28/2021
Q2 2021: 13 weeks ending 6/27/2021
Q3 2021: 13 weeks ending 9/26/2021
Q4 2021: 13 weeks ending 12/26/2021
Q1 2022: 13 weeks ending 3/27/2022
Q2 2022: 13 weeks ending 6/26/2022
June 2022: 4 weeks ending 6/26/2022
Anne-Marie Roerink is the president of 210 Analytics.