The battle for the food dollar is intensifying as shoppers are ramping up their engagement with restaurants.
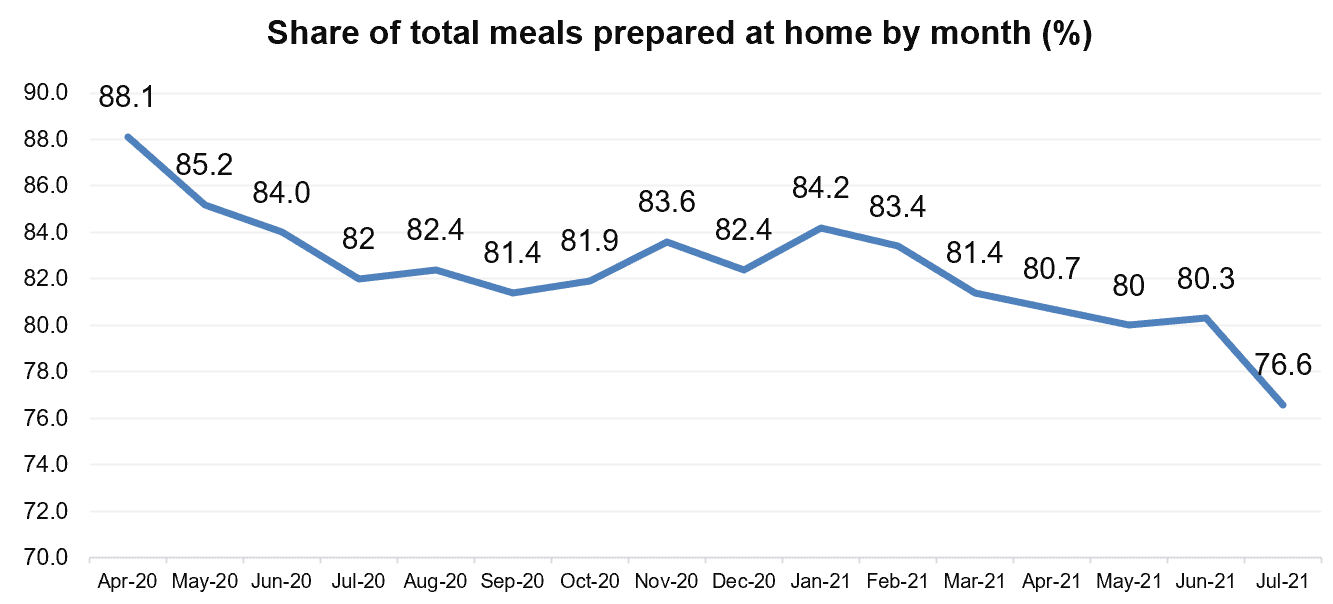
“Whereas in May, the IRI survey of primary shoppers found that 40% had dined inside at a restaurant, come July this share has risen to 50%. At the same time, restaurant takeout (53% of shoppers) and home delivery (21%) are unchanged from their May levels,” says Jonna Parker, Team Lead, Fresh with IRI. “This coincides with steady fall in the share of meals prepared at home, which shoppers estimate to be an average of 76.6% across meal occasions in July 2021. This is down slightly from 82.0% in July 2020.”
(click to enlarge)
Behind the quick rise in on-premise dining are summer road trips, making up for all the missed celebrations with friends and family, cooking fatigue but also a return to working away from home. In January of 2021, 45% of shoppers indicated they would not or rarely work from home. Come July 2021, this share has risen to 55%. That means more time pressure for breakfast and dinner as commuting resumes, in addition to more lunches consumed away from home.
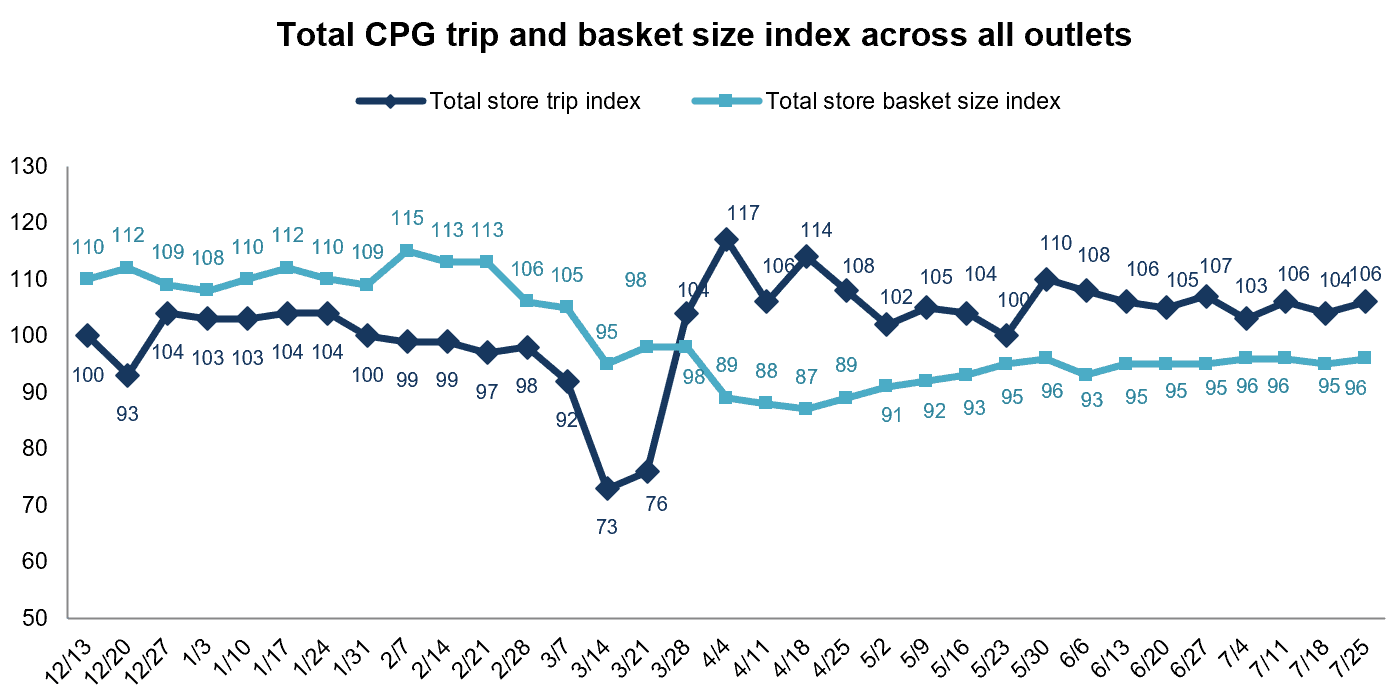
Shoppers are not only returning to restaurants but also to the grocery store for in-person trips. In November 2020, 62% indicated they would do all their shopping in store in the coming four weeks. The July 2021 IRI survey found that 71% planned to exclusively shop in-store. The return to in-store shopping is confirmed by the trendline documenting the nature of shoppers’ most recent trip. The in-store trip share was as low as 81% in October 2020 and has increased to 87% in the July survey — taking online trips down to 13%. In addition to more in-store trips, the average time spent in the store rose to a 12-month high at an average of 32.3 minutes.
Trips and Basket Size
2020 had many fewer in-store trips but a highly elevated basket size when people did shop. Come March, that picture reversed. Compared to year ago, total food and beverage trips are trending well ahead of 2020 levels whereas the spend per trip has dropped below the 2020 record levels.
Source: IRI, household panel, all outlets, total CPG 12/13/2020 through 7/25/2021 versus YA
In this vastly different and ever-changing marketplace, 210 Analytics, IRI and the Produce Marketing Association (PMA) continue their partnership to bring an in-depth understanding of how fresh produce performed relative to 2020 and 2019.
Food Inflation
Food inflation has become a big topic of discussion in recent weeks and, this year, produce prices are not the exception like we saw in 2020. IRI-measured price inflation (i.e. dollars divided by volume sold at retail) shows that prices continued to rise over and above their elevated 2020 levels for total food and beverages. The price index for fresh produce sat higher than total food and beverages for all May and June 2021 weeks. Come July, inflation (price paid per pound at retail) in fresh produce dropped slightly below the rest of the store. The July numbers from the Bureau of Labor Statistics (BLS) are scheduled to be released on August 11, 2021.
Source: IRI, Integrated Fresh Total US, MULO, inflation index vs. YAGO
Week-by-Week July Sales
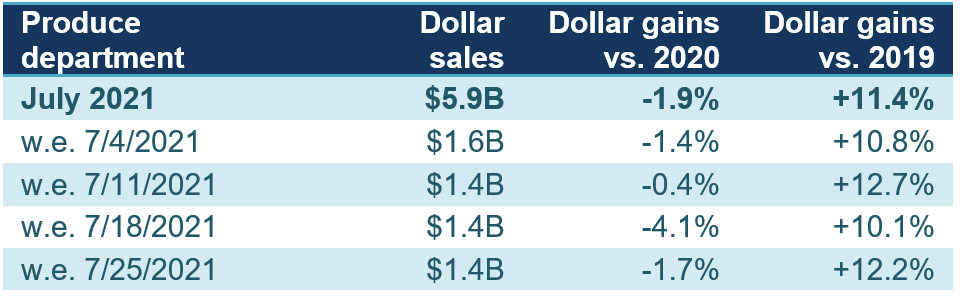
Despite many more Americans celebrating Independence Day with gatherings this year than last, sales could not quite match the 2020 levels. At $1.6 billion, the Fourth of July week fell short 1.4% versus 2020, but increased 10.8% versus the pre-pandemic normal of 2019.
Source: IRI, Integrated Fresh, Total US, MULO, $ sales June
Combined, the four July weeks generated $5.9 billion, which was down about 2% year-over-year.
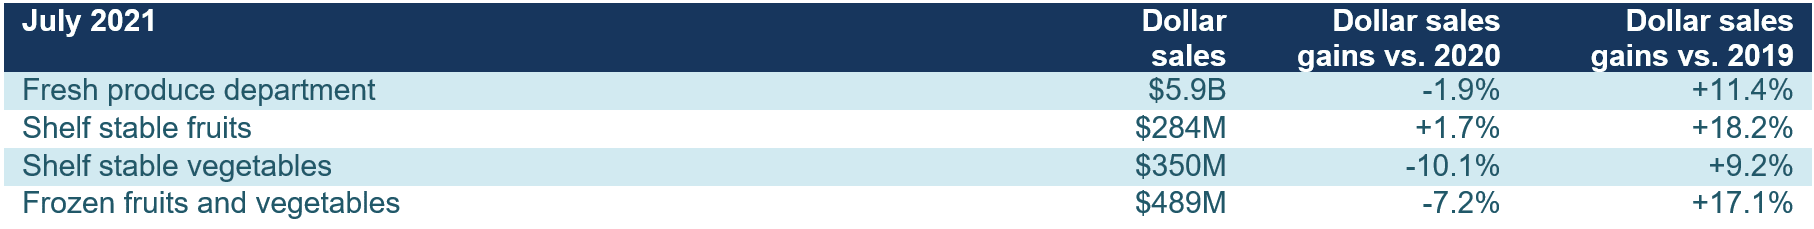
Fresh produce generated $5.9 billion in sales during the four July 2021 weeks. This is up $97 million from the four June 2021 weeks. Fresh fruit drove all of the gain, with year-over year growth of +1.2% versus -5.4% for vegetables.
“While both fruit and vegetables were up about 11% versus July 2019, fruit is having the better year-over-year performance,” said Joe Watson, VP of Membership and Engagement for the Produce Marketing Association (PMA). “The difference is the outstanding performance of vegetables in 2020, which means a tougher road for growth this year. Additionally, fruit has experienced slightly higher inflation thus far in 2021 than vegetables, which boosts dollar sales gains.”
Source: IRI Integrated Fresh, Total U.S., MULO, % change vs. YA
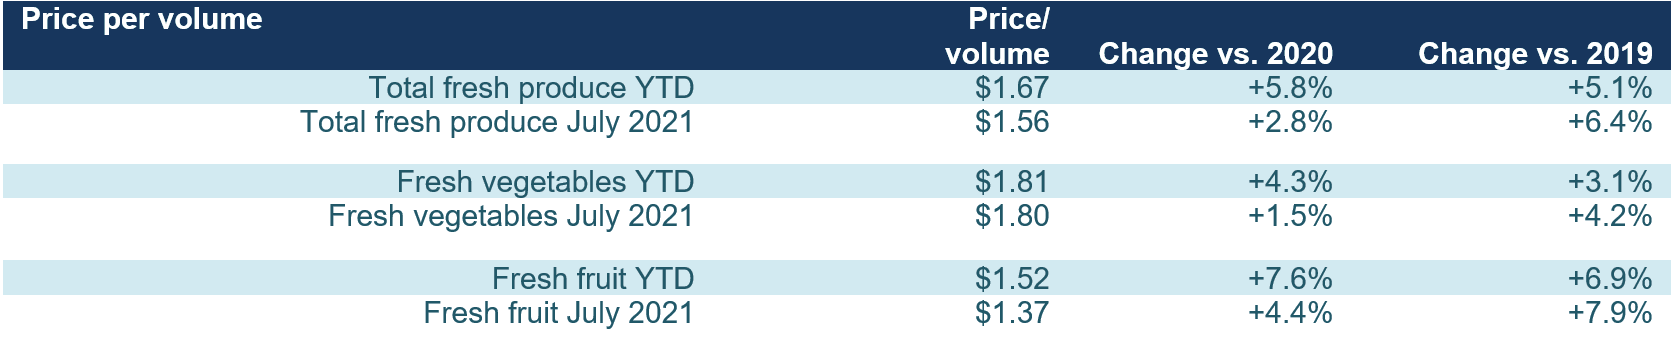
Watson is referring to the 5.8% increase in the price per pound for fresh produce since the start of 2021 versus the same period in 2020. The increase in the average price per pound for fruit has increased 7.6% during this period, versus 4.3% for vegetables.
Source: IRI, Integrated Fresh, Total US, MULO, average price per volume and % gain versus YA and 2YA
Fresh Share
In addition to year-over-year growth in fresh fruit, shelf-stable fruit also gained, at +1.7%. Frozen fruits and vegetables remained up about 17% over 2019 but could not match their 2020 performance.
Source: IRI Integrated Fresh, Total US, MULO, % dollar growth vs. 1 and 2 years ago
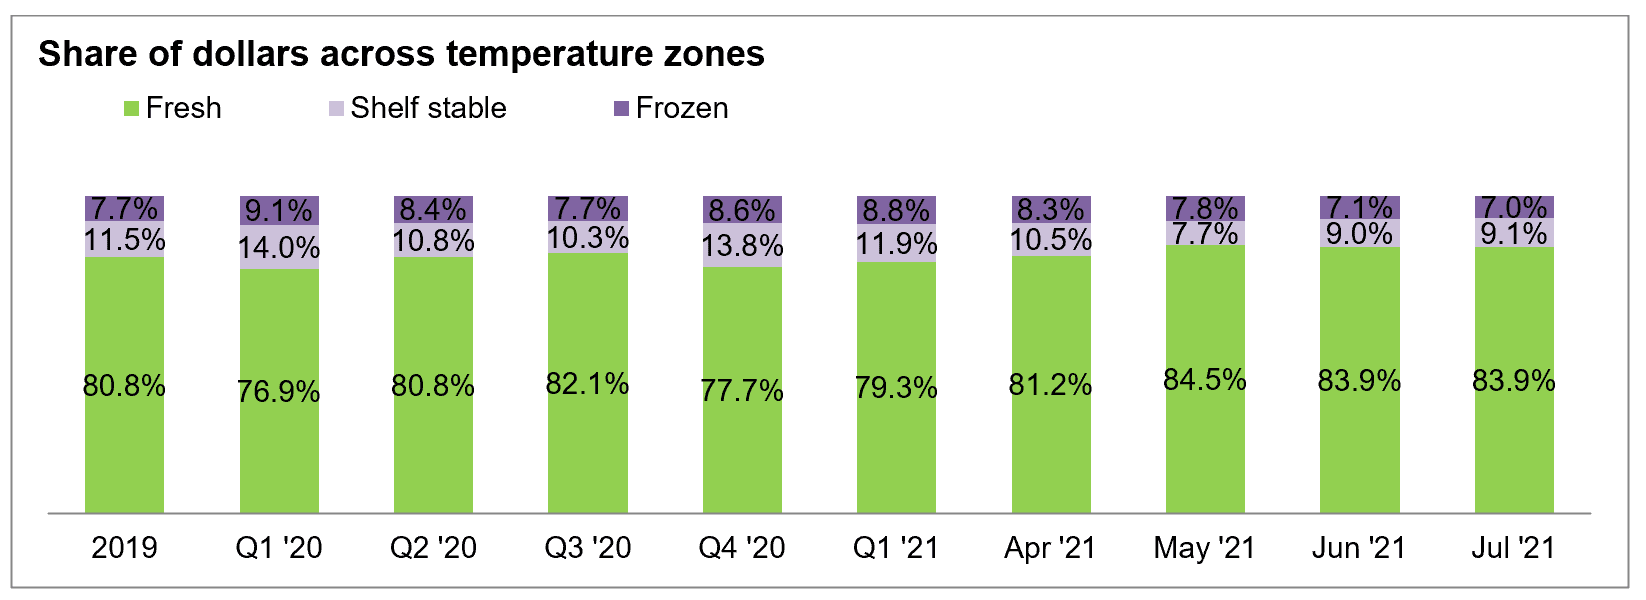
“The fresh share of total fruit and vegetable dollars across the store remained unchanged at 83.9% in July 2021,” said Watson. “Frozen fruit and vegetable sales represented the smallest share since 2019, at 7.0%. However, inflation has been much lower in frozen foods than in fresh so at least some of this is price related. That said, the increase in in-store trips favors fresh fruit, given its impulse nature. To date, fresh produce purchases, especially fruit, still lag center-store penetration in online trips.”
Source: IRI Integrated Fresh, Total U.S., MULO, % change vs. YA
Fresh Produce Dollars versus Volume
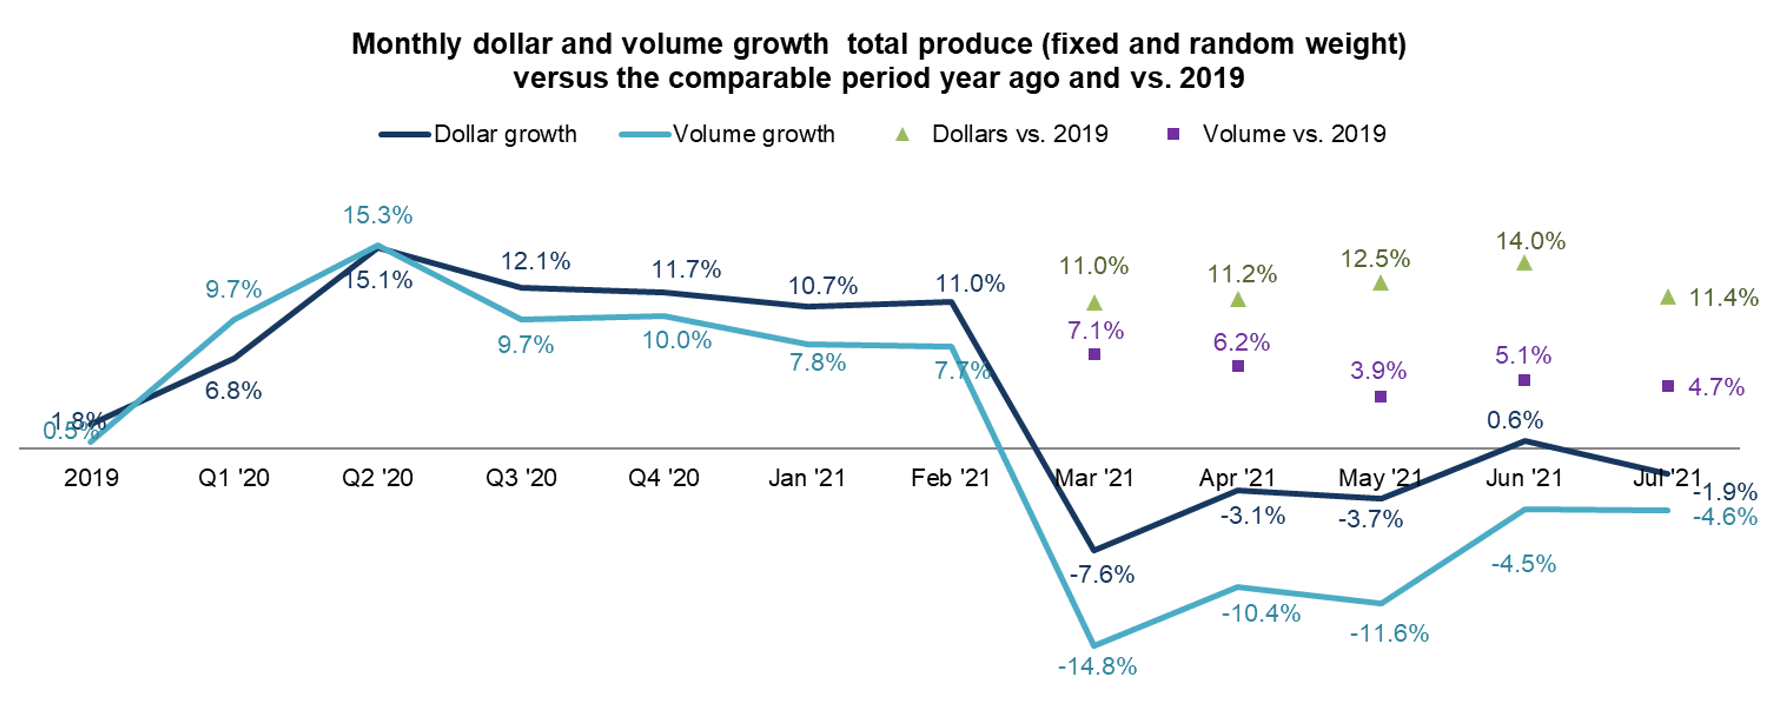
Early on in the pandemic, fresh produce experienced deflation with volume outpacing dollar growth, though both experienced record highs. Deflation switched to inflation starting in the third quarter of 2020 and dollar gains have tracked above volume gains ever since. The gap between dollars and volume that had widened in the first six months of 2021, narrowed a bit in July. Importantly, both dollars and pound sales are tracking well ahead of 2019’s rates — meaning more fresh produce is being sold now than pre-pandemic.
Source: IRI Integrated Fresh, Total U.S., MULO, 1 month % change vs. YA and vs. 2019 for March and April
“Comparing 2021 vegetable pound sales versus the pre-pandemic 2019 normal is particularly impressive,” said Watson. “Free and clear of the effect of inflation, it shows that U.S. retailers sold 6.5% more pounds of vegetables in July 2021 than the same month in 2019. Retailers sold an additional 3.6% pounds of fruit. That means there is still a lot more product moving through the system today.”
Source: IRI Integrated Fresh, Total U.S., MULO, % change vs. YA
Fresh Fruit Sales in July
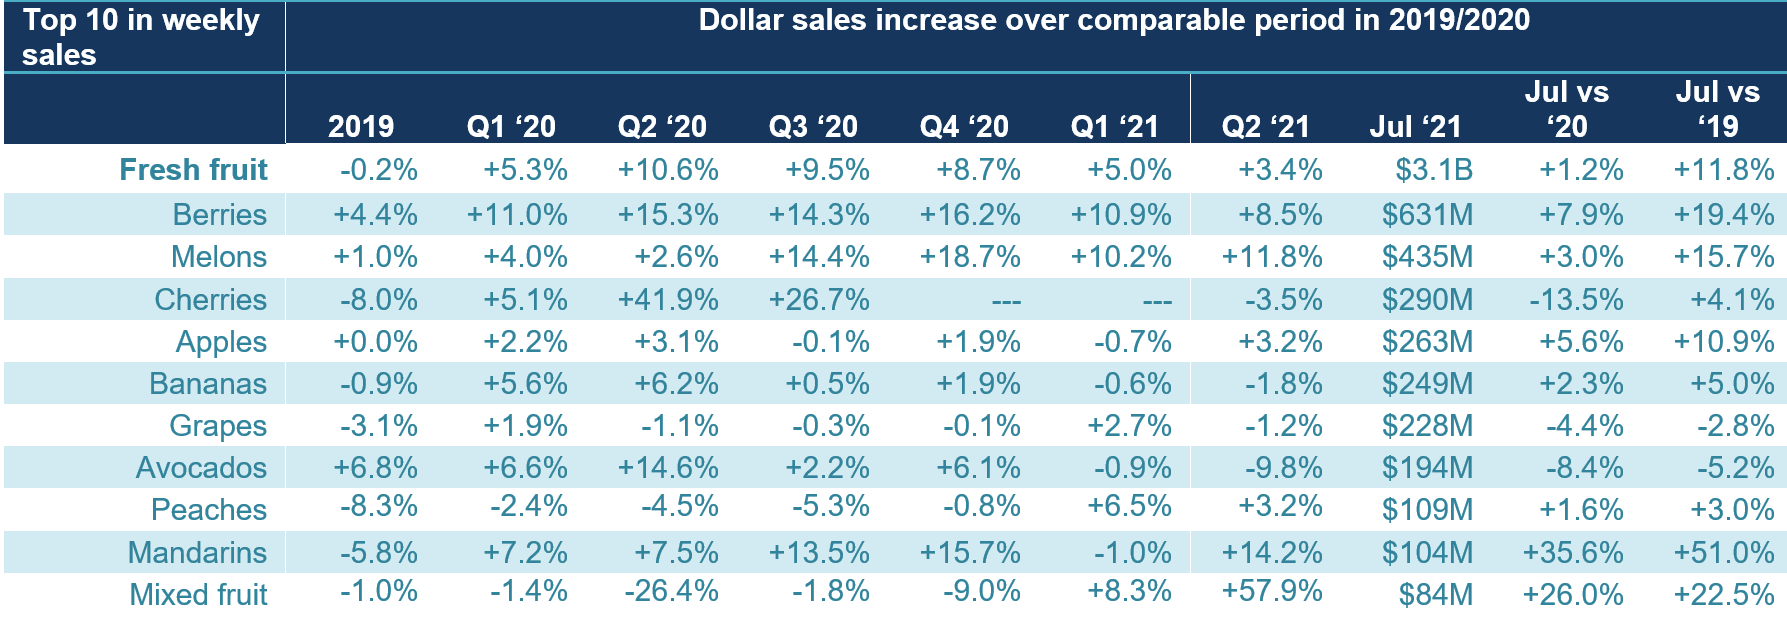
“Cherries moved into the top 3 biggest sellers in the month of July,” said Parker. “Importantly, all but three fruits managed to improve sales year-over-year in July and mandarins and mixed fruit grew sales by double digits. Deflation in avocados has been pulling sales down for a while, even though engagement and volume sales are strong.”
Berries, apples, bananas and grapes have been steady top 10 sellers, but mandarins, peaches, cherries and mixed fruit are all relative newcomers. Cherries and peaches tend to have short selling seasons and mandarins replaced oranges to represent citrus fruits.
Source: IRI Integrated Fresh, Total U.S., MULO, % change vs. YA
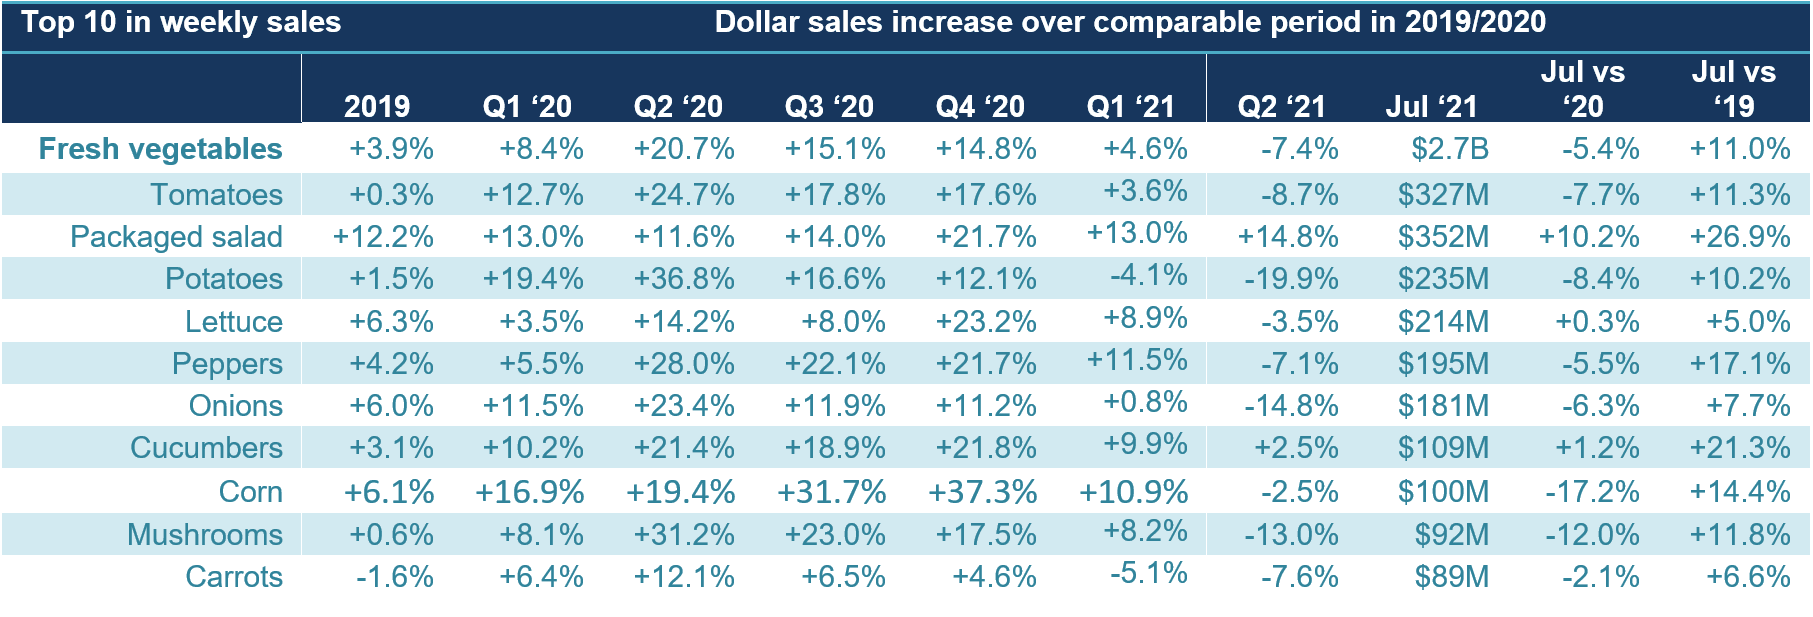
Fresh Vegetables Sales in June
“Fruit sales were actually higher than vegetables in July,” said Watson. “The top 10 sellers remained unchanged and reflect the typical summer strengths in tomatoes, lettuce, peppers, onions, corn and more. But one area stands out as being exceptional, and that is salad kits. Despite double-digit growth throughout most of 2020, the sales of packaged salads are still up 10.2% versus year ago and more than double that versus 2019. This could have a bit of an impact on salad bar sales, though more frequent in-store trips favor strong deli-prepared sales much like it does fruit.”
Source: IRI Integrated Fresh, Total U.S., MULO, % change vs. YA
Absolute Dollar Gains
“Nine out of the 10 July growth leaders are fruit,” said Parker. “Kiwis are a newcomer to the top 10 with 19% year-over-year growth, adding an additional $3.0 million in sales. But the incredible strength for berries continues as a top three seller all of 2020, yet growing sales at a rate of nearly 8% year-on-year.”
Source: IRI Integrated Fresh, Total U.S., MULO
Perishables Performance
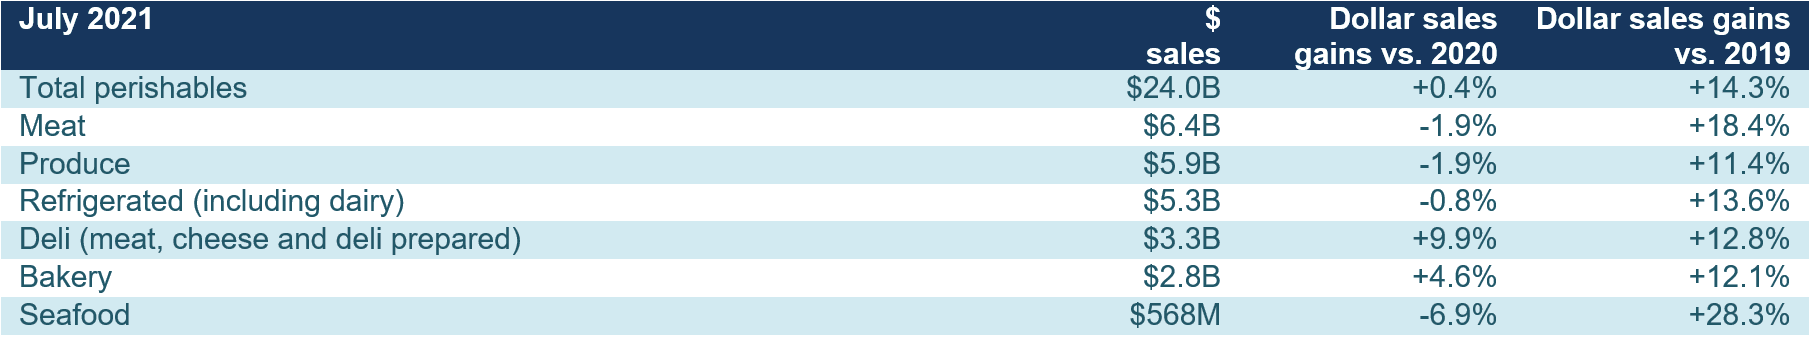
A look across fresh foods departments for the four July weeks shows mixed year-over-year performance. Departments with strong 2020 sales results have a much tougher roadmap to stay ahead of prior year sales. This is the case for meat, seafood and refrigerated (including dairy). On the other hand, departments that struggled during the early pandemic months, including fresh bakery and deli prepared, are now tracking ahead.
Source: IRI Integrated Fresh, Total U.S., MULO, % change vs. YA, fixed and random weight items combined into department views
Floral
Floral ended calendar year 2020 up 3.9%, but sales have been very strong ever since the third quarter of 2020. The first and second quarter of 2021 have brought gains upwards of 25%, for a year-to-date increase of 26.5%. Independence Day week generated $103 million in sales, which was 11.9% higher than 2020 as people are resuming social gatherings and perhaps bringing some flowers along.
What’s Next?
August will be an interesting test case relative to the normalization of the marketplace thus far in 2021 as the Delta variant of the COVID-19 virus is prompting an increase of new COVID cases across the country. In the past few months, the normalization of shopping patterns including a return to in-store shopping, spending more time as well as on-premise restaurant dining, has been largely driven by vaccinated Americans. The August sales and survey results relative to retail and foodservice sales will interesting to watch as we close out the summer.
As of yet, most school districts are planning to resume in-person education. Consumers are expecting back-to-school spending to be big this year. The July IRI survey found that 51% of parents expect they will spend more this year than they did last year in addition to 38% believing they will spend about the same.
Of parents shopping for back-to-school items, 47% believe they will do most or all in-store and 38% expect they will spend equally in-store and online. That provides grocery retailers with an important opportunity to draw people to the store as they prepare for the upcoming school year.
The next report, covering August, will be released in mid-September. We encourage you to contact Joe Watson, PMA’s Vice President of Membership and Engagement, at jwatson@pma.com with any questions or concerns. Please recognize the continued dedication of the entire grocery and produce supply chains, from farm to retailer. #produce #joyoffresh #SupermarketSuperHeroes.
The battle for the food dollar is intensifying as shoppers are ramping up their engagement with restaurants.
“Whereas in May, the IRI survey of primary shoppers found that 40% had dined inside at a restaurant, come July this share has risen to 50%. At the same time, restaurant takeout (53% of shoppers) and home delivery (21%) are unchanged from their May levels,” says Jonna Parker, Team Lead, Fresh with IRI. “This coincides with steady fall in the share of meals prepared at home, which shoppers estimate to be an average of 76.6% across meal occasions in July 2021. This is down slightly from 82.0% in July 2020.”
(click to enlarge)
Behind the quick rise in on-premise dining are summer road trips, making up for all the missed celebrations with friends and family, cooking fatigue but also a return to working away from home. In January of 2021, 45% of shoppers indicated they would not or rarely work from home. Come July 2021, this share has risen to 55%. That means more time pressure for breakfast and dinner as commuting resumes, in addition to more lunches consumed away from home.
Shoppers are not only returning to restaurants but also to the grocery store for in-person trips. In November 2020, 62% indicated they would do all their shopping in store in the coming four weeks. The July 2021 IRI survey found that 71% planned to exclusively shop in-store. The return to in-store shopping is confirmed by the trendline documenting the nature of shoppers’ most recent trip. The in-store trip share was as low as 81% in October 2020 and has increased to 87% in the July survey — taking online trips down to 13%. In addition to more in-store trips, the average time spent in the store rose to a 12-month high at an average of 32.3 minutes.
Trips and Basket Size
2020 had many fewer in-store trips but a highly elevated basket size when people did shop. Come March, that picture reversed. Compared to year ago, total food and beverage trips are trending well ahead of 2020 levels whereas the spend per trip has dropped below the 2020 record levels.
Source: IRI, household panel, all outlets, total CPG 12/13/2020 through 7/25/2021 versus YA
In this vastly different and ever-changing marketplace, 210 Analytics, IRI and the Produce Marketing Association (PMA) continue their partnership to bring an in-depth understanding of how fresh produce performed relative to 2020 and 2019.
Food Inflation
Food inflation has become a big topic of discussion in recent weeks and, this year, produce prices are not the exception like we saw in 2020. IRI-measured price inflation (i.e. dollars divided by volume sold at retail) shows that prices continued to rise over and above their elevated 2020 levels for total food and beverages. The price index for fresh produce sat higher than total food and beverages for all May and June 2021 weeks. Come July, inflation (price paid per pound at retail) in fresh produce dropped slightly below the rest of the store. The July numbers from the Bureau of Labor Statistics (BLS) are scheduled to be released on August 11, 2021.
Source: IRI, Integrated Fresh Total US, MULO, inflation index vs. YAGO
Week-by-Week July Sales
Despite many more Americans celebrating Independence Day with gatherings this year than last, sales could not quite match the 2020 levels. At $1.6 billion, the Fourth of July week fell short 1.4% versus 2020, but increased 10.8% versus the pre-pandemic normal of 2019.
Source: IRI, Integrated Fresh, Total US, MULO, $ sales June
Combined, the four July weeks generated $5.9 billion, which was down about 2% year-over-year.
Fresh produce generated $5.9 billion in sales during the four July 2021 weeks. This is up $97 million from the four June 2021 weeks. Fresh fruit drove all of the gain, with year-over year growth of +1.2% versus -5.4% for vegetables.
“While both fruit and vegetables were up about 11% versus July 2019, fruit is having the better year-over-year performance,” said Joe Watson, VP of Membership and Engagement for the Produce Marketing Association (PMA). “The difference is the outstanding performance of vegetables in 2020, which means a tougher road for growth this year. Additionally, fruit has experienced slightly higher inflation thus far in 2021 than vegetables, which boosts dollar sales gains.”
Source: IRI Integrated Fresh, Total U.S., MULO, % change vs. YA
Watson is referring to the 5.8% increase in the price per pound for fresh produce since the start of 2021 versus the same period in 2020. The increase in the average price per pound for fruit has increased 7.6% during this period, versus 4.3% for vegetables.
Source: IRI, Integrated Fresh, Total US, MULO, average price per volume and % gain versus YA and 2YA
Fresh Share
In addition to year-over-year growth in fresh fruit, shelf-stable fruit also gained, at +1.7%. Frozen fruits and vegetables remained up about 17% over 2019 but could not match their 2020 performance.
Source: IRI Integrated Fresh, Total US, MULO, % dollar growth vs. 1 and 2 years ago
“The fresh share of total fruit and vegetable dollars across the store remained unchanged at 83.9% in July 2021,” said Watson. “Frozen fruit and vegetable sales represented the smallest share since 2019, at 7.0%. However, inflation has been much lower in frozen foods than in fresh so at least some of this is price related. That said, the increase in in-store trips favors fresh fruit, given its impulse nature. To date, fresh produce purchases, especially fruit, still lag center-store penetration in online trips.”
Source: IRI Integrated Fresh, Total U.S., MULO, % change vs. YA
Fresh Produce Dollars versus Volume
Early on in the pandemic, fresh produce experienced deflation with volume outpacing dollar growth, though both experienced record highs. Deflation switched to inflation starting in the third quarter of 2020 and dollar gains have tracked above volume gains ever since. The gap between dollars and volume that had widened in the first six months of 2021, narrowed a bit in July. Importantly, both dollars and pound sales are tracking well ahead of 2019’s rates — meaning more fresh produce is being sold now than pre-pandemic.
Source: IRI Integrated Fresh, Total U.S., MULO, 1 month % change vs. YA and vs. 2019 for March and April
“Comparing 2021 vegetable pound sales versus the pre-pandemic 2019 normal is particularly impressive,” said Watson. “Free and clear of the effect of inflation, it shows that U.S. retailers sold 6.5% more pounds of vegetables in July 2021 than the same month in 2019. Retailers sold an additional 3.6% pounds of fruit. That means there is still a lot more product moving through the system today.”
Source: IRI Integrated Fresh, Total U.S., MULO, % change vs. YA
Fresh Fruit Sales in July
“Cherries moved into the top 3 biggest sellers in the month of July,” said Parker. “Importantly, all but three fruits managed to improve sales year-over-year in July and mandarins and mixed fruit grew sales by double digits. Deflation in avocados has been pulling sales down for a while, even though engagement and volume sales are strong.”
Berries, apples, bananas and grapes have been steady top 10 sellers, but mandarins, peaches, cherries and mixed fruit are all relative newcomers. Cherries and peaches tend to have short selling seasons and mandarins replaced oranges to represent citrus fruits.
Source: IRI Integrated Fresh, Total U.S., MULO, % change vs. YA
Fresh Vegetables Sales in June
“Fruit sales were actually higher than vegetables in July,” said Watson. “The top 10 sellers remained unchanged and reflect the typical summer strengths in tomatoes, lettuce, peppers, onions, corn and more. But one area stands out as being exceptional, and that is salad kits. Despite double-digit growth throughout most of 2020, the sales of packaged salads are still up 10.2% versus year ago and more than double that versus 2019. This could have a bit of an impact on salad bar sales, though more frequent in-store trips favor strong deli-prepared sales much like it does fruit.”
Source: IRI Integrated Fresh, Total U.S., MULO, % change vs. YA
Absolute Dollar Gains
“Nine out of the 10 July growth leaders are fruit,” said Parker. “Kiwis are a newcomer to the top 10 with 19% year-over-year growth, adding an additional $3.0 million in sales. But the incredible strength for berries continues as a top three seller all of 2020, yet growing sales at a rate of nearly 8% year-on-year.”
Source: IRI Integrated Fresh, Total U.S., MULO
Perishables Performance
A look across fresh foods departments for the four July weeks shows mixed year-over-year performance. Departments with strong 2020 sales results have a much tougher roadmap to stay ahead of prior year sales. This is the case for meat, seafood and refrigerated (including dairy). On the other hand, departments that struggled during the early pandemic months, including fresh bakery and deli prepared, are now tracking ahead.
Source: IRI Integrated Fresh, Total U.S., MULO, % change vs. YA, fixed and random weight items combined into department views
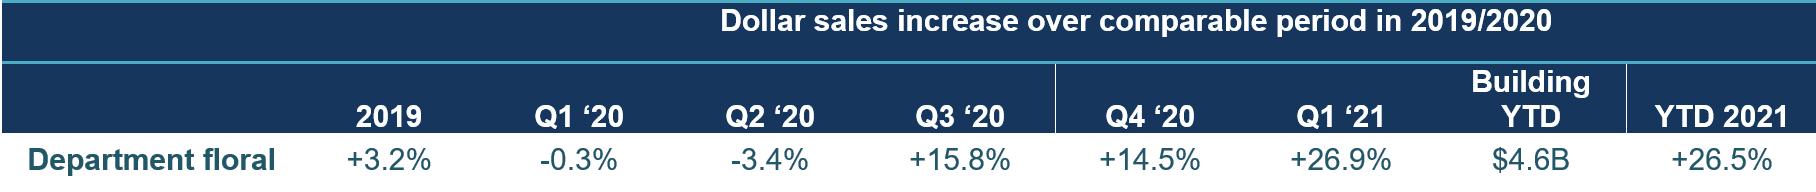
Floral
Floral ended calendar year 2020 up 3.9%, but sales have been very strong ever since the third quarter of 2020. The first and second quarter of 2021 have brought gains upwards of 25%, for a year-to-date increase of 26.5%. Independence Day week generated $103 million in sales, which was 11.9% higher than 2020 as people are resuming social gatherings and perhaps bringing some flowers along.
What’s Next?
August will be an interesting test case relative to the normalization of the marketplace thus far in 2021 as the Delta variant of the COVID-19 virus is prompting an increase of new COVID cases across the country. In the past few months, the normalization of shopping patterns including a return to in-store shopping, spending more time as well as on-premise restaurant dining, has been largely driven by vaccinated Americans. The August sales and survey results relative to retail and foodservice sales will interesting to watch as we close out the summer.
As of yet, most school districts are planning to resume in-person education. Consumers are expecting back-to-school spending to be big this year. The July IRI survey found that 51% of parents expect they will spend more this year than they did last year in addition to 38% believing they will spend about the same.
Of parents shopping for back-to-school items, 47% believe they will do most or all in-store and 38% expect they will spend equally in-store and online. That provides grocery retailers with an important opportunity to draw people to the store as they prepare for the upcoming school year.
The next report, covering August, will be released in mid-September. We encourage you to contact Joe Watson, PMA’s Vice President of Membership and Engagement, at jwatson@pma.com with any questions or concerns. Please recognize the continued dedication of the entire grocery and produce supply chains, from farm to retailer. #produce #joyoffresh #SupermarketSuperHeroes.