
Interpreting credit scores and score behavior is reliant on their underlying dynamics—and this is trading performance. If a company performs well, its Score and Rating will be of lower risk.
On the other hand, when a company is performing at an unsatisfactory level, the rating and score will reflect greater risk, with the score often predicting the potential for delinquency or default months in advance. Scores range from 500 to 1000, with 500 being high risk and 1000 being low risk. Table 5 offers a breakdown of average Blue Book Scores since 2015.
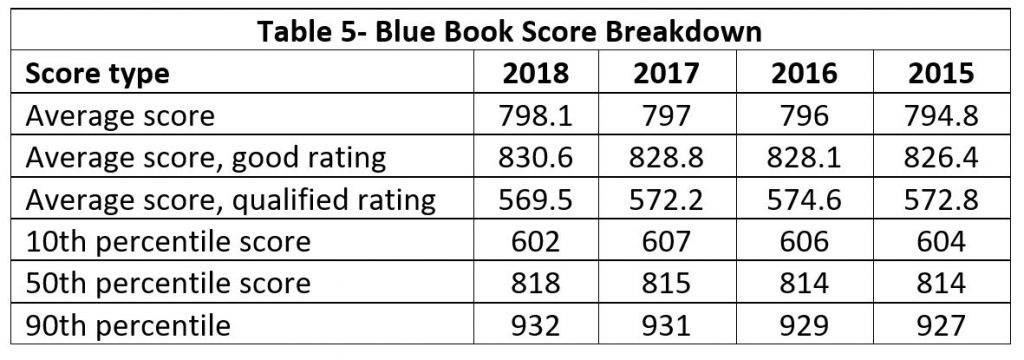
Industry scoring behavior is relatively consistent from year to year as the table demonstrates. A “good” Blue Book Rating is one that results from overall satisfactory trading and pay practice experiences. A “qualified” Blue Book Rating is one that results when overall performance is not meeting industry trading standards.
In looking at U.S. regional scores for 2018 Blue Book listed companies, there are some subtle differences. The lowest average Blue Book score is in the Southwest, comparable to the Northeast’s average of 797. Next come both the West and Southeast at an average 801, and the region with the highest average score is the Midwest, at 813.
In terms of global scoring for Blue Book listed companies, the overall international category is the lowest at 735 for the average, followed by Canada at 764, Mexico at 778, and the United States at 801.
In considering score risk within Blue Book’s listed companies by supply chain category, including all domestic and international businesses, the average score was 780 for those listed as wholesale or foodservice; 791 for brokers and/or distributors; 800 for grower-shippers; 818 for retail; and the highest was 821 for those listed in transportation.
Average scores for each region and business type fall into the moderate low to low risk category. As reflected in the average score/percentile table (Table 6), scores as an average and for companies as a whole have a higher probability of staying with their respective scoring band than going up or down.
The table reflects the likelihood a score will transition from one score band to another over a one-year period. The ‘out’ designation denotes companies that have been deleted from their score band for various reasons, including but not limited to out-of-business status.
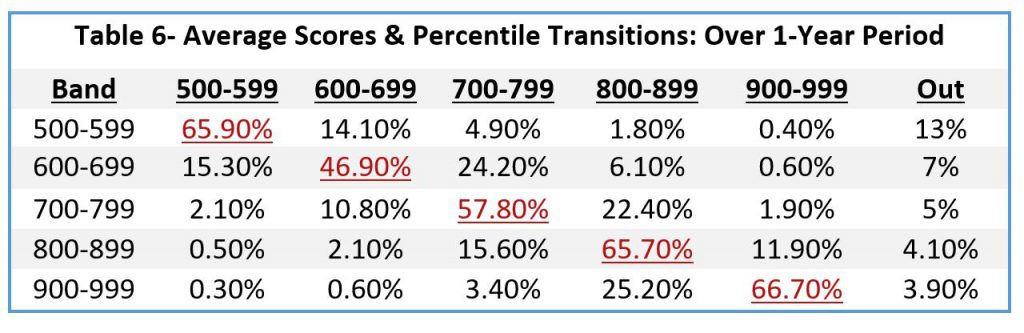
As reflected in the transition table, scores tend to stay within the current score band. And when they do not, this would suggest their underlying dynamics are changing, such as pay performance.
This is an excerpt from the most recent Produce Blueprints quarterly journal. Click here to read the full article.
