
Avocado prices have been on the rise with average terminal market annual prices for 2015 at $2.72 per kilogram, 2016 at $3.13, and 2017 climbing to $3.82 per kilogram, representing a 40 percent increase from 2015 to 2017.
Average annual prices have increased year-over-year from 2012 to 2015 by 7 percent, though 2012 to 2013 saw a lower growth rate than 2014 to 2015 at only 1 percent. To better understand this price evolution, it is best to study the relationship between price and supply. Annual avocado production can be divided into two distinct seasons: the months when Mexican production is high, from November to May, and when production is low, from June to October.
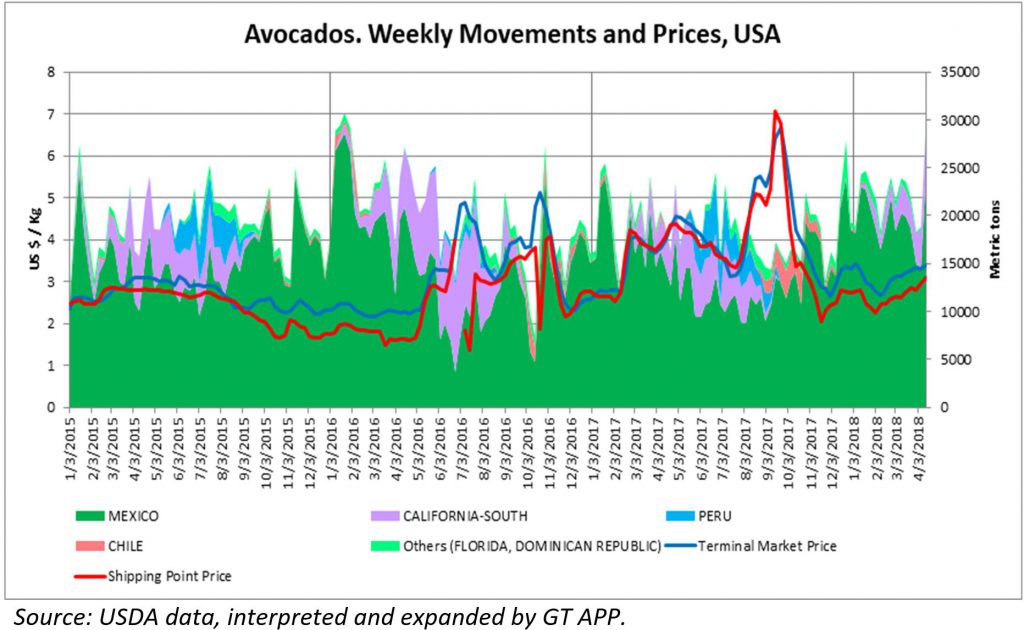
Prices were stable for 2015, with average November to May prices reaching $2.78 per kilogram. For 2016, prices were affected by short supply, with average prices from November 2015 to May 2016 falling to $2.51 per kilogram, then surging to $3.98 per kilogram from June to October 2016 (with a high of $4.85 per kilogram in July), an increase of 58 percent when monthly average production fell.
For November 2016 to May 2017 prices remained high at $3.57 per kilogram due to more stable production. For the June to October period, monthly average prices increased to $4.63 per kilogram, representing a 30 percent increase with average monthly production of 78,740 metric tons that came in short—due to increasing demand and lower than expected supply from Southern California.
Prices reached $6.82 per kilogram the week of September 23, 2017 due to the shortfall. From November 2017 to April 2018, average monthly prices shrank back to $3.18 per kilogram due to higher supply with an average of 84,223 metric tons, a 31 percent decrease in price due to a 7 percent increase in production.
Shipping and entry point trends
Shipping point prices portray seasonal ups and downs, as evidenced by lower prices in the months of December and January when Mexico has high production. In 2015, Mexican avocados arriving in Texas via truck hit their lowest average shipping price in October at $1.80 per kilogram and their highest shipping price in July at $2.80 per kilogram.
For the next year, 2016, the lowest average shipping point price was in March at $1.55 per kilogram and the highest was July’s $4.13 per kilogram, 48 percent higher than the top price the previous year. Prices in 2017 were more stable with the lowest price at $2.29 in April and the highest at $2.60 per kilogram in March, a 14 percent price difference.
In the first quarter of 2018 the lowest price was $2.27 per kilogram. Other shipping points of interest are Philadelphia and New York, where most of Peru’s exports arrive: in 2015 the average price was $2.50 per kilogram, but rose 51 percent in 2016 due to reduced production in Southern California, climbing to an average price of $3.77 per kilogram. For 2017, this fell to an average of $2.71 per kilogram.
This is an excerpt from the most recent Produce Blueprints quarterly journal. Click here to read the full article.
