
The July Marketplace
July was another month of single-digit food and beverage inflation for U.S. retail.
While the Circana (formerly IRI) sales numbers showed little to no response or improvement in volume sales across most departments, fresh produce was a powerful exception, according to Jonna Parker, Team Lead Fresh with Circana.
“Total food and beverage sales in July reflected the now familiar patterns of increased dollars but decreased unit and pound sales,” she said. Fresh produce was one of the rare exceptions that grew dollars, units and volume in July — the second time this year that produce improved its pound performance over year-ago levels.”
Circana’s household engagement insights show the reason behind the overall down performance in food and beverages. Hyper-focused on sales specials, consumers are shopping more often and across more stores. At the same time, inflation continues to provide a small boost to the average shopping ring for most departments. However, the increase in the average basket is below the rate of inflation and has been for a while.
This is caused by consumers balancing their budgets by buying on deal, switching to private brands, finding smaller packages, and above all else, buying less altogether.
“The average number of items bought on each trip has been on a downward trajectory for more than two years,” Parker explained. While the numbers are a little different for each department, the patterns are very similar across most — making produce a notable exception this month.”
Circana’s July survey of 1,000+ primary grocery shoppers sheds further light on consumers’ reactions.
- Special occasions and holidays still have the ability to boost spending. July Fourth celebrations provide a good example: 33% of consumers celebrated with friends and family and 25% organized barbeques or cookouts. In all, 58% of consumers did something out of the ordinary during the holiday weekend, with similar expectations for Labor Day. “The holiday effect was strong for fresh produce,” said Joe Watson, IFPA’s VP of Retail, Foodservice and Wholesale. “The holiday week generated $1.643 billion versus $1.503 for the last week of July. Additionally, pound sales increased 4.5% during the week of the Fourth versus flat results during the remaining July weeks. Produce sales benefitted from investment in price plus retailers stepping up efforts in produce’s role in grilling, from campaigns on ‘how to grill veggies’ to on-pack ‘great for the grill’ stickers on a variety of produce items.”
- The strength of traditional holidays means opportunity in inventing your own. One of the best-in-class examples is Amazon’s Prime Day. The July Circana survey found that 82% of consumers are familiar with Amazon Prime Day. Among Prime members (64% of consumers), 58% planned to shop for items such as apparel (25%), electronics (24%), personal/beauty care (22%) as well as items in pet, paper products, foods and beverages. “Numbers like these highlight the massive opportunity to celebrate anything from National Mango Day to Earth Month,” said Watson. “Optimizing primary and secondary holidays while inventing your own can be a great way to prompt unplanned spending, introducing people to new items and drive a point of differentiation for your store.”
- While looking to save on restaurant-prepared meals, consumers still enjoy the occasional help. In July, 77.3% of meals were home-cooked. This is lower than in the winter months, but typical of summer patterns. When enjoying restaurant food, fewer people ate on premise (49%) in July than those ordering takeout (45%) and/or delivery (16%). This is a key opportunity for retail to be the “plus one” on items such as side salads or cut fruit.
- Although the rate of inflation has moderated, 89% of consumers still perceive grocery prices as being much (60%) or somewhat higher (29%) when compared to last year and 95% remain concerned over their ability to afford groceries. This has 53% of consumers chasing grocery specials, 46% cutting back on non-essentials and 31% switching to private brands, coupons or switching to lower-cost brands versus what they normally buy.
The sales numbers, engagement stats and survey findings all illustrate a complex marketplace in which consumers continue to shift their dollars across items, brands, sizes, stores and restaurants. Circana, 210 Analytics and the International Fresh Produce Association BB #:378962 team up to document the impact on sales patterns in fresh produce.
Inflation Insights
The price per unit across all foods and beverages in the Circana-measured multi-outlet stores, including supermarkets, club, mass, supercenter, drug and military, increased by 5.2% in July (the four weeks ending 7/30/2023). The high level of consumer concern lies in the cumulative effect of many months of high inflation. When comparing July 2023 to July 2020, prices have increased by 24.4%.
| Average price/unit vs. YA | 2018 | 2019 | 2020 | 2021 | 2022 | Q4 2022 | Q1 2023 | Q2 2023 | Jul 23 | |
| Total food & beverages | +1.5% | +2.0% | +5.1% | +5.4% | +12.5% | +13.5% | +11.4% | +7.2% | +5.2% | |
Source: Circana, Integrated Fresh, Total US, MULO, average price per unit and % gain versus YA
Retailers invested in fruit prices in July. The average price per pound for fruit decreased by 1.0% over year ago levels. Vegetables did sustain small price increases in the tune of 2.4% versus July 2022.
| Price per volume (lbs) | Price/volume | Change vs. YA | Change vs. 3YA |
| Total fresh produce July 2023 | $1.78 | +0.5% | +14.1% |
| Total fresh produce latest 52 weeks thru 7/30/23 | $1.86 | +4.7% | +18.3% |
| Fresh fruit July 2023 | $1.57 | -1.0% | +15.8% |
| Fresh fruit latest 52 weeks thru 7/30/23 | $1.71 | +3.1% | +20.4% |
| Fresh vegetables July 2023 | $2.05 | +2.4% | +12.7% |
| Fresh vegetables latest 52 weeks thru 7/30/23 | $1.99 | +6.3% | +16.3% |
Source: Circana, Integrated Fresh, Total US, MULO, average price per volume and % gain versus YA and 3YA
July 2023 Sales
The four July 2023 weeks generated $59 billion total food and beverage sales, up 3.1% over July 2022, though unit sales trailed behind. Perishables, including produce, seafood, meat, bakery and deli, had a below-average dollar growth performance (+0.9%) but this was entirely prompted by the different levels of inflation as illustrated by the better-than-average unit performance (-0.7% versus -3.1% for center-store grocery).
| July 2023 % change | Latest 52 weeks % change | ||||||||
| Dollar size | Dollars vs. YA | Dollars vs. 2YA | Units vs. YA | Units vs. 2YA | Dollars vs. YA | Dollars vs. 2YA | Units vs. YA | Units vs. 2YA | |
| Total food & beverages | $59B | +3.1% | +13.3% | -2.0% | -5.3% | +7.6% | +15.0% | -3.0% | -5.4% |
| Center-store grocery | $29B | +5.5% | +17.6% | -3.1% | -6.6% | +10.0% | +18.9% | -3.7% | -7.3% |
| Total perishables | $26B | +0.9% | +10.5% | -0.7% | -3.7% | +6.0% | +13.3% | -2.0% | -4.5% |
Source: Circana, Integrated Fresh, Total US, MULO
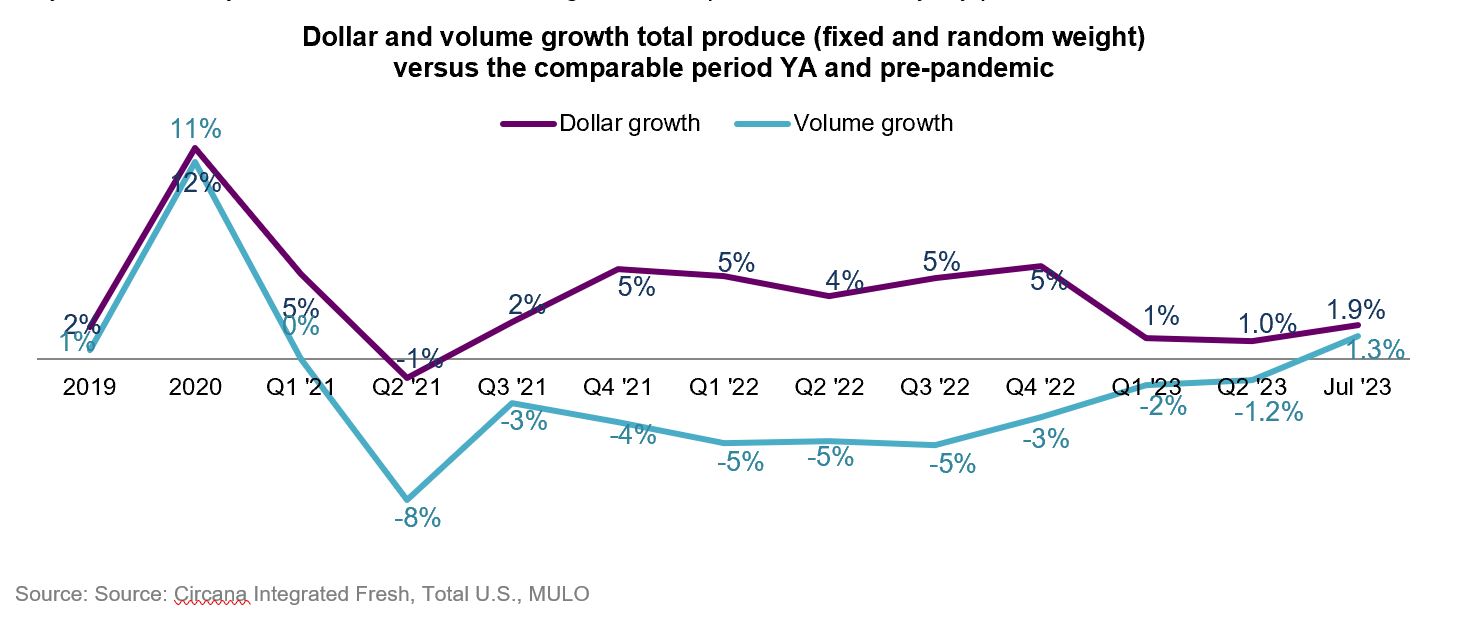
July 2023 fresh produce sales reached $6.2 billion. “While the dollar growth is slowing, it is good to see units and volume making a comeback,” Watson noted. “The fresh produce performance is outpacing that of total food and beverages as well as frozen and canned.”
| July 2023 % change | Latest 52 weeks % change | ||||||||
| Dollar size | Dollars vs. YA | Dollars vs. 2YA | Units vs. YA | Units vs. 2YA | Dollars vs. YA | Dollars vs. 2YA | Units vs. YA | Units vs. 2YA | |
| Total fresh produce | $6.2B | +1.9% | +8.4% | +1.0% | -2.9% | +2.9% | +7.9% | -0.9% | -4.3% |
| Fresh fruit | $3.3B | +0.6% | +7.7% | +1.9% | -2.2% | +1.3% | +9.7% | +0.2% | -1.2% |
| Fresh vegetables | $2.9B | +3.2% | +9.1% | +0.2% | -3.4% | +4.6% | +6.1% | -1.8% | -6.7% |
Source: Circana, Integrated Fresh, Total US, MULO, % change vs. year ago.
| Produce department | Dollar sales | $ vs. YA | lbs vs. YA |
| July 2023 | $6.2B | +1.9% | +1.3% |
| w.e. 7/9/2023 | $1.643B | +5.6% | +4.5% |
| w.e. 7/16/2023 | $1.555B | +2.3% | +0.4% |
| w.e. 7/23/2023 | $1.532B | -0.2% | -0.1% |
| w.e. 7/30/2023 | $1.503B | -0.3% | +0.2% |
| Source: Circana, Integrated Fresh, Total US, MULO |
Weekly fresh produce sales averaged between $1.5 and $1.6 billion, with a slight bump for the holiday week. Pounds grew 4.5% over year ago levels during the holiday week and the remaining weeks were right around year-ago levels. “Summer is the strong season for fresh produce as locally-grown and seasonal items come into the marketplace at a much greater rate,” Parker pointed out. “Our survey work shows that seasonal and local are the top two claims for prompting an unplanned purchase. Eye-catching displays and story-telling can help elevate the fresh produce performance.”
Total Store Comparison
“While fresh produce prices experienced modest inflation in June 2023, frozen and shelf-stable fruit and vegetable prices increased significantly,” Watson commented. “In turn, unit sales for frozen and shelf-stable fruit and vegetables were down substantially versus the 1% increase for fresh.”
| July 2023 | Dollar sales | Share of dollars | Dollar sales gains vs. YA | Unit gains vs. YA | Average price per pound | Increase price vs. YA |
| Fresh produce department | $6.2B | 82.0% | +1.9% | +1.0% | $1.78 | +0.5% |
| Frozen fruits and vegetables | $630M | 8.3% | +13.8% | -4.5% | $2.36 | +17.6% |
| Shelf stable fruits | $320M | 4.2% | +0.9% | -7.5% | $2.79 | +9.6% |
| Shelf stable vegetables | $412M | 5.4% | +4.4% | -3.8% | $1.47 | +8.3% |
Source: Circana Integrated Fresh, Total US, MULO
Fresh Produce Dollars versus Volume
Produce dollar sales growth has been in the black ever since lapping the massive pandemic sales spikes in the second quarter of 2021. Produce pounds, on the other hand, have mostly tracked behind as shoppers are savvy in their ways to save, cutting back on the amounts purchased. Volume sales exceeded year-ago levels for the first time in April. July was the second time this year when produce pounds moved above year ago levels. The question is whether the strong July Fourth holiday sales are sustainable in August and September or if everyday patterns will take back over.
The investment in price on the fruit side paid off in large volume gains of 1.7% over July 2022. Vegetables also experienced pound growth, but at a more moderate rate of 0.8%.
| Growth over comparable period | ||||||||||||||||
| 2019 | 2020 | 2021 | Q1 22 | Q2 22 | Q3 22 | Q4 22 | Q1 23 | Q2 23 | Jul 23 | Vs. YA | Vs. 2YA | |||||
| Fruit | ||||||||||||||||
| Dollars | +0% | +9% | +6.5% | +10% | +4% | +4.6% | +1.3% | -1.2% | +0.0% | $3.3B | +0.6% | +7.7% | ||||
| Volume | -1% | +9% | -1.9% | -4% | -5% | -5.0% | -1.8% | -0.7% | -1.7% | 2.1B | +1.7% | -2.6% | ||||
| Vegetables | ||||||||||||||||
| Dollars | +4% | +15% | -1.2% | +0% | +3% | +4.8% | +6.8% | +3.5% | +2.1% | $2.9B | +3.2% | +9.1% | ||||
| Volume | +2% | +14% | -5.3% | -6% | -5% | -4.7% | -1.4% | -2.5% | -0.4% | 1.4B | +0.8% | -2.2% | ||||
Source: Circana Integrated Fresh, Total U.S., MULO
Fresh Fruit Sales
| Top 10 in sales | July 2023 | ||||
| Type | $ sales | $ vs. YA | Lbs vs. YA | ||
| Fresh fruit | $3.3B | +0.6% | +1.7% | ||
| Berries | $679M | +9.2% | +6.0% | ||
| Melons | $482M | +6.3% | +5.1% | ||
| Apples | $279M | +0.4% | -3.9% | ||
| Cherries | $261M | -13.2% | +25.0% | ||
| Bananas | $258M | +0.8% | -1.6% | ||
| Grapes | $255M | -5.2% | -8.5% | ||
| Avocados | $194M | -10.8% | +1.1% | ||
| Peaches | $129M | -7.7% | -21.0% | ||
| Mandarins | $93M | +7.9% | +10.2% | ||
| Pineapples | $89M | +4.9% | -6.1% | ||
“Berries’ July performance was yet again outstanding,” said Watson. “The four July weeks generated $679 million in berries alone with substantial dollar and pound gains. Seasonal powerhouse cherries continued to trend in the top five with $261 million in sales, which was down in dollars, but up in pounds. The later start of promotions and investment in price is having the desired effect on demand, but the growth in pounds was unable to offset the investment in dollars. Regardless, cherries demonstrate that consumers’ appetite for seasonal items remains strong.”
Other items with increased volume sales were melons, avocados and mandarins.
| Top 10 in sales | July 2023 | |||
| Type | $ sales | $ vs. YA | Lbs vs. YA | |
| Fresh vegetables | $2.9B | +3.2% | +9.1% | |
| Tomatoes | $334M | +2.9% | +1.4% | |
| Potatoes | $301M | +12.9% | -0.5% | |
| Lettuce | $260M | +8.1% | +1.3% | |
| Salad kits | $226M | -2.3% | -2.8% | |
| Onions | $221M | -0.1% | +3.3% | |
| Peppers | $197M | +0.0% | +2.9% | |
| Cucumbers | $123M | +6.7% | +2.9% | |
| Corn | $102M | +13.1% | +9.3% | |
| Carrots | $95M | +3.5% | -0.5% | |
| Broccoli | $93M | +6.3% | -1.5% | |
Fresh Vegetables Sales
“The dollar and pound performance among the top 10 vegetable sellers was all over the board,” Parker said. “Potatoes remain a remarkable story in that pound sales remain fairly unaffected by the high inflation. Potato price inflation has slowed, but price increases continued to sit in the double digits, at 13.4%. Yet, pounds are virtually flat when compared to July 2022.
Corn, the newcomer to the top 10 in June, remained in the top 10 in July. Another seasonal powerhouse with more favorable pricing than last summer.
Source: Source: Circana Integrated Fresh, Total U.S., MULO
| Top 10 absolute | July 2023 | |||
| dollar growth | $ gain | $ sales | Lbs vs. YA | |
| Berries | +57.1$M | $679M | +6.0% | |
| Potatoes | +34.3$M | $301M | -0.5% | |
| Melons | +28.6$M | $482M | +5.1% | |
| Lettuce | +19.5$M | $260M | +1.3% | |
| Corn | +11.8$M | $102M | +9.3% | |
| Celery | +10.0$M | $67M | +0.7% | |
| Tomatoes | +9.4$M | $334M | +1.4% | |
| Cucumbers | +7.8$M | $123M | +2.9% | |
| Mandarins | +6.8$M | $93M | +10.2% | |
| Broccoli | +5.5$M | $92M | -1.5% | |
Fresh Produce Absolute Dollar Gains
Berries took back over as the top contributor to absolute dollar growth after losing the number one slot to cherries in June. In all, fruit added $19.6 million year-on-year and vegetables $89.5 million. Unlike prior months, eight commodities had positive pound growth, meaning it was demand more so than inflation that earned them their spot in the top 10 growth drivers.
Source: Circana Integrated Fresh, Total U.S., MULO
| Perimeter | July 2023 | ||||
| departments | $ sales | $ vs. YA | Units vs. YA | ||
| Meat dpt. | $6.5B | -1.2% | -2.5% | ||
| Produce dpt. | $6.2B | +1.9% | +1.0% | ||
| Dairy aisle | $5.1B | -1.9% | -0.4% | ||
| Deli dpt. | $3.6B | +3.1% | -0.1% | ||
| Bakery dpt. | $3.3B | +6.5% | -1.3% | ||
| Seafood dpt. | $483M | -4.8% | -3.2% | ||
Perishables Performance
The meat department had the highest sales in July, but sustained inflation drove the highest year-over-year gains for the bakery department. Produce had the best unit performance, whereas the seafood department decreased by 3.2%.
Source: Circana Integrated Fresh, Total U.S., MULO, fixed and random weight items combined into department views
What’s Next?
While retail inflation is moderating, foodservice price increases are accelerating on an already higher starting point. Back-to-school season is starting in some parts of the country, changing food purchasing and consumption patterns yet again. The next few months will show whether the July results are sustainable or holiday dependent.
The next report, covering August, will be released in mid-September. We also encourage you to contact Joe Watson, IFPA’s VP, Retail, Foodservice and Wholesale, at jwatson@freshproduce.com with any questions or concerns. Please recognize the continued dedication of the entire grocery and produce supply chains, from farm to retailer. #produce #joyoffresh
Date ranges:
2019: 52 weeks ending 12/28/2019
2020: 52 weeks ending 12/27/2020
2021: 52 weeks ending 12/26/2021
2022: 52 weeks ending 1/1/2023
Q4 2022: 13 weeks ending 1/1/2023
Q1 2023: 13 weeks ending 4/2/2023
Q2 2023: 13 weeks ending 7/2/2023
June 2023: 5 weeks ending 7/2/2023
July 2023: 4 weeks ending 7/30/2023
