

The June Marketplace
Special occasions and celebrations are the number one reasons for consumers to splurge a little, according to a May consumer survey by 210 Analytics.
“Our June survey of 1,000+ primary grocery shoppers confirms just that,” agreed Jonna Parker, Team Lead Fresh for Circana (formerly IRI). “Nearly seven in 10 consumers did something special for the July Fourth weekend and more than half have already made special plans for Labor Day. Cookouts, get togethers, day trips and special meals are central to both summer holidays — underscoring the opportunity for grocery retailers to deliver on memorable experiences at home.”
Other findings from the Circana survey include:
- While the rate of inflation has moderated in the past three months, 86% of consumers still perceive them as much higher (59%) or somewhat higher (27%) when compared to last year.
- The sustained increases in prices of groceries and beyond have 93% of consumers concerned. “Ever since inflation moved into the double digits in the second quarter of 2022, we have seen upwards of 90% of the population being worried about their ability to purchase groceries,” Parker added.
- In response, 82% continue to make changes to what, how much, which brand and where they are shopping for groceries. Money-saving measures continue to be focused on capitalizing on sales promotions (51%) and cutting back on non-essentials (45%). One-third also looks for coupons more often.
- Stock-up behaviors are down. Shoppers are much less concerned that items will not be available the next time they shop (12%), making concern over potentially higher prices the number one reason why 44% stock up on essentials when shopping for groceries.
- Outside of in-store signage, the grocery store app has become the number one way in which shoppers research promotions, followed by the printed circular (29%) and emails (27%). “How shoppers research specials has changed tremendously over the past few years,” said Joe Watson, IFPA’s VP of Retail, Foodservice and Wholesale. “The once mighty paper circular has fallen behind in-store signage and the app, providing many opportunities for retailers. In-store signage can make an immediate impact and drive an impulse purchase. The app can link to recipes, digital shipping lists, nutrition information, sourcing, storage tips and more.”
- Sales specials are increasingly driving the meal lineup: 36% check what is on sales before making the shopping list and 27% check deals across more than one retailer.
- Shoppers buying groceries exclusively online has crept up to 6%. This share is boosted by Gen Z/younger Millennials (8%) and older Millennials (10%) versus just 2% of Boomers.
The outside marketplace drives continued shifts in how consumers spend their dollars across retail and foodservice. Circana, 210 Analytics and the International Fresh Produce Association team up to document the impact on sales patterns in fresh produce.
Inflation Insights
The price per unit across all foods and beverages in the Circana-measured multi-outlet stores, including supermarkets, club, mass, supercenter, drug and military, increased by 6.4% in June (the five weeks ending 7/2/2023). The continued concern among consumers lies in the cumulative effect of inflation. When comparing June 2023 to June 2020, prices have increased by 23.2%. The second quarter averaged a price per unit increase of 7.2%, which was down substantially from 11.4% inflation in the first quarter of the year.
| Average price/unit vs. YA | 2018 | 2019 | 2020 | 2021 | 2022 | Q4 2022 | Q1 2023 | Q2 2023 | Jun 23 | |
| Total food & beverages | +1.5% | +2.0% | +5.1% | +5.4% | +12.5% | +13.5% | +11.4% | +7.2% | +6.4% | |
After several months of flat and lower prices, fresh produce experienced a jump in year-on-year inflation in June 2023. Fresh fruit prices increased 6.8% in comparison to June 2022. Vegetable inflation averaged 2.7% in June, which was down from the 52-week levels that averaged 6.7%.
| Price per volume (lbs) | Price/volume | Change vs. YA | Change vs. 3YA |
| Total fresh produce June 2023 | $1.78 | +5.1% | +18.4% |
| Total fresh produce latest 52 weeks thru 7/2/23 | $1.85 | +5.3% | +18.2% |
| Fresh fruit June 2023 | $1.58 | +6.8% | +23.3% |
| Fresh fruit latest 52 weeks thru 7/2/23 | $1.70 | +3.9% | +20.2% |
| Fresh vegetables June 2023 | $2.03 | +2.7% | +13.0% |
| Fresh vegetables latest 52 weeks thru 7/2/23 | $1.99 | +6.7% | +16.5% |
June 2023 Sales
The five June 2023 weeks generated $75.0 billion total food and beverage sales, up 3.0% over June 2022, though unit sales trailed behind. Perishables, including produce, seafood, meat, bakery and deli, had a below-average dollar growth performance (+0.9%) but this was entirely prompted by the different levels of inflation as illustrated by the better-than-average unit performance (-1.8% versus -4.4% for center-store grocery).
| June 2023 % change | Latest 52 weeks % change | ||||||||
| Dollar size | Dollars vs. YA | Dollars vs. 2YA | Units vs. YA | Units vs. 2YA | Dollars vs. YA | Dollars vs. 2YA | Units vs. YA | Units vs. 2YA | |
| Total food & beverages | $75.0B | +3.0% | +11.2% | -3.2% | -7.2% | +8.1% | +14.9% | -3.1% | -5.5% |
| Center-store grocery | $36.6B | +5.5% | +16.1% | -4.4% | -8.1% | +10.4% | +18.6% | -3.8% | -6.1% |
| Total perishables | $33.4B | +0.9% | +8.4% | -1.8% | -5.9% | +6.7% | +13.4% | -2.2% | -4.6% |
June 2023 fresh produce sales reached $ billion. “Both fruit and vegetables performed well in May which helped to move the 52-week numbers within 2 percentage points of year-ago levels,” Watson noted. “This is significantly better than the total food and beverage performance, as well as significantly better than fruit and vegetable counterparts in frozen and canned.”
| June 2023 % change | Latest 52 weeks % change | ||||||||
| Dollar size | Dollars vs. YA | Dollars vs. 2YA | Units vs. YA | Units vs. 2YA | Dollars vs. YA | Dollars vs. 2YA | Units vs. YA | Units vs. 2YA | |
| Total fresh produce | $7.9B | +1.6% | +4.1% | -0.6% | -6.1% | +3.2% | +7.7% | -1.4% | -4.6% |
| Fresh fruit | $4.2B | +1.3% | +2.4% | -0.4% | -6.0% | +1.7% | +9.8% | -0.5% | -1.4% |
| Fresh vegetables | $3.6B | +1.9% | +6.1% | -0.7% | -6.1% | +4.7% | +5.4% | -2.0% | -7.0% |
Weekly fresh produce sales averaged around $1.6 billion, with two bumps for the holiday weeks captured as the first (Memorial Day) and final week (July Fourth). “Summer is the strong season for fresh produce as locally-grown and seasonal items come into the marketplace at a much greater,” Parker pointed out. “Our survey work shows that seasonal and local are the top two claims for prompting an unplanned purchase. Eye-catching displays and story-telling can help elevate the fresh produce performance.”
| Produce department | Dollar sales | $ vs. YA | lbs vs. YA |
| June 2023 | $7.931B | +1.6% | -3.4% |
| w.e. 6/4/2023 | $1.660B | +0.5% | -4.2% |
| w.e. 6/11/2023 | $1.530B | +2.4% | -2.3% |
| w.e. 6/18/2023 | $1.586B | +2.0% | -5.0% |
| w.e. 6/25/2023 | $1.567B | +2.0% | -3.5% |
| w.e. 7/2/2023 | $1.588B | +1.3% | -1.7% |
Total Store Comparison
“While fresh produce prices experienced modest inflation in June 2023, frozen and shelf-stable fruit and vegetable prices increased significantly,” Watson commented. “In turn, unit sales for frozen and shelf-stable fruit and vegetables were down substantially more than those of fresh produce. While dropping back in the red is painful, fresh is performing far better than its counterparts and the decline is much more a reflection of the tremendous economic pressure overall.”
| June 2023 | Dollar sales | Share of dollars | Dollar sales gains vs. YA | Unit gains vs. YA | Average price per pound | Increase price vs. YA |
| Fresh produce department | $7.9B | 82.2% | +1.6% | -0.6% | $1.78 | +5.1% |
| Frozen fruits and vegetables | $788M | 8.2% | +13.8% | -4.8% | $2.29 | +18.6% |
| Shelf stable fruits | $410M | 4.2% | +1.9% | -9.1% | $2.81 | +11.2% |
| Shelf stable vegetables | $518M | 5.4% | +4.7% | -5.4% | $1.47 | +10.6% |
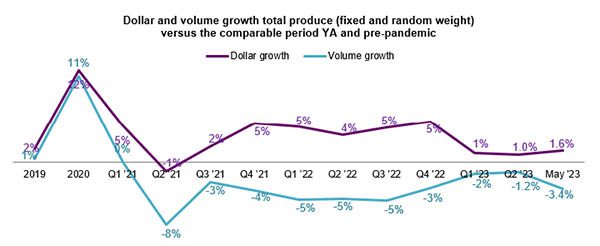
Fresh Produce Dollars versus Volume
“April was our highpoint when pounds briefly popped into positive growth territory, but unfortunately the second quarter averaged out at -1.2% year-over-year,” said Watson. As such, fresh produce pound sales have been trailing behind year ago levels since April of 2021. In June 2023, pound sales trailed year-ago levels by 3.4% though units were down much less, at -0.6% — signaling that shoppers are leveraging the amount they buy as a way to balance their spending.
While in 2022 fruit outperformed vegetables, the reverse is happening in the past few months. In June, vegetables had the better dollar and volume performance, with pounds within one percentage point of the 2022 levels.
| Growth over comparable period | ||||||||||||||||
| 2019 | 2020 | 2021 | Q1 22 | Q2 22 | Q3 22 | Q4 22 | Q1 23 | Q2 23 | Jun 23 | Vs. YA | Vs. 2YA | |||||
| Fruit | ||||||||||||||||
| Dollars | +0% | +9% | +6.5% | +10% | +4% | +4.6% | +1.3% | -1.2% | +0.0% | $4.2B | +1.3% | +2.4% | ||||
| Volume | -1% | +9% | -1.9% | -4% | -5% | -5.0% | -1.8% | -0.7% | -1.7% | 2.6B | -5.1% | -9.6% | ||||
| Vegetables | ||||||||||||||||
| Dollars | +4% | +15% | -1.2% | +0% | +3% | +4.8% | +6.8% | +3.5% | +2.1% | $3.6B | +1.9% | +6.1% | ||||
| Volume | +2% | +14% | -5.3% | -6% | -5% | -4.7% | -1.4% | -2.5% | -0.4% | 1.8B | -0.7% | -4.9% | ||||
Fresh Fruit Sales
“Berries’ performance continued to be outstanding,” said Watson. “The five June weeks generated nearly $1 billion in berries alone. But there is another success story in seasonal powerhouse cherries that are the star of front entry displays of many stores at the moment. Last month I predicted that cherries would move into the top five in June, and sure enough, here they are in the number four slot. Cherry sales increased 71.9% over year ago levels in pounds and 40.3% in dollars. This shows that consumers’ appetite for seasonal favorites is still strong.”
Other items with increased volume sales were avocados and mandarins, while pineapples kept pound sales flat year-on-year.
| Top 10 in sales | June 2023 | ||||
| Type | $ sales | $ vs. YA | Lbs vs. YA | ||
| Fresh fruit | $4.2B | +1.3% | -5.1% | ||
| Berries | $951M | +8.0% | +4.9% | ||
| Melons | $586M | -3.5% | -14.1% | ||
| Apples | $368M | +1.0% | -3.8% | ||
| Cherries | $342M | +40.3% | +71.9% | ||
| Bananas | $335M | +1.2% | -1.5% | ||
| Grapes | $334M | -4.7% | -24.4% | ||
| Avocados | $237M | -17.7% | +13.0% | ||
| Mandarins | $148M | +42.8% | +52.3% | ||
| Pineapples | $119M | +4.2% | +0.1% | ||
| Mixed fruit | $114M | +1.1% | -0.1% | ||
Fresh Vegetables Sales
“The dollar and pound performance among the top 10 vegetable sellers was all over the board,” Parker said. “Five items increased pound sales, being tomatoes, onions, peppers, cucumbers and corn. With the help of inflation, six out of the 10 top vegetable sellers grew dollar sales, led by potatoes, broccoli and lettuce.
Corn was the newcomer to the top 10 this month — a reflection of seasonal sales and more favorable pricing than that seen last summer.
| Top 10 in sales | June 2023 | |||
| Type | $ sales | $ vs. YA | Lbs vs. YA | |
| Fresh vegetables | $3.6B | +1.9% | -0.7% | |
| Tomatoes | $437M | +1.1% | +0.1% | |
| Potatoes | $375M | +13.0% | -3.0% | |
| Lettuce | $322M | +6.2% | -1.0% | |
| Salad kits | $282M | -3.9% | -5.6% | |
| Onions | $270M | -1.6% | +2.1% | |
| Peppers | $251M | -0.6% | +1.3% | |
| Cucumbers | $159M | +4.8% | +0.7% | |
| Corn | $135M | -2.7% | +5.2% | |
| Broccoli | $121M | +6.3% | -2.7% | |
| Carrots | $121M | +4.3% | -0.3% | |
Fresh Produce Absolute Dollar Gains
Cherries dethroned berries from the number one rank in absolute dollar growth when comparing June 2023 to June 2022. In all, fruit added $68 million year-on-year and vegetables $52 million, which means both cherries and berries outperformed the total that was pulled down by commodities that lost ground.
The top three performers all had robust pound gains, whereas others gained on inflation.
| Top 10 absolute | June 2023 | |||
| dollar growth | $ gain | $ sales | Lbs vs. YA | |
| Cherries | +$98.2M | $342M | +71.9% | |
| Berries | +$70.3M | $951M | +4.9% | |
| Mandarins | +$44.3M | $148M | +52.3% | |
| Potatoes | +$43.2M | $375M | -3.0% | |
| Lettuce | +$18.8M | $322M | -1.0% | |
| Cucumbers | +$7.2M | $159M | +0.7% | |
| Broccoli | +$7.2M | $121M | -2.7% | |
| Celery | +$5.5M | $84M | -4.1% | |
| Carrots | +$5.0M | $121M | -0.3% | |
| Tomatoes | +$5.0M | $437M | +0.1% | |
Perishables Performance
The meat department had the highest sales in June, but sustained inflation drove the highest year-over-year gains for the bakery department. Produce had the best unit performance — even if it was down from year-ago levels — whereas the meat department decreased by 4.0%.
| Perimeter | June 2023 | ||||
| departments | $ sales | $ vs. YA | Units vs. YA | ||
| Meat dpt. | $8.4B | -2.7% | -4.0% | ||
| Produce dpt. | $7.9B | +1.6% | -0.6% | ||
| Dairy aisle | $6.5B | +0.1% | -1.0% | ||
| Deli dpt. | $4.5B | +2.4% | -2.1% | ||
| Bakery dpt. | $4.3B | +7.8% | -1.9% | ||
| Seafood dpt. | $624M | -2.8% | -1.7% | ||
What’s Next?
While the moderating rate of inflation is an encouraging sign, few categories have seen a commensurate strengthening in demand. For many consumers, the duration and depth of inflation have exceeded any improvements in personal income over the past few years. This is underscored by record credit card debt levels and very low savings rates. When comparing their current financial situation to that of a year ago, the June Circana survey found that 37% of consumers say they are worse off, versus 17% who are doing financially better.
When looking ahead to next year, the survey found that 26% believe their financial situation will look better versus 28% who believe it will deteriorate further. While these percentages virtually balance out, it means that few people will be spending with confidence. This will likely mean a continued home-centric world for a while to come. This tends to benefit grocery retailing, however, the level of money-saving measures counterbalances the greater share of meal allocations.
The next report, covering July, will be released in mid-August. We also encourage you to contact Joe Watson, IFPA’s VP, Retail, Foodservice and Wholesale, at jwatson@freshproduce.com with any questions or concerns. Please recognize the continued dedication of the entire grocery and produce supply chains, from farm to retailer. #produce #joyoffresh
Date ranges:
- 2019: 52 weeks ending 12/28/2019
- 2020: 52 weeks ending 12/27/2020
- 2021: 52 weeks ending 12/26/2021
- 2022: 52 weeks ending 1/1/2023
- Q4 2022: 13 weeks ending 1/1/2023
- Q1 2023: 13 weeks ending 4/2/2023
- Q2 2023: 13 weeks ending 7/2/2023
- June 2023: 5 weeks ending 7/2/2023
