
Summer has arrived and with it the start of grilling season, outdoor entertainment and travel.
According to the May Circana survey of 1,000+ primary grocery shoppers, summer travel may look a bit different this year. “While 20% of consumers expect they will travel a bit more than in the summer of 2022, inflationary pressures are challenging the travel plans of others,” shared Jonna Parker, Team Lead, Fresh for Circana (formerly IRI). “This means fewer/shorter trips and staycations — both opportunities for grocery retailers to create memorable moments at home.”
Other findings from the May Circana survey include:
- 67% of consumers who like to entertain at home plan cookouts/barbeque gatherings.
- Across entertaining, everyday and weekend occasions, two-thirds of shoppers plan to grill as much as (50%) or more (19%) than last summer. New grills (31%) and the enjoyment of trying new foods and new barbecue recipes (34%) are important drivers behind plans to grill more often, according to shoppers. “Retailers have become much more active in teaching consumers to prepare various fruits and vegetables on the grill,” noted Joe Watson, IFPA’s VP, Retail, Foodservice and Wholesale. “For fresh produce, summer means a focus on seasonal items and local sourcing — two of the most desirable attributes to drive an unplanned purchase. Showing consumers new and expanded usage occasions can be just that extra incentive they need to make the purchase.”
- 21% of consumers plan to watch sporting events together with friends this summer — opening the door to sports-focused cross-merchandising opportunities.
- 18% of shoppers plan to organize pool parties, weather permitting.
The May Circana survey of primary grocery shoppers also documented the continued economic pressure on income and its subsequent influence on food spending, with more than eight in 10 shoppers applying one or more money-saving measures when buying groceries. This includes shifting dollars around between retail and foodservice as well as between channels, products and brands. Circana, 210 Analytics and the International Fresh Produce Association BB #:378962 team up to document the impact on sales patterns in fresh produce.
The price per unit across all foods and beverages in the Circana-measured multi-outlet stores, including supermarkets, club, mass, supercenter, drug and military, increased by 6.9% in May (the four weeks ending 5/28/2023), which was down from 11.4% in the first quarter of the year. This means continued moderation of the rate of inflation. However, when compared to the same four-week period in 2020, prices have increased by 23.3%.
| Average price/unit vs. YA | 2018 | 2019 | 2020 | 2021 | 2022 | Q4 2022 | Q1 2023 | May 23 |
| Total food & beverages | +1.5% | +2.0% | +5.1% | +5.4% | +12.5% | +13.5% | +11.4% | +6.9% |
Source: Circana, Integrated Fresh, Total US, MULO, average price per unit and % gain versus YA
In contrast, fresh produce prices were flat in May 2023 when compared to May 2022. Fresh fruit prices decreased 2.2% in comparison to May 2022. Vegetable inflation averaged 2.5% in May, which was down from the 52-week levels that averaged 7.3%
| Price per volume (lbs) | Price/volume | Change vs. YA | Change vs. 3YA |
| Total fresh produce May 2023 | $1.83 | +0.1% | +18.8% |
| Total fresh produce latest 52 weeks thru 5/28/23 | $1.84 | +5.5% | +17.9% |
| Fresh fruit May 2023 | $1.63 | -2.2% | +20.7% |
| Fresh fruit latest 52 weeks thru 5/28/23 | $1.69 | +3.8% | +19.3% |
| Fresh vegetables May 2023 | $2.05 | +2.5% | +17.1% |
| Fresh vegetables latest 52 weeks thru 5/28/23 | $1.98 | +7.3% | +16.8% |
Source: Circana, Integrated Fresh, Total US, MULO, average price per volume and % gain versus YA and 3YA
The four May 2023 weeks generated $60 billion total food and beverage sales, up 4.3% over May 2022, though unit sales trailed behind. Perishables, including produce, seafood, meat, bakery and deli, had a below-average dollar growth performance (+2.0%) but this was entirely prompted by the different levels of inflation as illustrated by the better-than-average unit performance (-1.1% versus -3.5% for center-store grocery).
| May 2023 % change | Latest 52 weeks % change | ||||||||
| Dollar size | Dollars vs. YA | Dollars vs. 2YA | Units vs. YA | Units vs. 2YA | Dollars vs. YA | Dollars vs. 2YA | Units vs. YA | Units vs. 2YA | |
| Total food & beverages | $60B | +4.3% | +12.7% | -2.4% | -6.3% | +8.5% | +14.6% | -3.2% | -5.4% |
| Center-store grocery | $29B | +7.3% | +17.5% | -3.5% | -7.3% | +10.9% | +18.1% | -3.8% | -5.9% |
| Total perishables | $27B | +2.0% | +10.2% | -1.1% | -5.0% | +7.3% | +13.3% | -2.5% | -4.6% |
Source: Circana, Integrated Fresh, Total US, MULO
May 2023 fresh produce sales reached $6.1 billion. “Both fruit and vegetables performed well in May which helped to move the 52-week numbers within 2 percentage points of year-ago levels,” Watson noted. “This is significantly better than the total food and beverage performance, as well as significantly better than fruit and vegetable counterparts in frozen and canned.”
| May 2023 % change | Latest 52 weeks % change | ||||||||
| Dollar size | Dollars vs. YA | Dollars vs. 2YA | Units vs. YA | Units vs. 2YA | Dollars vs. YA | Dollars vs. 2YA | Units vs. YA | Units vs. 2YA | |
| Total fresh produce | $6.1B | -0.7% | +4.3% | -0.3% | -4.3% | +3.2% | +7.6% | -2.0% | -4.9% |
| Fresh fruit | $3.1B | -3.1% | +3.1% | -0.1% | -2.2% | +1.5% | +10.5% | -1.2% | -1.5% |
| Fresh vegetables | $2.9B | +2.0% | +5.5% | -0.3% | -5.9% | +4.9% | +4.7% | -2.6% | -7.5% |
Source: Circana, Integrated Fresh, Total US, MULO, % change vs. year ago.
| Produce department | Dollar sales | $ vs. YA | lbs vs. YA |
| May 2023 | $6.1B | -0.7% | -0.8% |
| w.e. 5/7/2023 | $1.493B | -1.4% | -0.9% |
| w.e. 5/14/2023 | $1.541B | +3.0% | +1.8% |
| w.e. 5/21/2023 | $1.482B | -2.9% | -3.3% |
| w.e. 5/28/2023 | $1.590B | -1.2% | -0.7% |
| Source: Circana, Integrated Fresh, Total US, MULO |
Weekly fresh produce sales averaged between $1.48 billion and $1.59 billion. “The impact of Memorial Day on weekly sales in comparison to a non-holiday week shows that celebrations continue to be an important reason to splurge a little,” Parker pointed out. “This means celebrating primary and secondary holidays in-store and online is important to support sales growth. Additionally, there is opportunity in creating your own holidays and events.”
Total Store Comparison
“While fresh produce prices were flat in May 2023 compared with May 2022, inflation in frozen and shelf-stable fruits and vegetables was significant,” Parker commented. “In turn, these very different levels and movements in pricing prompted the different dollar and unit growth performances.”
| May 2023 | Dollar sales | Share of dollars | Dollar sales gains vs. YA | Unit gains vs. YA | Average price per pound | Increase price vs. YA |
| Fresh produce department | $6.1B | 81.1% | -0.7% | -0.3% | $1.83 | +0.1% |
| Frozen fruits and vegetables | $648M | 8.6% | +15.6% | -4.8% | $2.28 | +19.3% |
| Shelf stable fruits | $345M | 4.6% | +3.8% | -9.1% | $2.80 | +12.2% |
| Shelf stable vegetables | $427M | 5.7% | +7.5% | -3.0% | $1.45 | +11.0% |
Source: Circana Integrated Fresh, Total US, MULO
Fresh Produce Dollars versus Volume
“April pounds popped into positive growth territory, but unfortunately we gave back a little ground in May,” said Watson. “Still, the longer-term trend continues to take year-on-year pound sales growth closer and closer to where we want to be.” Fresh produce pound sales have been trailing behind year ago levels since April of 2021. In May 2023, pound sales trailed year-ago levels by 0.8%.
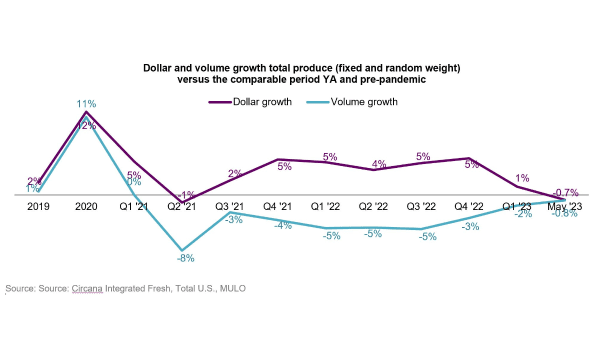
Source: Source: Circana Integrated Fresh, Total U.S., MULO
Unlike April, when fruit pound sales increased substantially year-on-year, it was vegetables that had the better volume performance in May.
| Growth over comparable period | ||||||||||||||
| 2019 | 2020 | 2021 | Q1 22 | Q2 22 | Q3 22 | Q4 22 | Q1 23 | May 23 | Vs. YA | Vs. 2YA | ||||
| Fruit | ||||||||||||||
| Dollars | +0% | +9% | +6.5% | +10% | +4% | +4.6% | +1.3% | -1.2% | $3.1B | -3.1% | +3.1% | |||
| Volume | -1% | +9% | -1.9% | -4% | -5% | -5.0% | -1.8% | -0.7% | 1.9B | -1.0% | -3.8% | |||
| Vegetables | ||||||||||||||
| Dollars | +4% | +15% | -1.2% | +0% | +3% | +4.8% | +6.8% | +3.5% | $2.9B | +2.0% | +5.5% | |||
| Volume | +2% | +14% | -5.3% | -6% | -5% | -4.7% | -1.4% | -2.5% | 1.4B | -0.5% | -5.2% | |||
Source: Circana Integrated Fresh, Total U.S., MULO
Fresh Fruit Sales
| Top 10 in sales | May 2023 | ||||
| Type | $ sales | $ vs. YA | Lbs vs. YA | ||
| Fresh fruit | $3.1B | -3.1% | -1.0% | ||
| Berries | $855M | +6.7% | +3.3% | ||
| Melons | $375M | +2.6% | +3.0% | ||
| Apples | $325M | -0.5% | -4.8% | ||
| Bananas | $271M | +1.4% | -1.3% | ||
| Grapes | $262M | -2.5% | -23.9% | ||
| Avocados | $196M | -17.7% | +21.2% | ||
| Mandarins | $158M | +7.2% | +15.7% | ||
| Oranges | $103M | -1.4% | +3.9% | ||
| Pineapples | $90M | +1.5% | +1.2% | ||
| Mixed fruit | $90M | -0.6% | -1.8% | ||
“Six out of the top 10 fruit sellers sold more pounds in May 2023 than May 2022,” Parker said. “Berries continued to be an incredible powerhouse: twice the size of the number two seller and achieving a 3.3% gain in pounds. There aren’t too many items around the store that show that kind of growth in the current environment.” Other items with increased volume sales were melons, avocados, mandarins, oranges and pineapples. Avocados and grapes continued to have a large gap between dollar and volume performances as a resulted of deflation and inflation.
Items with increased dollar sales in May 2023 compared with last year were berries, melons, bananas, mandarins and pineapples. “Cherry sales fell just outside of the top 10 in May,” Watson added, “but the California and Washington crops certainly were the topic of much discussion at our Chicago retail conference last week. In May, sales five folded with each passing week and I fully expect cherries to be a top 10, if not top 5, sales contender in the June and July reports.
Fresh Vegetables Sales
| Top 10 in sales | May 2023 | |||
| Type | $ sales | $ vs. YA | Lbs vs. YA | |
| Fresh vegetables | $2.9B | +2.0% | -0.5% | |
| Tomatoes | $336M | +1.3% | +0.8% | |
| Potatoes | $291M | +12.4% | -2.9% | |
| Lettuce | $264M | +10.1% | 0.0% | |
| Salad kits | $233M | -4.0% | -5.9% | |
| Onions | $203M | -3.0% | +1.7% | |
| Peppers | $200M | -0.5% | +3.1% | |
| Cucumbers | $126M | +5.1% | +2.5% | |
| Broccoli | $100M | +6.0% | -6.8% | |
| Carrots | $99M | +4.8% | -1.0% | |
| Mushrooms | $95M | -1.8% | -2.5% | |
“The dollar and pound performance among the top 10 vegetable sellers was all over the board,” Watson said. “Four items increased pound sales, being tomatoes, onions, peppers and cucumbers. With the help of inflation, six out of the 10 top vegetable sellers grew dollar sales, led by potatoes and lettuce.
The dual power of value versus convenience can be seen in sales for both lettuce and salad kits, the number three and four sellers. However, whereas lettuce kept year-on-year pound sales flat in May 2023, salad kits experienced a decrease of 5.9%.
Source: Source: Circana Integrated Fresh, Total U.S., MULO
| Top 10 absolute | May 2023 | |||
| dollar growth | $ gain | $ sales | Lbs vs. YA | |
| Berries | +$54M | $855.3M | +3.3% | |
| Potatoes | +$32M | $290.8M | -2.9% | |
| Lettuce | +$24M | $263.7M | 0.0% | |
| Mandarins | +$11M | $158.1M | +15.7% | |
| Melons | +$10M | $374.7M | +3.0% | |
| Cucumbers | +$6M | $126.3M | +2.5% | |
| Broccoli | +$6M | $100.2M | -6.8% | |
| Carrots | +$5M | $98.8M | -1.0% | |
| Tomatoes | +$4M | $336.1M | +0.8% | |
| Bananas | +$4M | $270.7M | -1.3% | |
Fresh Produce Absolute Dollar Gains
In May 2023, fresh vegetables added $57 million in additional dollars versus May 2022 whereas total fruit lost $100 million year-over-year.
Berries were the biggest contributor to new produce dollars, followed by potatoes and lettuce. Gains were driven by a combination of increased pounds and inflation for items such as mandarins and melons, whereas others benefited from higher prices in May 2023 versus May 2022.
Source: Circana Integrated Fresh, Total U.S., MULO
| Perimeter | May 2023 | ||||
| departments | $ sales | $ vs. YA | Units vs. YA | ||
| Meat dpt. | $6.7B | -1.5% | -2.4% | ||
| Produce dpt. | $6.1B | -0.7% | -0.3% | ||
| Dairy aisle | $5.3B | +3.8% | -0.1% | ||
| Deli dpt. | $3.6B | +3.9% | -2.0% | ||
| Bakery dpt. | $3.4B | +9.5% | -1.1% | ||
| Seafood dpt. | $501M | -2.2% | -1.4% | ||
Perishables Performance
The meat department had the highest sales in May 2023, at $6.7 billion. However, the meat department experienced a decline in dollar sales due to lower unit/pound sales combined with deflation. The dairy aisle and produce department had the lowest unit pressure across the fresh perimeter.
Source: Circana Integrated Fresh, Total U.S., MULO, fixed and random weight items combined into department views
What’s Next?
The Fourth of July is around the corner and one of the biggest grilling holidays of the year. According to the May Circana survey, 65% of Americans engaged in some kind of special activity last year, led by friends/family get togethers (36%), day and weekend trips (36%) and cookouts (25%). This year’s plans are very similar.
The next report, covering May, will be released in mid-July. We also encourage you to contact Joe Watson, IFPA’s VP, Retail, Foodservice and Wholesale, at jwatson@freshproduce.com with any questions or concerns. Please recognize the continued dedication of the entire grocery and produce supply chains, from farm to retailer. #produce #joyoffresh
2019: 52 weeks ending 12/28/2019
2020: 52 weeks ending 12/27/2020
2021: 52 weeks ending 12/26/2021
2022: 52 weeks ending 1/1/2023
Q4 2022: 13 weeks ending 1/1/2023
Q1 2023: 13 weeks ending 4/2/2023
March 2023: 5 weeks ending 4/2/2023
April 2023: 4 weeks ending 4/30/2023
May 2023: 4 weeks ending 5/28/2023
