

The July Marketplace
Despite some consumers pointing to planning to eat out less often to save money during these inflationary times, 80% of consumers have ordered from or eaten at a restaurant in the past few weeks. More than half, 54%, have ordered restaurant takeout and 49% have dined in.
Restaurant engagement is far higher among households in their prime child-rearing years: Older Millennials and Gen X, shoppers ages 32 to 56.
“During the early years of the pandemic, we talked a lot about the very different pressures on time. Generally speaking, consumers commuted less plus weekend and evening activities were cancelled. However, parents were juggling work and home schooling,” noted Jonna Parker, Team Lead Fresh at IRI. “Overall, those early pandemic months saw lower consumer mobility and more time in the kitchen. As life’s hecticness has resumed, the eternal battle between time/convenience, healthfulness and money has intensified in the past year. This has resulted in very complex consumption and shopping patterns. We see the same household take to scratch cooking one day and value-added or deli solutions the next. We see ultra-premium and pure value items in the same basket. We see consumers switch seamlessly between quick frozen meal solutions or fresh meal kits and spending hours on cooking meat on the smoker. There is no one-size-fits-all way to handle inflationary pressures in 2022.”
“Inflation, COVID and consumer mobility continue to change shopping and consumption patterns,” agreed Joe Watson, VP, Retail, Foodservice & Wholesale for IFPA. “The consumer reactions to the current environment combined with supply side volatility are keeping all of us on our toes to understand the latest trends and quickly pivot accordingly. IRI, 210 Analytics and IFPA are committed to bringing the latest trends and analysis relative to the produce department.”
The July edition of the IRI monthly survey of primary shoppers underscores the market complexity.
- Awareness of grocery inflation is widespread and consumers list examples of price inflation across virtually every department in the store. “Three-quarters of consumers mention fresh produce when reflecting on inflation,” said Parker. “Fresh produce has a very high trip frequency, making consumers ultra-aware of the price increases plus produce has always played a key role in store choice.”
- Unchanged from last month, eight in 10 grocery shoppers made changes to what and where they purchased. The dominant changes are looking for sales specials (49%), skipping non-essentials (44%), finding coupons (31%) and buying more private or other low-cost brands (32%). Despite the high gas prices, 17% cherry pick specials across retailers and 15% now do some of their shopping at lower-cost retailers.
- Sales specials, while popular, are only slowly gearing up and are still far below pre-pandemic levels. Consumers are taking notice: 54% say fewer of the items they want are on sale and 44% say items are not discounted as much as they used to be. “Promotions remain extremely relevant in today’s marketplace,” Watson noted. “Creative approaches such as shorter durations or cross-promotions may help deliver the value consumers are looking for. We also cannot underestimate the power of education with value in mind. To Jonna’s point, consumers are very aware of inflation. How can produce help? How can eggplant parm deliver a nutritious, delicious and cost-saving alternative? How can mushrooms help stretch consumers’ meat dollar? Produce has a much lower cost per pound than many other items and we have an opportunity to teach consumers about the true power of plant-based during times when there is a lot of pressure on the food dollar.”
- The share of home-prepared meals dropped to its lowest point in years, at a consumer-estimated 78.2% of all meals. The average share of home-prepared meals is higher among low-income shoppers, at 78.9%, versus high-income shoppers, at 76.1%.
- Online shopping jumped up in July to 19% of trips. Convenience but also the ability to control total basket spend are prime reasons to shop for groceries online. Additionally, 26% of Americans were extremely concerned about COVID-19 in July. While less than half of the initial level of concern, it still means changed shopping and consumption patterns for one-quarter of Americans.
Inflation Insights
The price per unit across all foods and beverages in the IRI-measured multi-outlet stores, including supermarkets, club, mass, supercenter, drug and military, accelerated further to an increase of 13.3% in the five weeks ending July 31st, 2022 (“July”) versus year ago. This is up from +12.3% in June. July inflation was +15.3% in the center of the store (grocery) and +12.6% for perishables. Compared with July 2019, prices across all foods and beverages were up 25.2%.
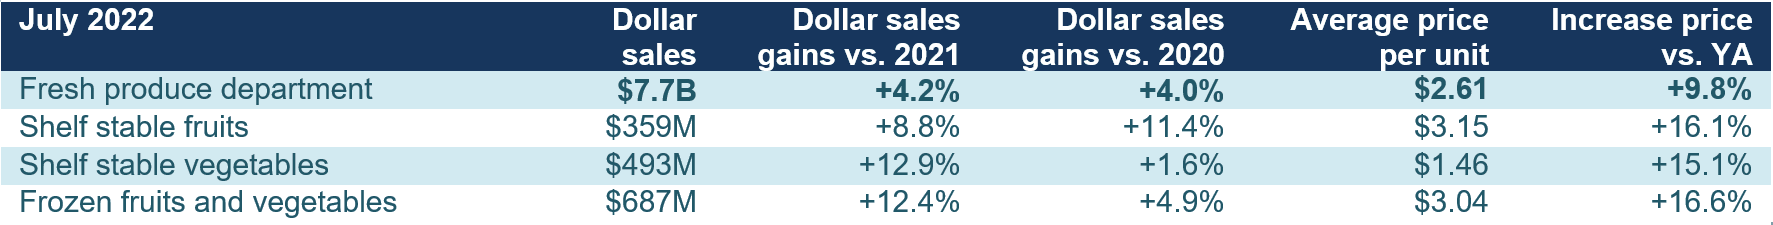
![]() Source: IRI, Integrated Fresh, Total US, MULO, average price per unit and % gain versus YA
Source: IRI, Integrated Fresh, Total US, MULO, average price per unit and % gain versus YA
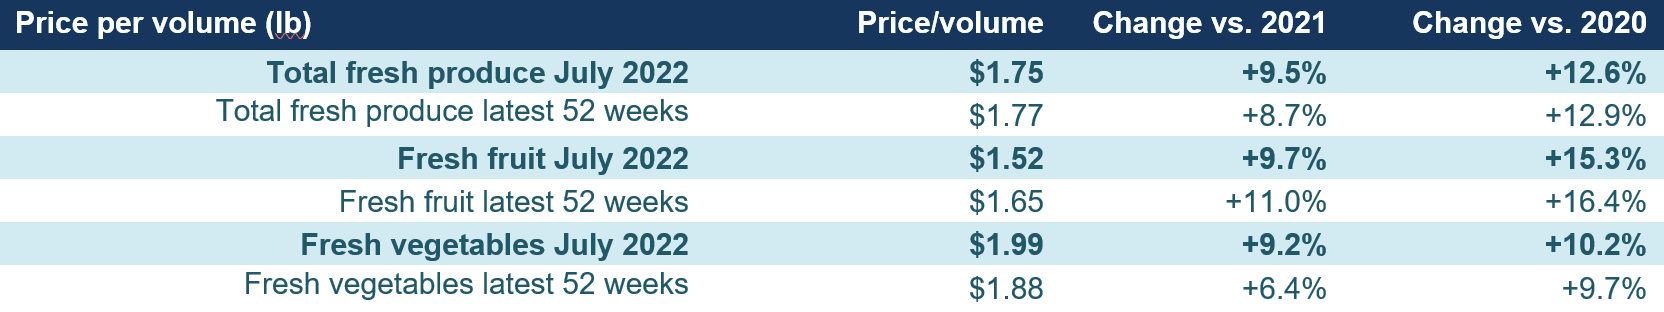
Fresh produce prices were also up from last year, at +8.5% level on a per-unit basis and +9.5% on a per-pound basis. This is far below the total store average as fruit prices have been on the decline in the past few months. Unlike the beginning of the year where inflation was predominantly driven by fruit, it was vegetables that reached +9.2% inflation in July 2022 versus year ago. In the 52-week view, fresh fruit inflation is still far above average.
July 2022 Sales
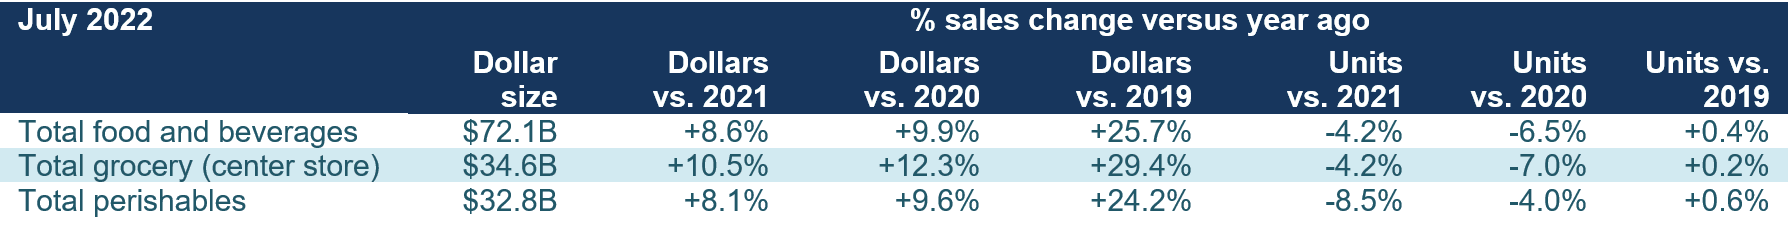
The five July 2022 weeks brought $72.1 billion in total food and beverage sales, which was up +8.6% versus year ago. This is an acceleration from +7.6% in June. July 2022 dollar sales were up +25.7% versus July 2019 — the pre-pandemic normal. Perishables, including produce, seafood, meat, bakery and deli, had average dollar performance, but center-store items did better than average in units, despite above-average inflation.
Year-on-year gains were inflation-boosted, with unit sales down -4.2%. “While units are down, declines have averaged between 4% and 5% for several months now,” Parker explained. “We also have to keep in mind that prices have increased more than 25% versus 2019 and yet total food and beverage unit sales are flat — underscoring that consumer demand at retail remains strong.”
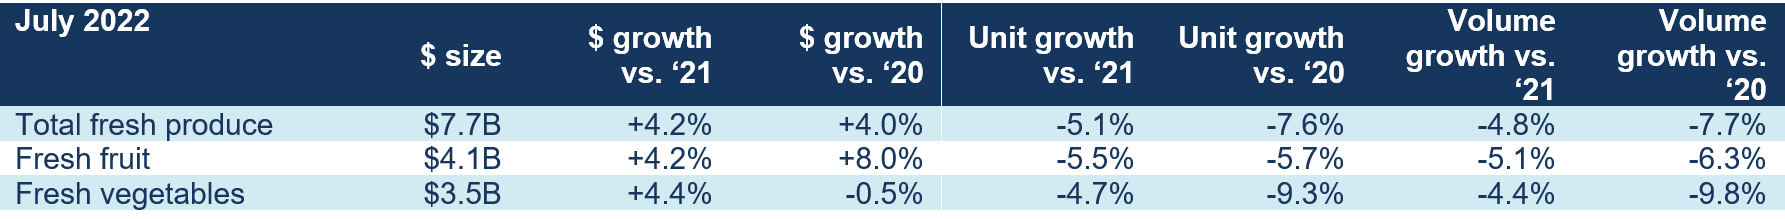
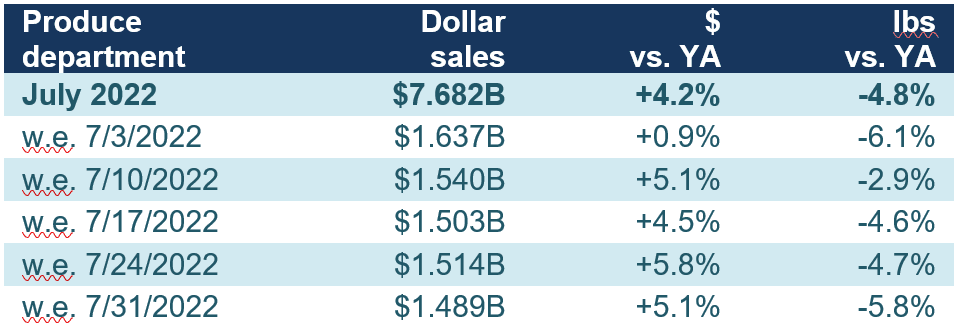
July 2022 fresh produce sales reached $7.7 billion, surpassing the record set the prior year by +4.2%. However, looking beyond dollars that were highly affected by inflation, unit and volume declined versus July 2021. Vegetables were down slightly less than fruit.
Each of the July weeks generated right around $1.5 billion in fresh produce sales. The first week, the holiday week, was the strongest but sales held remarkably steady throughout the month.
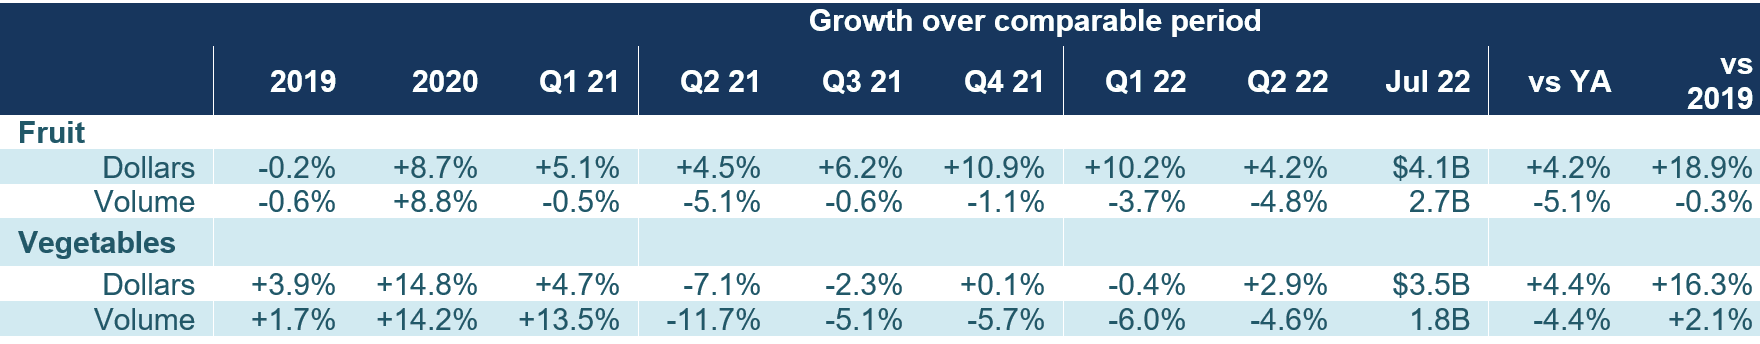
“In the fourth quarter of 2021 and the first quarter of 2022, the sales performances of fruit and vegetables were far apart,” explained Parker. “In July, they are converging right around +4% dollar growth. Back-to-school shopping is in full swing and that brings about many healthy produce snacking campaigns at retailers around the country in addition to the final weeks of grilling season.”
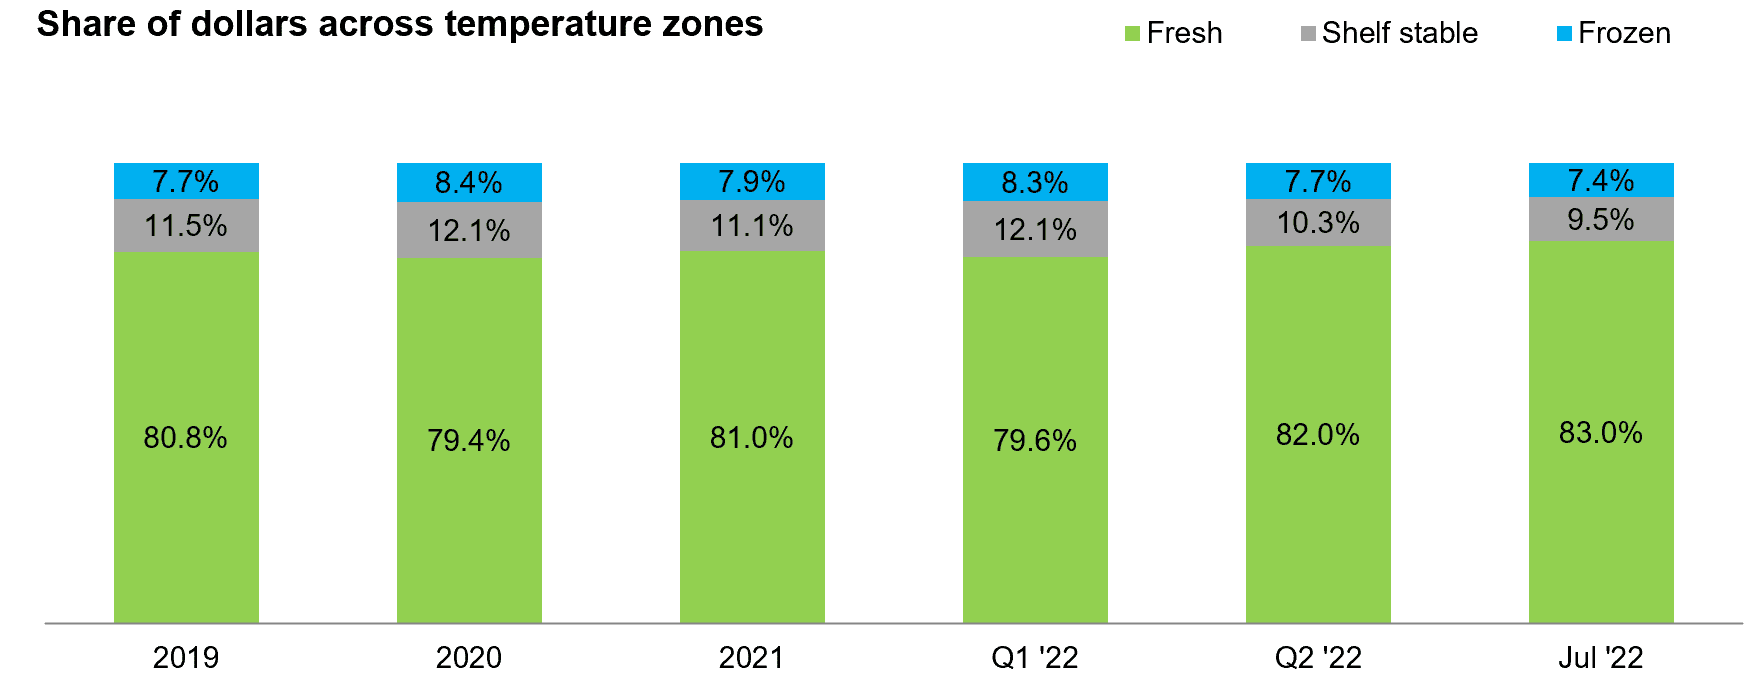
Fresh Produce Share of Total Fruits and Vegetables

“The fresh share of the business is one metric we watch closely at IFPA,” Watson commented. “While it seems that fresh produce growth, at +4.2%, is below average, we have to keep in mind that inflation in frozen and shelf stable was much higher plus the produce department is much bigger.
In fact, the fresh share of the business has been rising steadily. While certainly summer is a top season for fresh produce sales, July 2022 shows that consumers are not switching out of fresh produce out of inflationary concerns.
Fresh Produce Dollars versus Volume
Fresh produce pound sales trailed behind year ago levels all throughout 2021 and thus far in 2022. In July, pound sales were down -4.8% year-on-year. Importantly, compared with 2019, the pre-pandemic normal, dollars remained +17.7% ahead (green triangles) and pounds stayed above 2019 levels by +0.7% (purple squares).
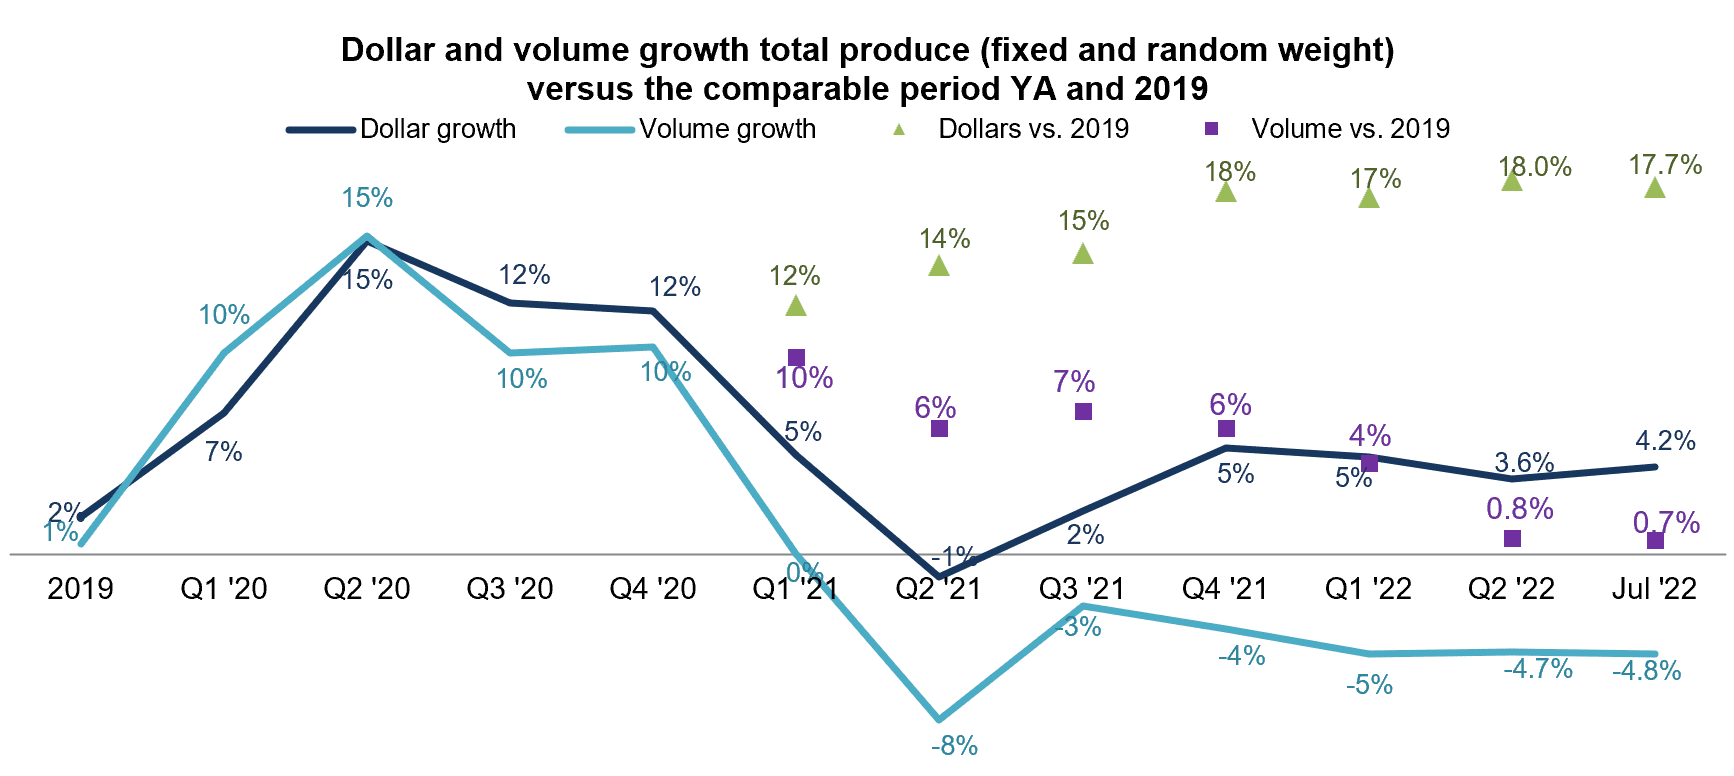
Fruit had been experiencing some volume pressure in the early months of 2022, but pulled even with 2019 levels on much better prices in July. Vegetable pounds were down year-on-year as well, but still sit 2.1% ahead of 2019.
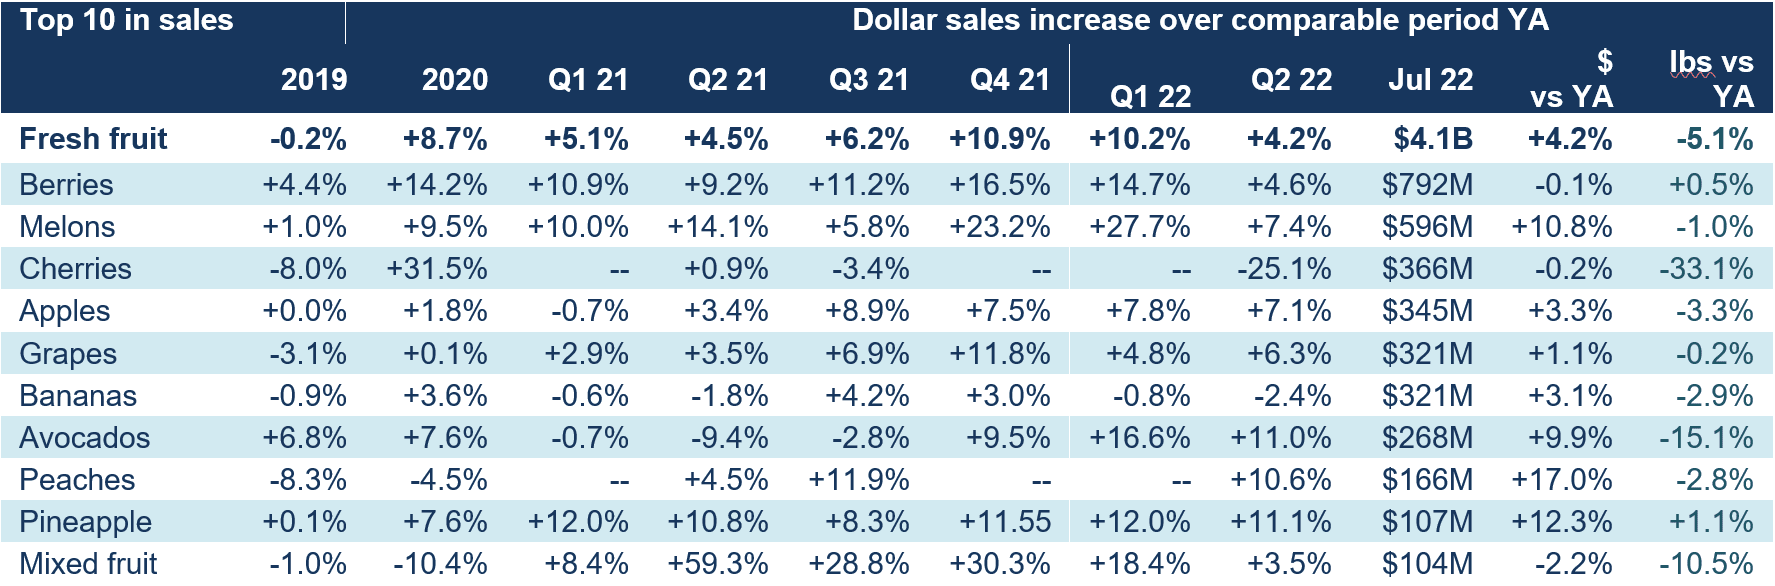
Fresh Fruit Sales in July
“While berries were the biggest seller in July, the gap with the number two, melons, was by far not as big as we’ve seen,” Parker said. “In part this has to do with below-average inflation, but we also saw cherries come on strong and mixed fruit moving back in the top 10 sellers due to the Fourth of July sales spike. Volume sales were a mix with increases for berries and pineapples but down results for all other top 10 sellers.”
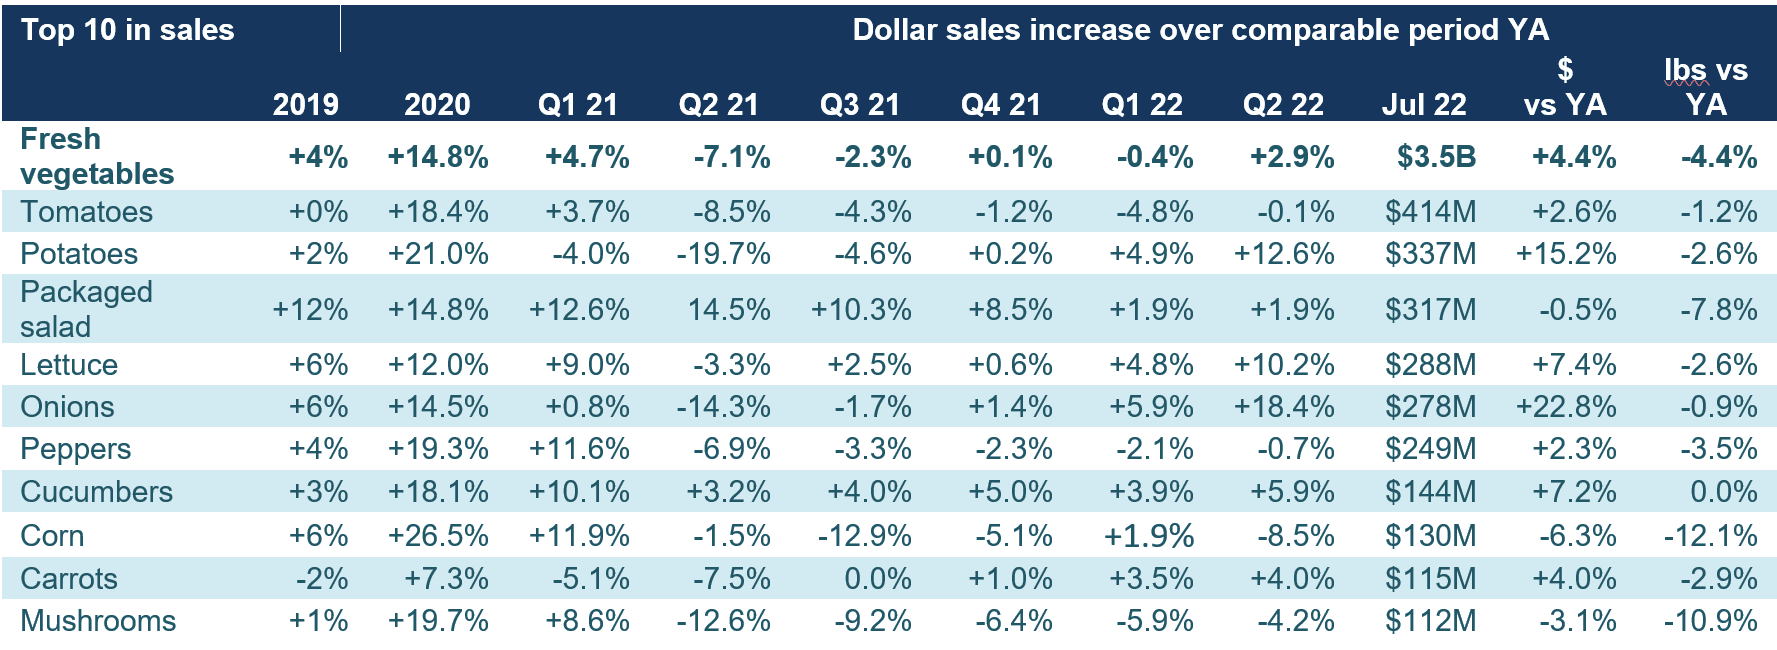
Fresh Vegetables Sales in July
“July’s vegetable performance was very mixed,” said Watson. “While most top sellers increased dollar sales none saw volume increases. A stark illustration of the difficult marketplace.”
Fresh Produce Absolute Dollar Gains
In July 2022, fresh fruit added $163 million in sales and vegetables added $147 million when compared to July 2021. Gains were achieved in many different ways. Avocados, peaches, nectarines and plums had very high inflation. Pineapples and apples had below-average inflation, but robust demand pushed their performances into the top 10 in absolute dollar growth in July.

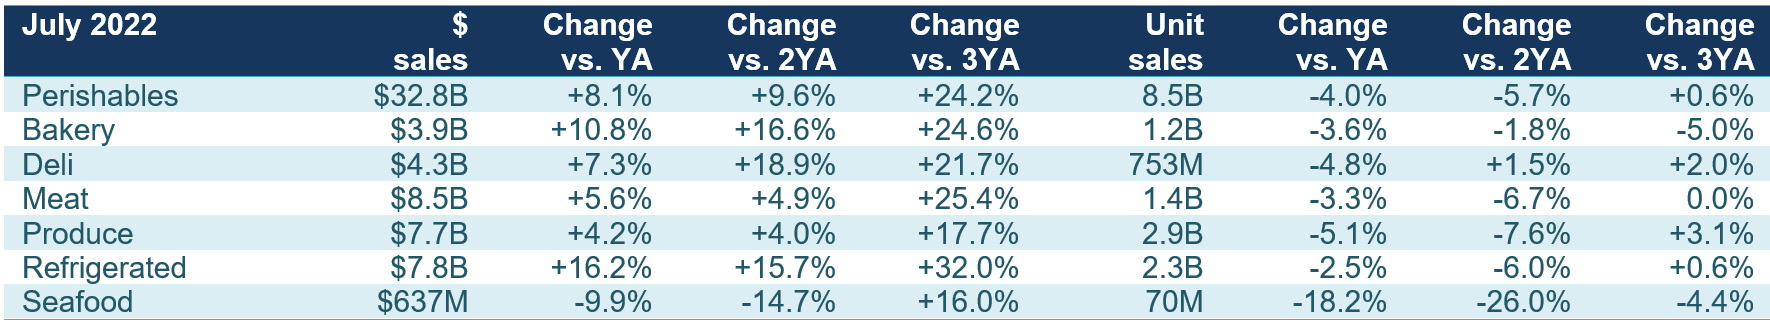
Perishables Performance
The meat department continued to be the biggest area of sales around the perimeter, at $8.5 billion. Refrigerated, which includes dairy, is second, at $7.8 billion, followed closely by fresh produce. Refrigerated had the highest dollar gains, fueled by very high inflation across categories and eggs in particular. Seafood was the only department to lose ground in dollars and units. Fresh seafood units have also fallen behind 2019 levels.
What’s Next?
The BLS Consumer Price Index came down some in July due to decreases in the cost of gasoline and airline tickets. This may provide consumers with some budgetary relief. However, grocery price increases continued to accelerate. As such, inflation will continue to have a profound impact on grocery and total food spending.
The July IRI survey found that:
- 45% of American households describe their financial situation as being worse than a year ago, unchanged from June.
- 43% are having some or a lot of difficultly affording needed groceries
- 34% feel their financial situation one year from now will look worse than it does today.
The next report, covering August, will be released in mid-September. In addition to the data provided here, the IFPA also now offers InSite – an online interactive data set covering both produce and floral performance as well as a look at the 2021 consumer sentiment surveys. Start your free trial today! See www.freshproduce.com/insite for more detail. We also encourage you to contact Joe Watson, IFPA’s VP, Retail, Foodservice and Wholesale, at jwatson@freshproduce.com with any questions or concerns. Please recognize the continued dedication of the entire grocery and produce supply chains, from farm to retailer. #produce #joyoffresh #SupermarketSuperHeroes.
Date ranges:
2019: 52 weeks ending 12/28/2019
2020: 52 weeks ending 12/27/2020
Q1 2021: 13 weeks ending 3/28/2021
Q2 2021: 13 weeks ending 6/27/2021
Q3 2021: 13 weeks ending 9/26/2021
Q4 2021: 13 weeks ending 12/26/2021
Q1 2022: 13 weeks ending 3/27/2022
Q2 2022: 13 weeks ending 6/26/2022
July 2022: 5 weeks ending 7/31/2022
