

March 2020 experienced the biggest spikes in the history of grocery retailing as the nation bought supplies to fill their freezers, fridges and pantries in preparation for shelter in place. After an initial flurry of trips in mid-March, the number of store visits fell far below year-ago levels whereas the average basket ring came in well ahead of the pre-pandemic normal. While fresh produce sales spiked to record highs in 2020, both canned and frozen fruit and vegetables took share in the early months as people were focused on shelf life. In March 2021, sales started lapping the enormous spikes of 2020 and the comparison to year-ago levels turned negative for most areas even though the demand stayed well ahead of the 2019 baseline.
Trips and Basket Size
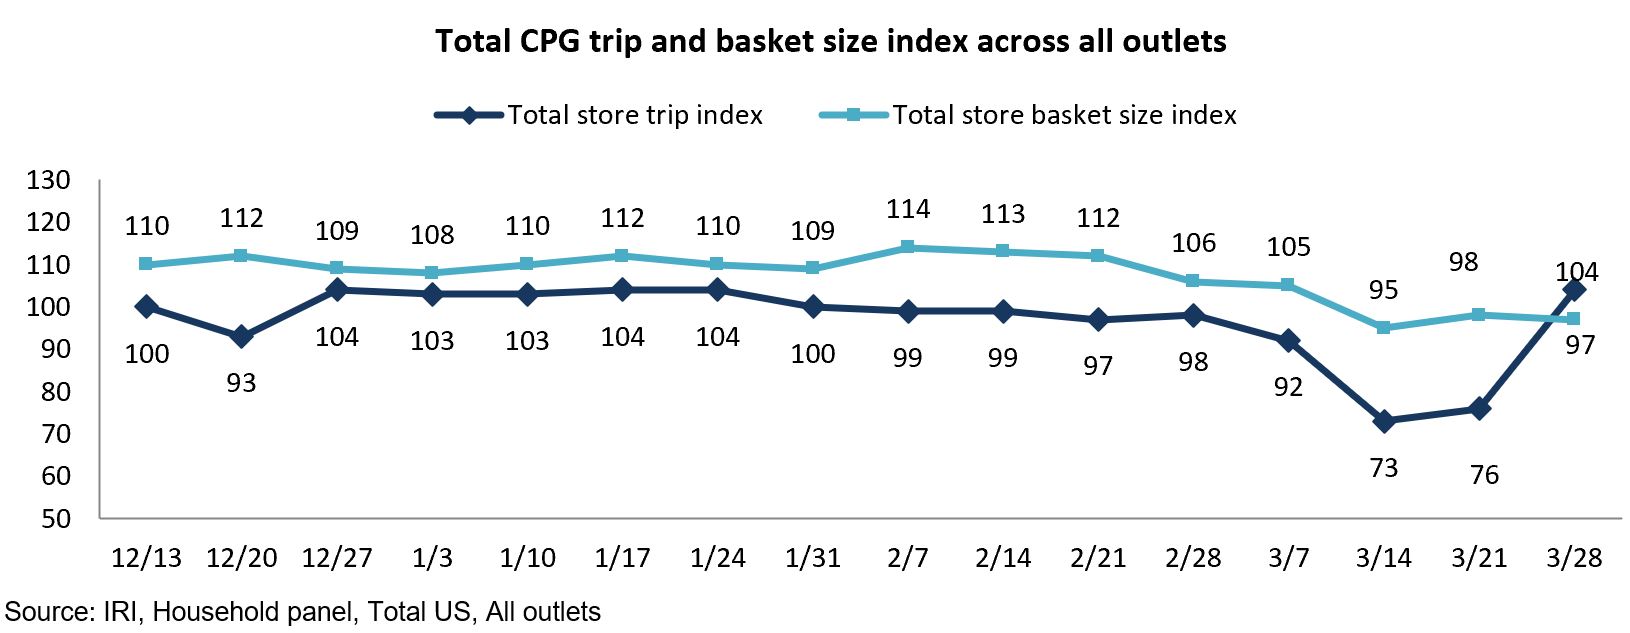
Neither the total store trips nor basket size was able to match the spikes seen in mid-March 2020. While the earlier Easter holiday boosted total store trips the final week of March, the total basket size continued to track below the record 2019 levels, indexing at 97. Sales for all food and beverage related items during the four weeks endings between March 7 and March 28, 2021 dropped to -17.8% below the record March 2020 levels. However, total food and beverage sales remained highly elevated from the 2019 pre-pandemic baseline, at +14.6%.
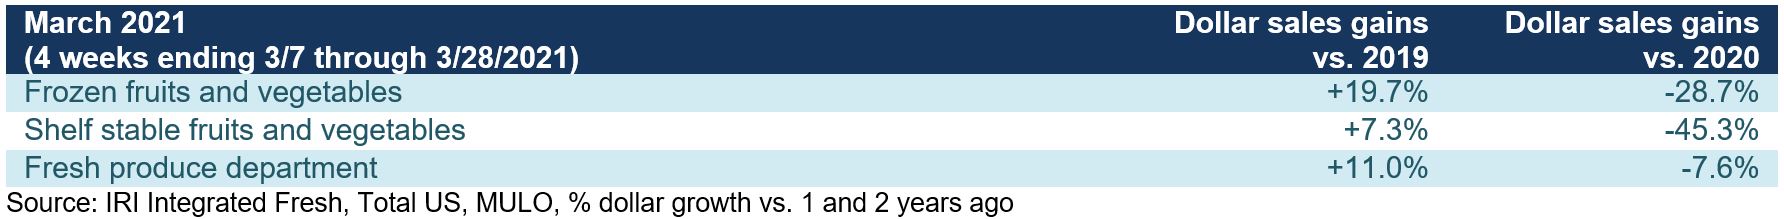
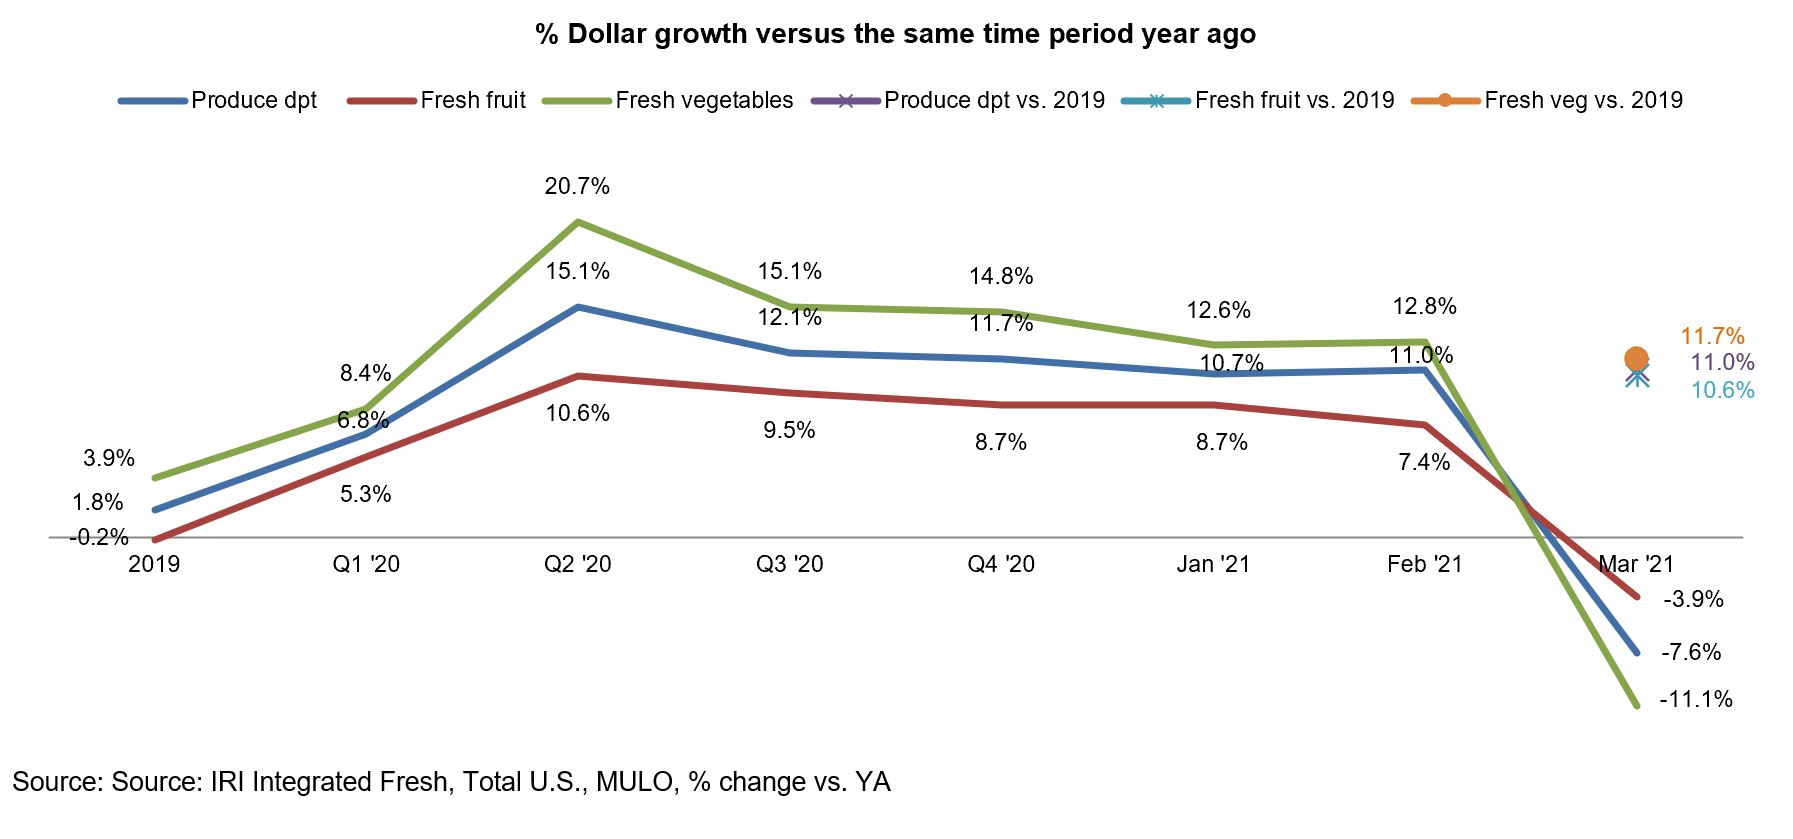
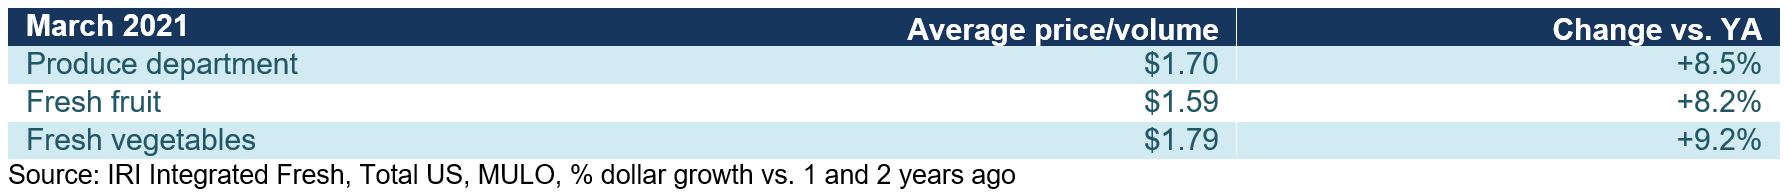
March produce department sales for the four weeks ending 3/28/2021 decreased 7.6% year on year. While down, this is one of the best performances across departments. In comparison to the 2019 pre-pandemic normal, fresh produce sales at retail were up 11%. Because of the shift to both canned and frozen during the early weeks of the pandemic last year, declines in these areas are much bigger, at -28.7% for frozen fruits and vegetables and -45.3% for canned.
“We knew the year-over-year picture would radically change come March in going up against the early pandemic spikes of 2020,” said Joe Watson, VP of Membership and Engagement for the Produce Marketing Association (PMA). “But while the year-ago picture is always important, it is just as important to understand current demand relative to the pre-pandemic normal as the country is starting to open up a little more each day. Consumer mobility is improving and it is likely we will see a shift from home-centric consumption to more meals being eaten outside the home. Understanding where that at-home versus away-from-home spending balance lies relative to pre-pandemic will help our industry with demand forecasting.”
Fresh produce generated $5.3 billion in sales during the four March weeks, unchanged from February 2021. This is down $435 million from March 2020, but up $524 million from the 2019 pre-pandemic normal. The latter includes a $242 million increase in fruit and a $283 million increase in vegetables versus the 2019 baseline.
Fresh Share
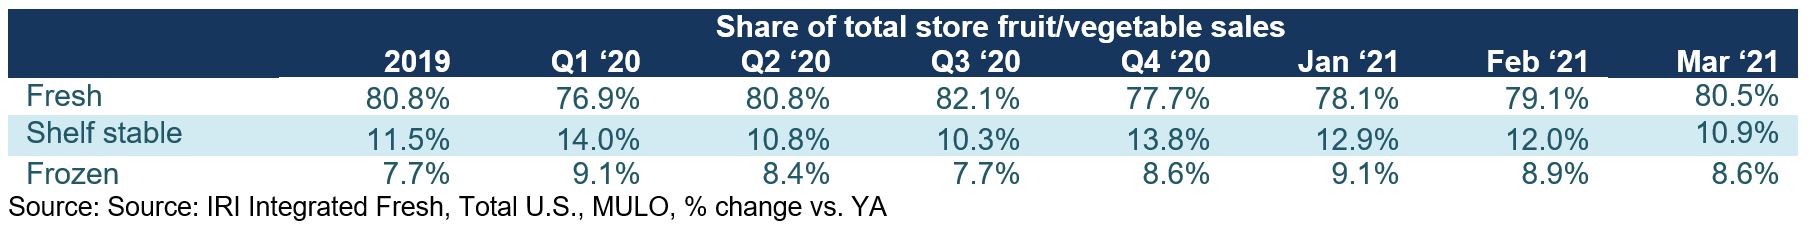
In 2019, fresh produce sales represented 80.8% of total fruits and vegetables sales across the store. That share fell as low as 76.9% during the first quarter of 2020, pulled down by the March panic buying weeks when many dollars were diverted to frozen and canned. While frozen fruit and vegetables remain elevated, the fresh share reached its highest point since the third quarter of 2020, at 80.5% of dollars.
Fresh Produce Dollars versus Volume
Early on in the pandemic, fresh produce experienced deflation with volume outpacing dollar growth. In going up against those patterns in March 2021, both dollars and volume sales were down year-on-year, however, dollars decreased only 7.6% versus 14.8% for volume. Further widening that gap is the slight inflation in March 2021 versus deflation in March 2020. When compared to the 2019 pre-pandemic baseline, both volume and dollar sales were up, with volume 7.1% higher.
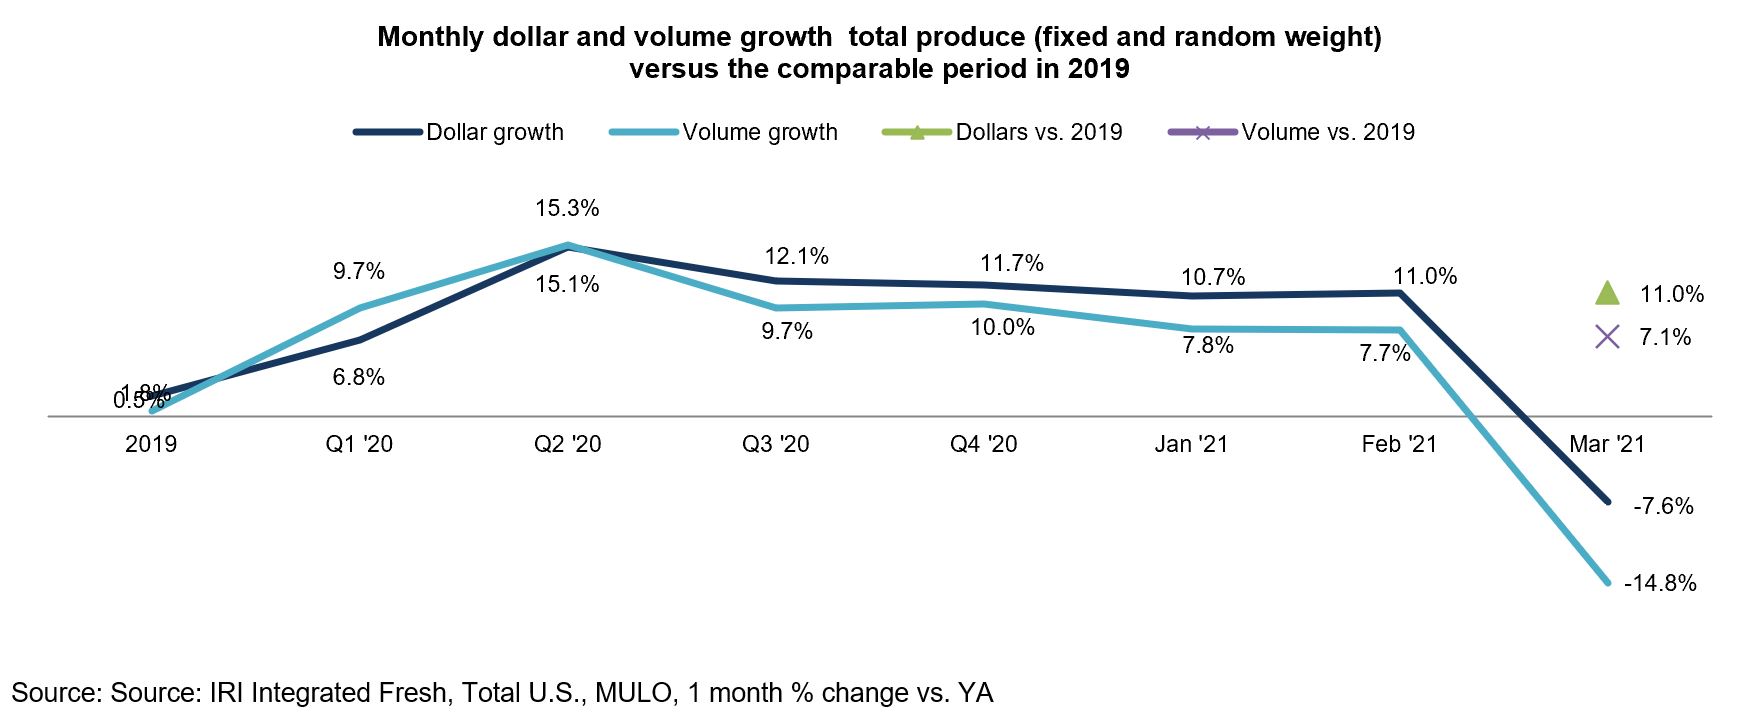 “It takes a minute to wrap our brains around these results,” said Watson. “But the pandemic trends of vegetables outperforming fruit have not changed. The easiest way to look at performance is to compare March 2021 dollars and pounds to those sold in March 2019. The year-on-year view shows better results for fruit because the spikes in fruit were not as high as those of vegetables in the early pandemic weeks plus fruit is experiencing some inflation at the moment.”
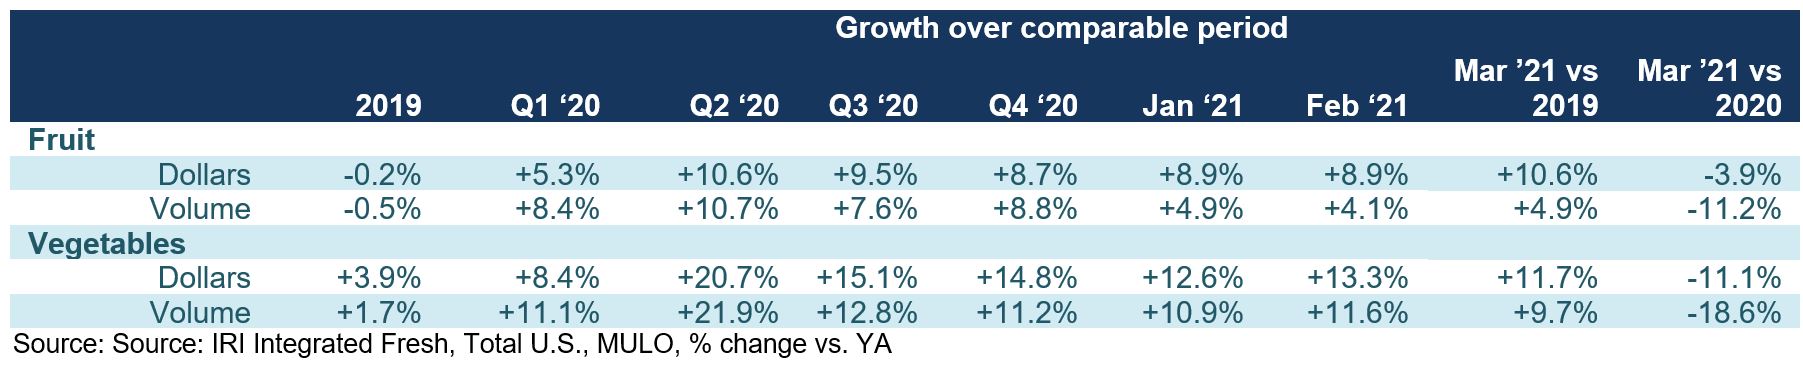
As Watson explained, prices for both fresh fruit and vegetables were up some 8% to 9% over March 2020 levels.
Fresh Fruit
“In fruit, the line up of the top 10 measured in dollar sales is fairly typical,” said Watson. “Berries are the untouchable number one, nearly doubling the sales of number two, apples. That is followed by the typical powerhouses of bananas, grapes and avocados. Citrus fruit continues to do very well with mandarins, oranges and lemons all in the top 10 in dollar sales.”
Seven out of the top 10 selling fruits lost ground versus the tremendous sales spikes of 2020. The notable exception is berries that in addition to being the biggest seller still managed robust sales increases both in the comparison to the 2019 pre-pandemic normal (+28.6%) and the year-on-year view (+9.2%). Melons and pineapples also increased sales versus those early pandemic weeks.

Fresh Vegetables
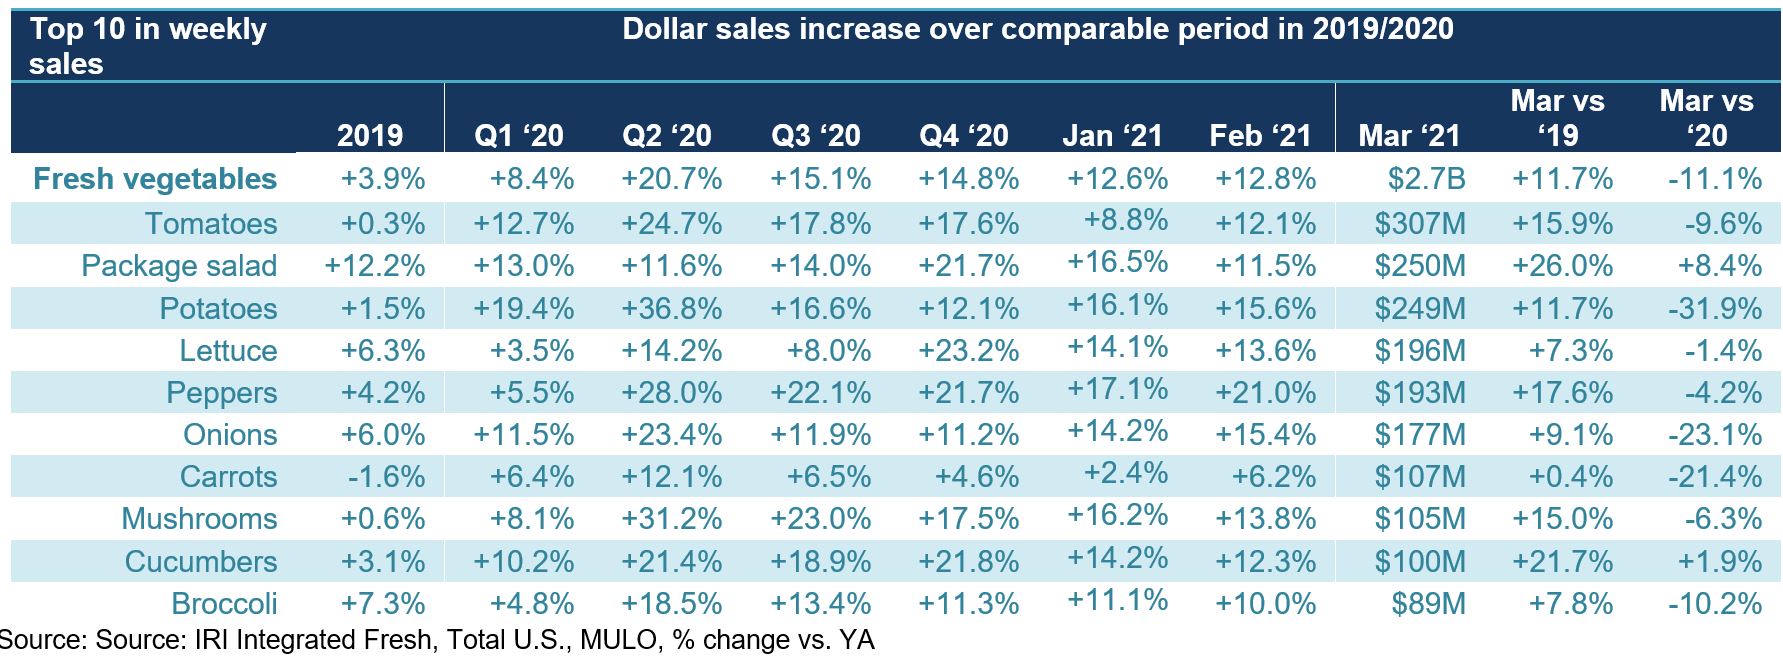
“Vegetables’ enormous strength in 2020 means that we’re seeing many down versus year-ago levels,” said Watson. “Yet, we see packaged salads’ dollar sales still ahead of those 2020 peaks, at +8.4% along with cucumbers that also managed a small gain, at +1.9%.” In comparison with the 2019 pre-pandemic base line, all vegetables are up, with the highest gain of 26.0% for packaged salads.
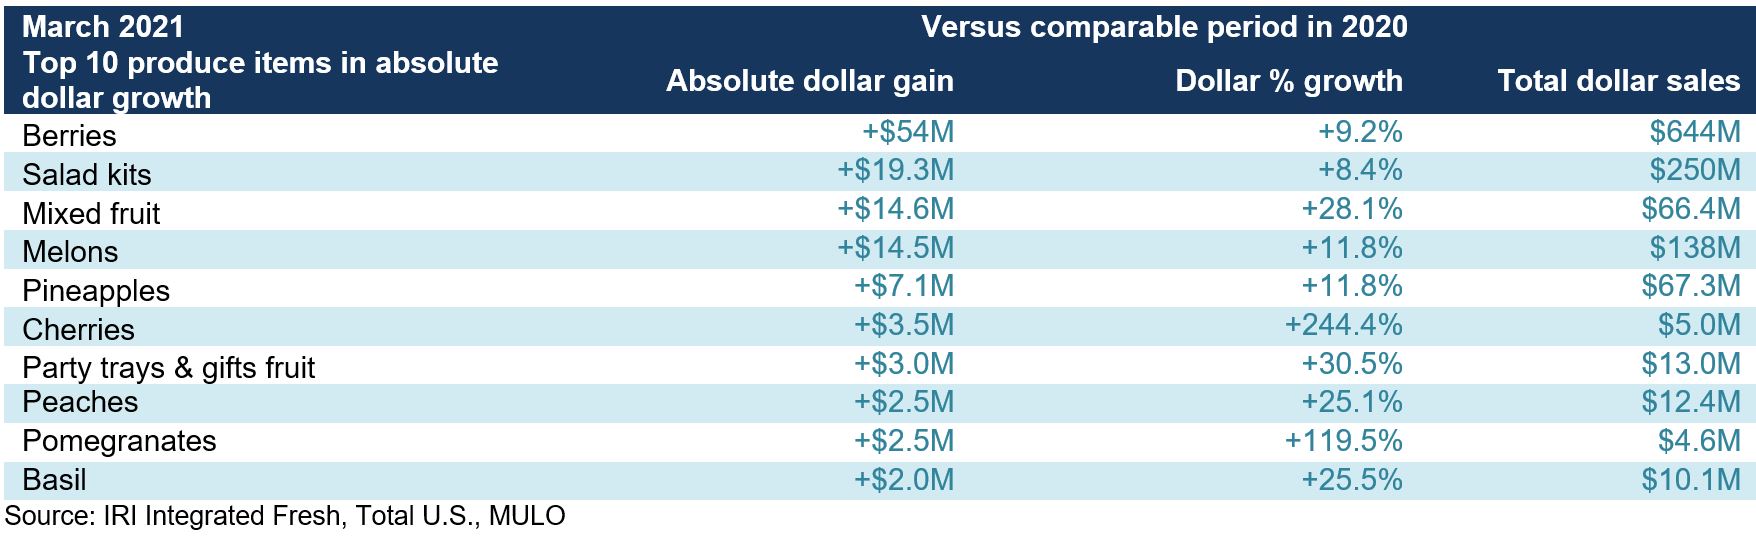
Absolute Dollar Gains
“Despite going up against huge March 2020, berries still managed to sell an additional $54 million in March 2021,” said Watson. “The strength of salads kits is also clear with an additional $19 million sold. And while the latter half of the top 10 in absolute dollar growth are mostly newcomers with small amounts compared to the strength of berries and salad kits, these still indicate interesting pockets of growth for 2021. Fresh herbs, represented by basil, have been a very exciting category as people are recreating restaurant meals at home and experimenting with new meats, for instance.”
Fresh versus Frozen and Shelf-Stable Fruits and Vegetables
While fresh fruit and vegetables dollar sales at retail only decreased 7.6%, both frozen and shelf-stable saw much greater declines due to going up against triple-digit increases in March 2020.

Perimeter Performance
A look across departments for the four weeks ending March 28, 2021 versus year ago shows a down performance for all, with the exception of seafood. Compared to the 2019 pre-pandemic performance baseline, all departments increased sales, reflecting continued strong everyday and holiday (Easter) demand.

Floral
The floral department’s pandemic path was very different from most departments. In March and April, in efforts to keep the shelves stocked, many retailers pulled back on floral orders. Yet, come the third quarter, floral proved it was a pandemic powerhouse in its own right. In fact, floral started outpacing produce growth come summer and has remained highly elevated ever since. In March 2021, dollar sales were 39% over year ago, when few retailers stocked floral. Importantly, floral sales also hold their own against the pre-pandemic 2019 baseline, with an increase of 26.7%.

What’s Next?
With an early Easter, on April 4, much of the Easter sales would have fallen in the March calendar month while the 2020 Easter season was heavily disrupted by shelter-in-place mandates in the vast majority of states.
Meanwhile, several indicators of consumer mobility — reflecting how much people are moving around to go to school, work, out to dinner, vacation or visit family and friends, etc.— are trending up. In March, TSA checkpoint numbers, OpenTable reservations, Apple driving and walking statistics, gasoline sales, the re-opening of schools and more are all indicating a higher level of consumer mobility. Increased mobility is also likely to result in a shift from home-centric food spending to greater foodservice engagement, but may also drive increased demand for time-saving, convenience focused solutions.
Other pertinent findings from the IRI survey with primary grocery shoppers conducted in March include:
- Working-from-home continues at highly elevated levels compared to pre-pandemic. As of March 2021, 44% of those who work at home some or all days a week believe they will continue to do so after getting the COVID-19 vaccine. This means a continuation of more at-home breakfasts and lunches and less dinner-time commuting.
- As of March 2021, 45% of younger school-aged children are still partaking in virtual education only. This share is slightly higher among teens, at 52%. These numbers continue to change as more school districts are experimenting with partial in-person schedules — impacting breakfasts and lunches.
- More consumers are comfortable in store, with the share saying they are “relaxed” up from 40% in May 2020 to 61% in March 2021. This goes hand-in-hand with an increase of the average time spent in the store. This creates a more favorable environment for new item introductions along with robust interest among consumers for meal solutions and meal preparation or assembly.
- The nation’s pent-up demand for eating out at restaurants is translating into 40% expecting to dine out as often or more often as they did before the pandemic. This is up from a low of 19% during July 2020. However, that still leaves 60% of consumers who continue to prepare meals at home more frequently than they did pre-pandemic.
- Online sales started spiking a little later than in-person sales in March and April 2020. The generally high satisfaction levels translate into 68% of online grocery shoppers believing they will continue to shop online at similar rates after being vaccinated. An additional 11% believe they may buy groceries online even more often. This bodes well for grocery e-commerce to be able to keep pace with the records set in 2020.
 The next report, covering April, will be released in mid-May. We encourage you to contact Joe Watson, PMA’s Vice President of Membership and Engagement, at jwatson@pma.com with any questions or concerns. Please recognize the continued dedication of the entire grocery and produce supply chains, from farm to retailer. #produce #joyoffresh #SupermarketSuperHeroes.
Date ranges:
2019: 52 weeks ending 12/28/2019
Q1 2020: 13 weeks ending 3/29/2020
Q2 2020: 13 weeks ending 6/28/2020
Q3 2020: 13 weeks ending 9/27/2020
Q4 2020: 13 weeks ending 12/27/2020
January: 5 weeks ending 1/31/2021
February: 4 weeks ending 2/28/2021
March: 4 weeks ending 3/28/2021
