The Consumer Price Index, released on Jan. 12, suggests month-over-month inflation is down slightly, at -0.1 percent, with food up slightly at 0.3 percent.
That’s not what you’ll see in media, particularly in social media, where people are trying to cope with the skyrocketing price of eggs (up 60 percent according to some reports, but much more than that based on the anecdotal evidence) with jokes and memes. The egg problem is being explained on multiple fronts, from higher feed costs, to avian flu, to consumers using eggs as protein replacements.
What I find most interesting about these reports isn’t the high prices. Numerator has some fantastic charts showing how consumer spending behavior has changed over the past year.
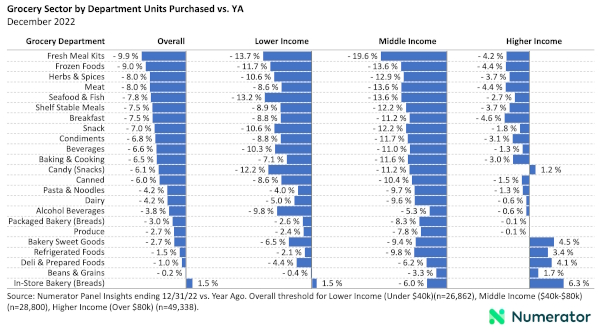
Meal kits are getting hammered across income segments, with overall spending on them down 9.9 percent, but middle income shoppers down nearly 20 percent. Frozen foods, too, are down 9 percent as consumers, presumably, are stocking up less.
Other categories topping the “less popular than last year” list are herbs and spices, meat, seafood and fish, shelf stable meals, breakfast, snacks, and condiments. The sriracha shortage probably didn’t help the condiment category’s sales this summer.
Produce fared well in this list, with overall units down only 2.7 across all income groups, though it was down a dismal 7.8 percent among middle income shoppers.
Only the in-store bakery (bread) category posted positive units year-over-year, according to Numerator, with high income shoppers buying 6.3 percent more than a year ago.
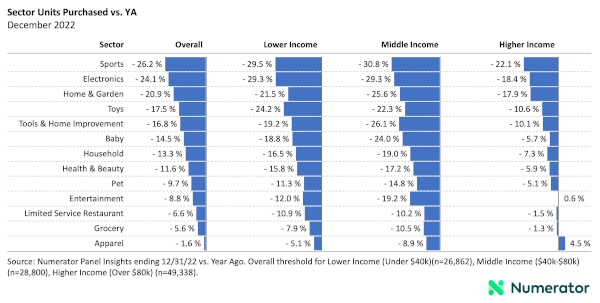
Food, in general, is bucking the downward spending trend, according to Numerator’s numbers. Units purchased in sports, electronic, and home & garden all dropped more than 20 percent year-over-year.
It looks like people are willing to stick with their existing electronics, and perhaps spruce up the garden a little less, trends I think we’ll see continue well into 2023.
The Consumer Price Index, released on Jan. 12, suggests month-over-month inflation is down slightly, at -0.1 percent, with food up slightly at 0.3 percent.
That’s not what you’ll see in media, particularly in social media, where people are trying to cope with the skyrocketing price of eggs (up 60 percent according to some reports, but much more than that based on the anecdotal evidence) with jokes and memes. The egg problem is being explained on multiple fronts, from higher feed costs, to avian flu, to consumers using eggs as protein replacements.
What I find most interesting about these reports isn’t the high prices. Numerator has some fantastic charts showing how consumer spending behavior has changed over the past year.
Meal kits are getting hammered across income segments, with overall spending on them down 9.9 percent, but middle income shoppers down nearly 20 percent. Frozen foods, too, are down 9 percent as consumers, presumably, are stocking up less.
Other categories topping the “less popular than last year” list are herbs and spices, meat, seafood and fish, shelf stable meals, breakfast, snacks, and condiments. The sriracha shortage probably didn’t help the condiment category’s sales this summer.
Produce fared well in this list, with overall units down only 2.7 across all income groups, though it was down a dismal 7.8 percent among middle income shoppers.
Only the in-store bakery (bread) category posted positive units year-over-year, according to Numerator, with high income shoppers buying 6.3 percent more than a year ago.
Food, in general, is bucking the downward spending trend, according to Numerator’s numbers. Units purchased in sports, electronic, and home & garden all dropped more than 20 percent year-over-year.
It looks like people are willing to stick with their existing electronics, and perhaps spruce up the garden a little less, trends I think we’ll see continue well into 2023.