

The November Marketplace
As one of the biggest food holidays in America, Thanksgiving sales make or break November in food retailing. According to the November IRI survey of primary shoppers, many Americans were back to celebrating like normal with an expected increase in the number of people in the party when compared to the last two years.
“COVID-19 seemed less of a concern in the planning of Thanksgiving celebrations this year,” said Jonna Parker, Team Lead Fresh, with IRI, “However, inflation did take a bite out of Thanksgiving spending and for some categories this was a substantial one. Generationally speaking, fresh produce held its own with units and volume trending close to year ago levels.”
- The mid-November IRI consumer study found that one in five Americans were worried about being able to afford the type of Thanksgiving celebration they usually have because of inflation. Worries were significantly higher among Gen Z and Millennials, at 30% and 26% versus only 12% among Boomers. “Some chains made a media splash and attracted new feet to their stores by bringing prices for key Thanksgiving items down to prior year levels,” Parker noted. “But overall, prices were up more than +14% over 2021 levels in the two weeks before Thanksgiving.”
- According to IRI November multi-outlet point-of-sale data, beverages had the most modest price increases, at +5.0%, followed by meat, at +11.4%. The highest price inflation was seen for holiday sides and baked goods.
- Importantly, throughout the pandemic, the full week before the holiday week had generated the biggest shopping volume, but pre-pandemic patterns are back. According to the IRI multi outlet sales data, the week of the holiday was once more the heaviest shopping week for Thanksgiving 2022.
- The pre-holiday week generated the biggest shopping volume for fresh produce. “Sales peaked the week ending November 20th, with weekly fresh produce sales of $1.49 billion,” Parker explained. “This likely means similar patterns for the end-of-year holidays.”
- Historically, many categories see a significant lift in sales in the runup to Thanksgiving. Based on an IRI study of the past five years’ of Thanksgiving, big winners include frozen and refrigerated whipped toppings, potatoes and yams, canned green beans, dinner rolls, stuffing ingredients and, of course, ham and turkey. While dollar sales are up for all historic holiday spike categories, volume is down in most. “The average dollars per trip for fresh produce were up +2.9% versus 2021 whereas fresh produce prices are up +5.6%,” Parker noted. “Shoppers are managing their grocery spend by purchasing less or smaller packages.”
- At the same time, some Americans needed a cooking break and sourced their Thanksgiving meal from restaurants. While a mere 5% ate their Thanksgiving meal on premise, 18.2% of Thanksgiving meals were sourced from foodservice according to the IRI November shopper survey. “This is a lost opportunity for retail,” noted Joe Watson, IFPA’s VP, Retail, Foodservice and Wholesale. “Grocery stores have a plethora of value-added, ready-to-eat and heat-and-eat options available in fresh produce and beyond, but it is important to go that extra step by connecting the dots for shoppers to underscore the ease of mixing and matching scratch with convenience-focused items and get that very important Thanksgiving ring.”
- The hybrid meal, in which consumers made some Thanksgiving meal items from scratch and used semi- and fully-prepared items for others, was popular this year. Only 33.4% of Americans in the mid-November IRI survey were planning to prepare a fully homemade meal, leaving two-thirds of meals that integrated ready-to-eat and heat-and-eat options sourced from grocery stores, meal kits or restaurants.
- The IRI survey also noted how Thanksgiving meal traditions vary across the United States. The Northeast is more likely to serve cranberries and pumpkin pie, whereas the Southeast likes their apple pie and Brussels sprouts.
For the everyday meal occasion shoppers also balance home-prepared meals with restaurant-prepared options.
- Consumers estimate that 78.9% of all meals are prepared in the home, according to the IRI November consumer survey. This is slightly higher than it has been, driven by very high percentages among Boomers and seniors.
- Eight in 10 Americans have purchased from restaurants in the past month. Takeout (53%) and on-premise dining (51%) are the most popular. Restaurant delivery is more important among Gen Z (30%) than Boomers (11%).
- Inflation plagues everyday grocery purchases also, with IRI’s November survey respondents identifying eggs, milk and produce as the top areas of having higher prices than last year. Fresh produce jumped over meat and poultry in perceived areas of high inflation. “This is interesting as fresh produce overall has fairly moderate inflation compared to center store. The perception is likely driven by a few of the Thanksgiving staples, including potatoes, having above-average inflation in addition to the overall price perception of fresh versus that of canned and frozen,” noted Watson.
- A record-high 96% of consumers are concerned about the price increases, resulting in 84% of consumers are making changes to their grocery shopping to manage inflation — which is also a record high. Popular money-saving measures are buying sales specials, cutting back on non-essentials and buying store brands. At the same time, 54% of shoppers say fewer of the items they want are on sale and 50% believe the items are not discounted as much. “Promoting when we can in relevant items and relevant ways is key right now,” Watson said. “Three- or one-day promotions, mix and match or meal bundles can help underscore the value of a home-cooked fresh meal.”
Amid the continued disruption, IRI, 210 Analytics and IFPA remain committed to bringing the industry the latest trends and analysis in fresh produce.
Inflation Insights
The price per unit across all foods and beverages in the IRI-measured multi-outlet stores, including supermarkets, club, mass, supercenter, drug and military, increased 13.6% in November (the four weeks ending 11/27/2022). This increase was virtually unchanged from +13.7% in October. November year-on-year inflation was +17.0% in the center of the store (grocery) and +11.3% for perishables. Compared with November 2019, prices across all foods and beverages were up +28.7%.
| Average price/unit vs. YA | Q1 21 | Q2 21 | Q3 21 | Q4 21 | Q1 22 | Q2 22 | Q3 22 | Nov 22 |
| Total food and beverages | +5.5% | +2.7% | +5.0% | +8.0% | +9.9% | +11.9% | +14.0% | +13.6% |
Fresh produce prices were also up from last year, but a relatively low +5.3% level on a per-unit basis and +5.6% on a per-pound basis. This is far below the total store average. The deceleration is driven by fruit, for which prices increased a low +3.2%. Additionally, vegetable inflation dropped into the single digits, at +7.7% year-on-year.
| Price per volume (lbs) | Price/volume | Change vs. 2021 | Change vs. 2019 |
| Total fresh produce November 2022 | $1.83 | +5.6% | +17.2% |
| Total fresh produce latest 52 weeks | $1.76 | +9.2% | +15.6% |
| Fresh fruit November 2022 | $1.85 | +3.2% | +15.8% |
| Fresh fruit latest 52 weeks | $1.82 | +10.4% | +18.5% |
| Fresh vegetables November 2022 | $1.69 | +7.7% | +18.7% |
| Fresh vegetables latest 52 weeks | $1.93 | +8.0% | +12.9% |
November 2022 Sales
The four November 2022 weeks brought $61.1 billion in total food and beverage sales — far more than a typical month. November sales were up +10.4% versus year ago and +29.1% versus November 2019, the pre-pandemic normal. Perishables, including produce, seafood, meat, bakery and deli, had a slightly below-average dollar performance that was largely related to below-average inflation. Center-store item sales increased a little over +11%.
| November 2022 | % sales change versus year ago | |||||||
| Dollar size | Dollars vs. 2021 | Dollars vs. 2020 | Dollars vs. 2019 | Units vs. 2021 | Units vs. 2020 | Units vs. 2019 | ||
| Total food and beverages | $61.6B | +10.4% | +15.9% | +29.0% | -2.8% | -5.5% | +0.3% | |
| Total grocery (center store) | $30.5B | +13.2% | +19.2% | +34.1% | -3.3% | -6.1% | +0.1% | |
| Total perishables | $27.4B | +8.8% | +14.5% | +26.3% | -2.2% | -4.7% | +0.7% | |
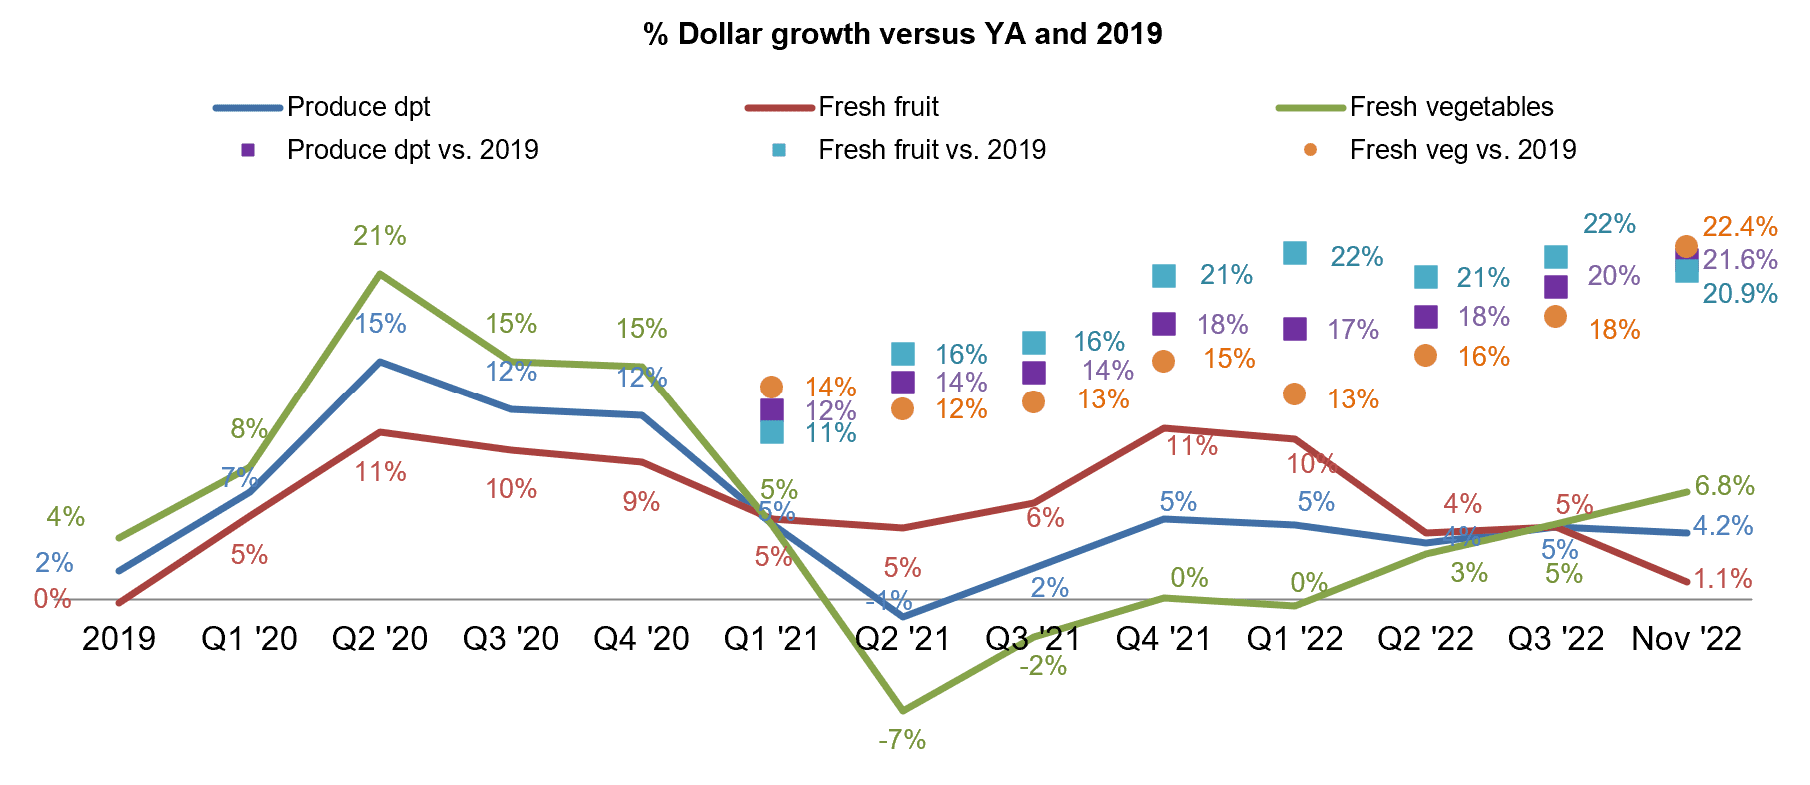
November 2022 fresh produce sales reached $5.2 billion, surpassing the record set the prior year by +4.2%. The dollar increase was driven by inflation; however, unit and volume declines versus November 2021 were relatively mild compared to those seen in other departments. “This could be a signal that moderating prices are starting to strengthen demand,” noted Parker. “Fresh fruit, in particular, is starting to trend very close to year ago levels. November and December have the heavily holiday impact on sales, but these are positive signs nonetheless.”
| November 2022 | $ size | $ growth vs. ‘21 | $ growth vs. ‘19 | Unit growth vs. ‘21 | Unit growth vs. ‘19 | Volume growth vs. ‘21 | Volume growth vs. ‘19 |
| Total fresh produce | $5.521B | +4.2% | +21.6% | -1.0% | +5.1% | -1.3% | +3.7% |
| Fresh fruit | $2.422B | +1.1% | +20.9% | -0.4% | +7.3% | -2.0% | +4.4% |
| Fresh vegetables | $3.012B | +6.8% | +22.4% | -1.4% | +3.8% | -6.7% | +3.1% |
Thanksgiving week was actually one of the smaller selling November weeks with produce sales peaking the week ending November 20th. Gains versus year ago were fairly consistent with pounds going positive versus 2021 in the second November week.
| Produce department | Dollar sales | $ vs. YA | lbs vs. YA |
| November 2022 | $5.521B | +4.2% | -1.3% |
| w.e. 11/7/2022 | $1.332B | +6.0% | +0.2% |
| w.e. 11/13/2022 | $1.342B | +4.1% | -1.2% |
| w.e. 11/20/2022 | $1.448B | +3.1% | -2.4% |
| w.e. 11/27/2022 | $1.399B | +3.8% | -1.6% |
“Growth for fruit is slowing down due to moderating levels of inflation,” said Watson. “As fruit is starting to trend very close to 2021 levels in volume, I fully expect to see that trend line starting to level out soon. Compared with 2019, both fresh fruit and vegetables are now trending about +21% above pre-pandemic levels.”
Fresh Produce Share of Total Fruits and Vegetables
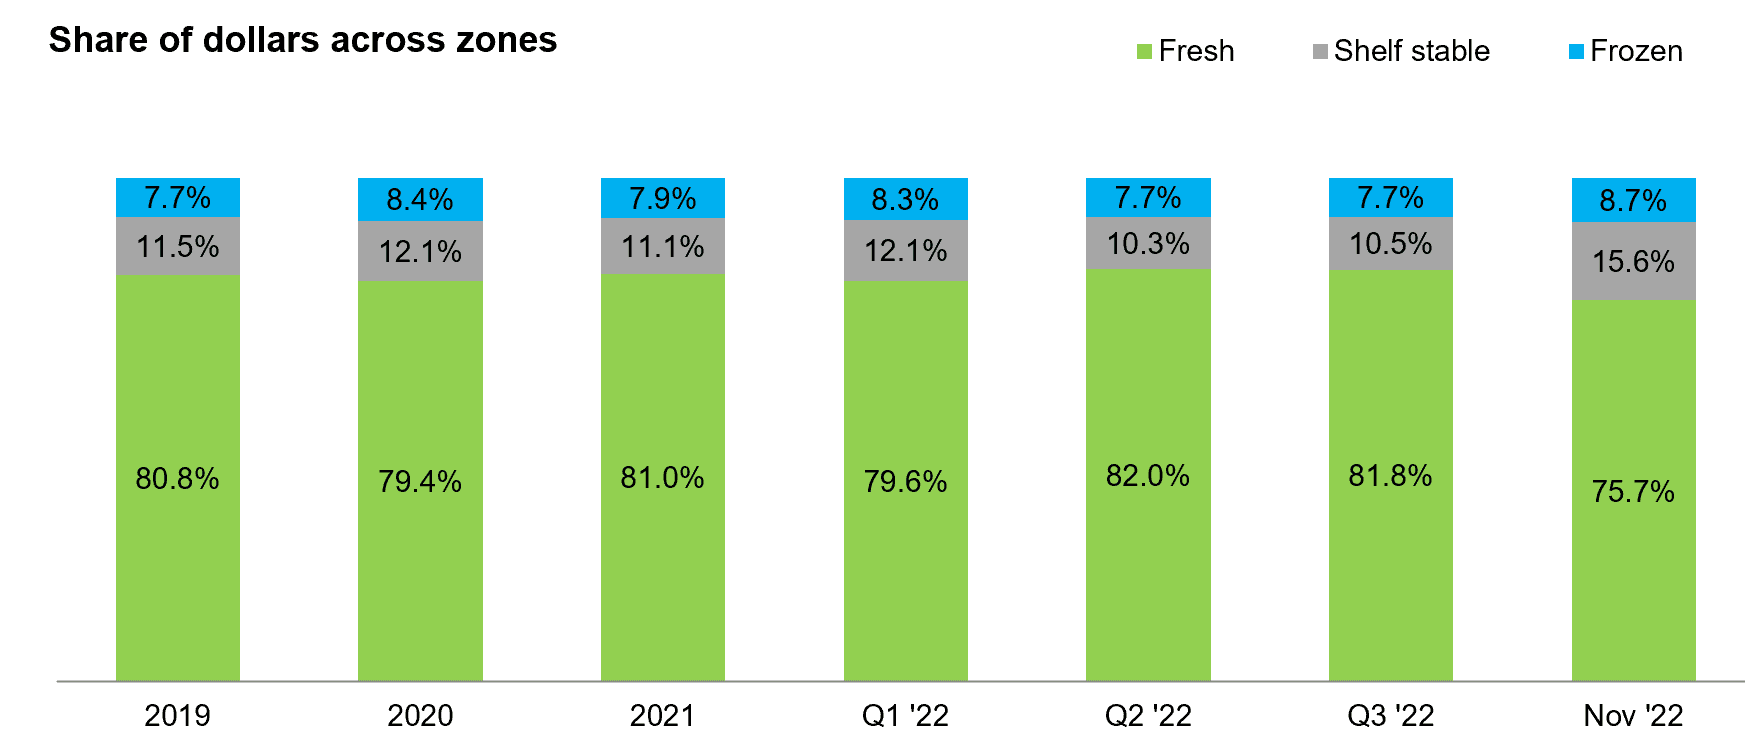
“The fresh share of total fruits and vegetables dropped further in October 2022,” Watson commented. “In September, the fresh share of fruits and vegetables dropped to 80.2% and in November it hit 75.7% — a level not seen since 2020. Different levels of inflation certainly played a role, but the share of pounds were also down to around 76%. Certainly, we know that perception is reality and consumers often associate fresh with being more expensive, whether it is or not. A focus on overall value, not price alone, in combination with health and nutrition, may be a favorable strategies as economic pressure persists.”
| November 2022 | Dollar sales | Dollar sales gains vs. 2021 | Dollar sales gains vs. 2019 | Average price per unit | Increase price vs. YA |
| Fresh produce department | $5.5B | +4.2% | +21.6% | $2.54 | +5.3% |
| Frozen fruits and vegetables | $631M | +15.5% | +29.4% | $3.00 | +23.5% |
| Shelf stable fruits | $457M | +14.2% | +28.9% | $2.89 | +21.6% |
| Shelf stable vegetables | $686M | +15.7% | +23.1% | $1.48 | +20.5% |
Thanksgiving buying patterns, such as canned green beans, cranberries and corn, in combination with the below-average rate of inflation for fresh produce meant a drop in the share of fresh fruit and vegetables (75.7%) versus the share represented by frozen (8.7%) and shelf-stable (15.6%). Prices for frozen fruit and vegetables increased +23.5% in November 2022 versus 2021. Fresh produce sales represented 74.9% of total pounds sold across the three zones.
Fresh Produce Dollars versus Volume
Fresh produce pound sales have trailed behind year ago levels since March 2021, but volume moved much closer to year ago levels in November 2022. While down 1.3%, this is the best performance since the first quarter of 2021.
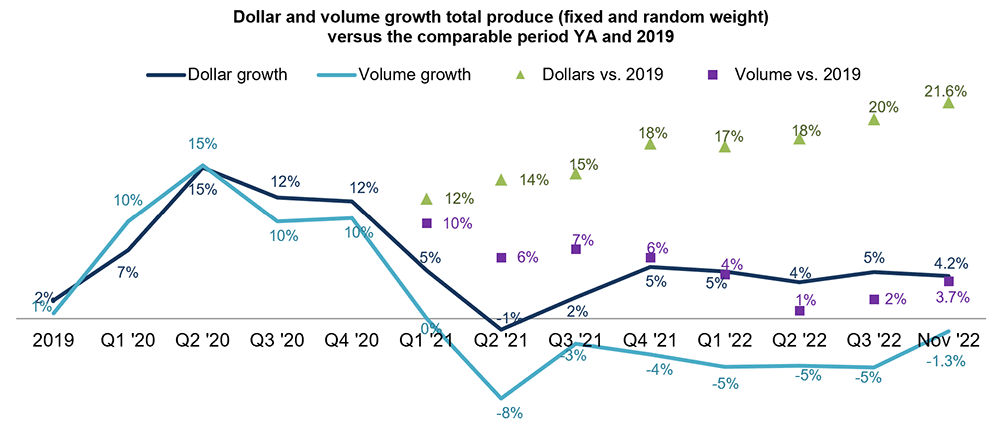
The overall produce volume pressure is driven equally by both fruit and vegetables. Fruit pounds were down -0.8% year-on-year in November, while vegetable volume sales were also off -0.8%. Both remained above 2019 levels.
Fresh Fruit Sales in October
“Apples, avocados and citrus came on strong in November,” Parker said. “Whereas berry sales are double that of other categories in the summer months, apples are up there now with monthly sales of $372 million. In addition to the seasonal apple sets, apples’ price-per-pound is often lower than other snackable fruits, likely making it attractive to inflation-weary shoppers.” Oranges and mandarins made it back in the top 10 sellers. Mixed fruit dropped a few places to end in ninth.
| Top 10 in sales | Dollar sales increase over comparable period YA | ||||||||||||||||
| 2019 | 2020 | Q1 21 | Q2 21 | Q3 21 | Q4 21 | Q1 22 | Q2 22 | Q3 22 | Nov 22 | $ vs YA | lbs vs YA | ||||||
| Fresh fruit | -0.2% | +9% | +5% | +5% | +6% | +11% | +10% | +4% | +4.6% | $2.4B | +1.1% | -2.0% | |||||
| Berries | +4% | +14% | +11% | +9% | +11% | +17% | +15% | +5% | +1.6% | $551M | -1.8% | +2.2% | |||||
| Apples | +0% | +2% | -1% | +3% | +9% | +8% | +8% | +7% | +2.5% | $372M | +2.3% | -4.2% | |||||
| Grapes | -3% | +0% | +3% | +4% | +7% | +12% | +5% | +6% | +2.3% | $297M | +1.2% | -2.8% | |||||
| Bananas | -1% | +4% | -1% | -2% | +4% | +3% | -1% | -2% | +3.6% | $246M | +4.9% | -0.1% | |||||
| Avocados | +7% | +8% | -1% | -9% | -3% | +10% | +17% | +11% | +5.8% | $159M | -5.4% | +2.4% | |||||
| Mandarins | -5% | +10% | -1% | +14% | +12% | +5% | +0% | -14% | -3.1% | $137M | -3.0% | -1.5% | |||||
| Melons | +1% | +10% | +10% | +14% | +6% | +23% | +28% | +7% | +8.3% | $134M | +3.1% | -8.1% | |||||
| Oranges | -10% | +32% | +3% | -25% | -10% | +4% | +15% | +14% | -2.9% | $80M | +1.7% | -8.4% | |||||
| Mixed fruit | -1% | -10% | +8% | +59% | +29% | +30% | +18% | +4% | -2.3% | $70M | +3.1% | -2.2% | |||||
| Pineapple | +0% | +8% | +12% | +11% | +8% | +12% | +12% | +11% | +7.1% | $66M | +7.2% | +1.9% | |||||
Fresh Vegetables Sales in November
“November sales brings on the Thanksgiving powerhouses,” said Watson. “Potatoes and onions trended in the top three sellers and celery was the November newcomer bumping broccoli out of the top 10 sellers.”
| Top 10 in sales | Dollar sales increase over comparable period YA | |||||||||||||||
| 2019 | 2020 | Q1 21 | Q2 21 | Q3 21 | Q4 21 | Q1 22 | Q2 22 | Q3 22 | Nov 22 | $ vs YA | lbs vs YA | |||||
| Total veg | +4% | +15% | +5% | -7% | -2% | +0% | -0% | +3% | +5% | $3.0B | +6.8% | -0.8% | ||||
| Potatoes | +2% | +21% | -4% | -20% | -5% | +0% | +5% | +13% | +19% | $367M | +19.2% | -2.3% | ||||
| Tomatoes | +0% | +18% | +4% | -9% | -4% | -1% | -5% | -0% | +2.5% | $292M | +8.8% | +1.8% | ||||
| Onions | +6% | +15% | +1% | -14% | -2% | +1% | +6% | +18% | +22% | $252M | +16.9% | +4.1% | ||||
| Salad kits | +12% | +15% | +13% | 15% | +10% | +9% | +2% | +2% | +0% | $232M | -0.4% | -9.0% | ||||
| Lettuce | +6% | +12% | +9% | -3% | +3% | +1% | +5% | +10% | +9% | $231M | +14.0% | +2.7% | ||||
| Peppers | +4% | +19% | +12% | -7% | -3% | -2% | -2% | -1% | +2% | $186M | +3.7% | -0.8% | ||||
| Carrots | -2% | +7% | -5% | -8% | 0% | +1% | +4% | +4% | +4% | $115M | +3.0% | -1.2% | ||||
| Cucumbers | +3% | +18% | +10% | +3% | +4% | +5% | +4% | +6% | +8% | $102M | +13.8% | +4.2% | ||||
| Mushrooms | +1% | +20% | +9% | -13% | -9% | -6% | -6% | -4% | -4% | $100M | -3.0% | -10.7% | ||||
| Celery | +25% | -4% | +3% | -8% | -3% | 0% | -3% | +7% | +5% | $99M | +3.1% | -0.2% | ||||
Fresh Produce Absolute Dollar Gains
In November 2022, fresh fruit added $27 million in additional dollars versus 2021 and fresh vegetables added $192 million. Gains were achieved in many different ways. Potatoes, onions, and lettuce each had double-digit price per pound inflation when comparing the average in November 2021. Others gained on strong demand with dollar gains far above the rate of inflation, including limes, garlic, cucumbers, tomatoes and onions.
| November 2022 | Versus comparable period in 2021 | ||||
| Top 10 produce items in absolute dollar growth | Absolute dollar gain | Dollar % growth | Total dollar sales | Change in price per pound | |
| Potatoes | +$59M | +19.2% | $367M | +22.0% | |
| Onions | +$36M | +16.9% | $252M | +12.3% | |
| Lettuce | +$28M | +14.0% | $231M | +11.0% | |
| Tomatoes | +$24M | +8.8% | $292M | +6.8% | |
| Cucumbers | +$12M | +13.8% | $102M | +9.3% | |
| Bananas | +$11M | +4.9% | $246M | +5.0% | |
| Apples | +$9M | +2.3% | $372M | +6.8% | |
| Peppers | +$7M | +3.7% | $186M | +4.5% | |
| Garlic | +$5M | +14.3% | $38M | +5.6% | |
| Limes | +$5M | +10.8% | $48M | +4.1% | |
Perishables Performance
With heavy inflation in eggs and other dairy items, the total refrigerated department generated a +20.6% increase in sales to reach $7.5 billion in November. However, unit sales were down much like the other departments. Fresh produce moved closest to year-ago levels and also had the strongest unit performance when compared to the pre-pandemic normal. Seafood, by far the smallest seller, continued to trend in negative territory despite price deflation.
| November 2022 | $ sales | Change vs. YA | Change vs. 2YA | Change vs. 3YA | Unit sales | Change vs. YA | Change vs. 2YA | Change vs. 3YA |
| Bakery | $3.4B | +12.2% | +21.9% | +27.9% | 925M | -3.3% | -2.9% | -5.5% |
| Deli | $3.5B | +7.2% | +20.9% | +23.5% | 580M | -3.6% | +1.3% | +2.2% |
| Meat | $7.0B | +1.9% | +6.3% | +23.3% | 1.0B | -2.1% | -8.7% | -0.2% |
| Produce | $5.5B | +4.2% | +9.0% | +21.6% | 2.2B | -1.0% | -4.3% | +5.1% |
| Refrigerated (mostly dairy) | $7.5B | +20.6% | +23.0% | +34.3% | 2.0B | -2.5% | -4.9% | -0.7% |
| Seafood | $438M | -4.5% | -4.2% | +23.0% | 48M | -7.2% | -18.1% | +0.9% |
What’s Next?
Thanksgiving holiday shopping and consumption patterns provide a glimpse at what the Winter holiday season may look like. According to the IRI November survey, consumers are split between being excited to have something to celebrate and pulling back on spending given the reduction in purchasing power.
Meals do remain central to celebrations. For Christmas, 22% prepare a special meal for just their household and 17% host or attend a meal with friends or family outside of the immediate household. Others go on a vacation, travel or had not yet made plans in the November survey for the December holidays.
The next report, covering December, will be released in mid-January. In addition to the data provided here, the IFPA also now offers InSite – an online interactive data set covering both produce and floral performance as well as a look at the 2021 consumer sentiment surveys. Start your free trial today! See www.freshproduce.com/insite for more detail. We also encourage you to contact Joe Watson, IFPA’s VP, Retail, Foodservice and Wholesale, at jwatson@freshproduce.com with any questions or concerns. Please recognize the continued dedication of the entire grocery and produce supply chains, from farm to retailer. #produce #joyoffresh #SupermarketSuperHeroes.
Date ranges:
- 2019: 52 weeks ending 12/28/2019
- 2020: 52 weeks ending 12/27/2020
- Q1 2021: 13 weeks ending 3/28/2021
- Q2 2021: 13 weeks ending 6/27/2021
- Q3 2021: 13 weeks ending 9/26/2021
- Q4 2021: 13 weeks ending 12/26/2021
- Q1 2022: 13 weeks ending 3/27/2022
- Q2 2022: 13 weeks ending 6/26/2022
- Q3 2022: 13 weeks ending 9/25/2022
- September 2022: 4 weeks ending 9/25/2022
- October 2022: 5 weeks ending 10/30/2022
- November 2022: 4 weeks ending 11/27/2022
Note: The October data reflects a substantial data restatement across all areas of the store. 2019-Q3 2022 reflect the prior data universe.
