

The September Marketplace
“Life remained home-centric in late summer,” said Jonna Parker, Team Lead, Fresh with IRI. “An estimated 78% of all meal occasions are being prepared at home. While this is down 10 points from the very start of the pandemic, the high inflationary levels are keeping the food dollar largely at retail. Consumers are certainly still eating at restaurants, but not as often and they are adapting what they order.”
- 82% of American households bought at least one restaurant meal in September, with the highest restaurant penetration among higher-income households, at 91%. Only 69% of households who are earning less than $25,000 annually ate at restaurants at least once in September. Restaurant engagement is lower also in the Midwest and among older shoppers.
- Takeout continues to be big, with 54% having ordered meals to go. Additionally, 18% have ordered from a restaurant for home delivery (down two points from August). Home delivery is much more popular among high-income households as well as the youngest shoppers. Half of American households have eaten restaurant food on premise. For October, 54% of consumers expect they will eat out as often, while 24% believe they will buy from restaurants less.
- When purchasing groceries, 83% of consumers shopped in person, down from 85% in August. Online shopping was near equally divided between click-and-collect (10%) and home delivery (8%). Shoppers are not expecting a major change in their in-person versus online shopping: 4% expect they will buy all groceries online in the next few weeks and months, while 68% believe they will buy all groceries in person. The estimates among the remaining 28% range from expecting to buy most groceries (8%) to only some (7%) online.
- Spending continues to be affected by out-of-stocks, with 38% of shoppers mentioning examples of items they meant to buy but were out of stock, ranging from carbonated drinks to milk, canned goods, eggs and chicken. At the same time, when items are available for purchase, 40% stock up on staples out of concern for rising prices or the item being unavailable next time they shop. “These stocking up behaviors prompt more imbalance throughout the store,” Parker explained. “Some retailers are once more implementing purchase limits on tight categories to prevent being out-of-stock.”
- In line with reality, price perceptions among consumers remain very high with 94% believing grocery prices are somewhat or a lot higher than before. “Additionally, 94% of consumers are concerned about inflation, a far greater percentage than people being concerned about COVID-19 at this point in time,” Parker added. Eight in 10 shoppers (78%) are making changes to their shopping choices due to increased prices. The most popular money-saving measures are looking for sales/deals more often (49%), cutting back on non-essentials (43%), looking for coupons (30%) and buying store-brand items more often (28%). “These are important findings,” said Joe Watson, VP, Retail, Foodservice & Wholesale for IFPA BB #:378962. “As shoppers are looking for ways to stretch their food dollar, fresh produce can be a budget hero compared to other parts of the meal.”
- Despite the high gasoline prices, 15% switched some of their shopping to a lower-cost retailer and/or visit multiple stores to get the best deals. This cherry-picking behavior may be driven by 55% of consumers reporting that fewer of the items they are looking for are on sale and 44% feel that items are not discounted as much as they used to be.
“Inflation, drought conditions in the West, Hurricane Ian in the Southeast, record low consumer confidence and more are keeping grocery supply and demand patterns in flux,” Watson noted. “Amid the continued disruption, IRI, 210 Analytics and IFPA remain committed to bringing the industry the latest trends and analysis in fresh produce.”
Inflation Insights
The price per unit across all foods and beverages in the IRI-measured multi-outlet stores, including supermarkets, club, mass, supercenter, drug and military, increased 14.0% over the third quarter of 2022 and 14.3% in the month of September (the four weeks ending 9/25/2022). September inflation was +17.4% in the center of the store (grocery) and +12.3% for perishables. Compared with August 2019, prices across all foods and beverages were up 27.9%.

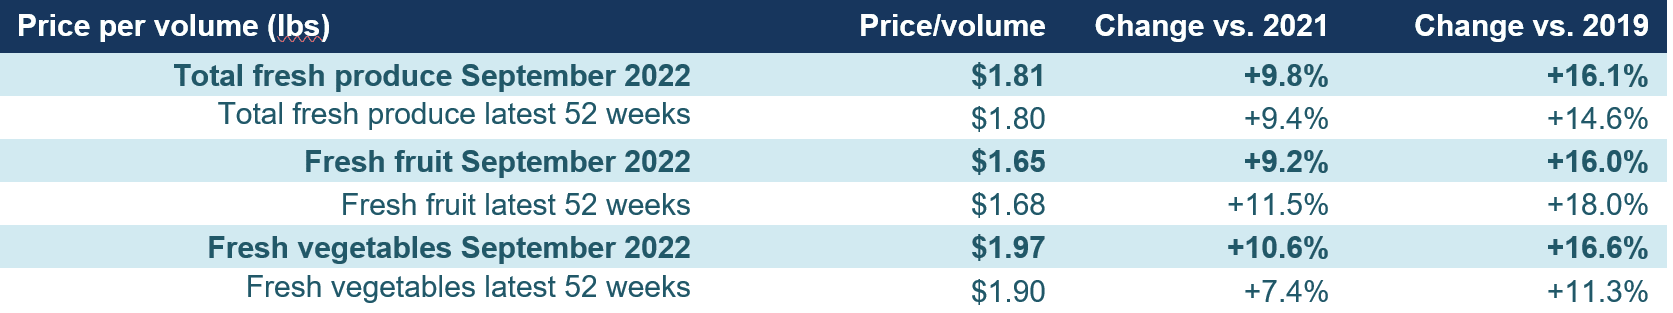
Fresh produce prices were also up from last year, at +9.3% level on a per-unit basis and +9.8% on a per-pound basis. This is far below the total store average. While in the past few months fruit inflation was much lower than that of vegetables, price increases in September were slightly higher for vegetables.
September 2022 Sales
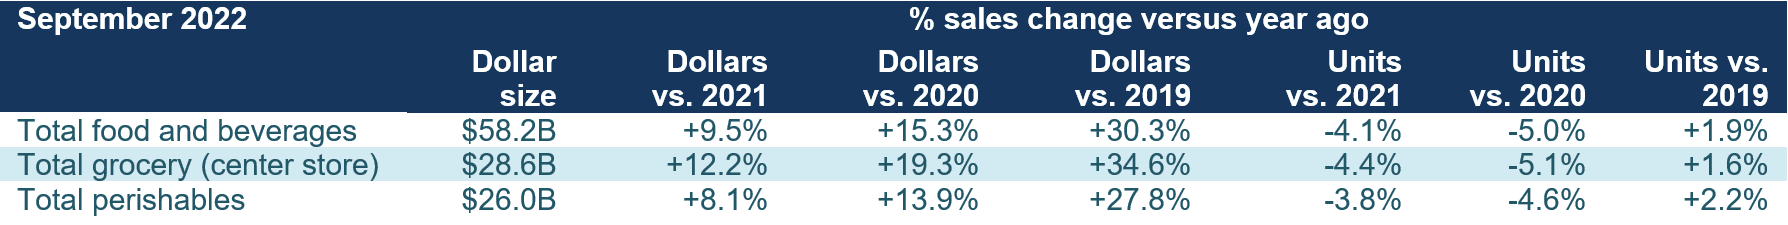
The four September 2022 weeks brought $58.2 billion in total food and beverage sales, which was up +9.5% versus year ago — an improvement over the August performance. September 2022 dollar sales were up +30.3% versus September 2019, the pre-pandemic normal. Perishables, including produce, seafood, meat, bakery and deli, had a slightly below-average dollar performance, but center-store item sales increased a little over 12%. A lot of the dollar growth performance was closely related to the levels of inflation, which were higher in grocery.
Year-on-year gains were inflation-boosted, with unit sales down -4.1%. Unit declines have averaged between 4% and 5% for several months now. Units did recover above 2019 levels with the strongest performance for perishables.
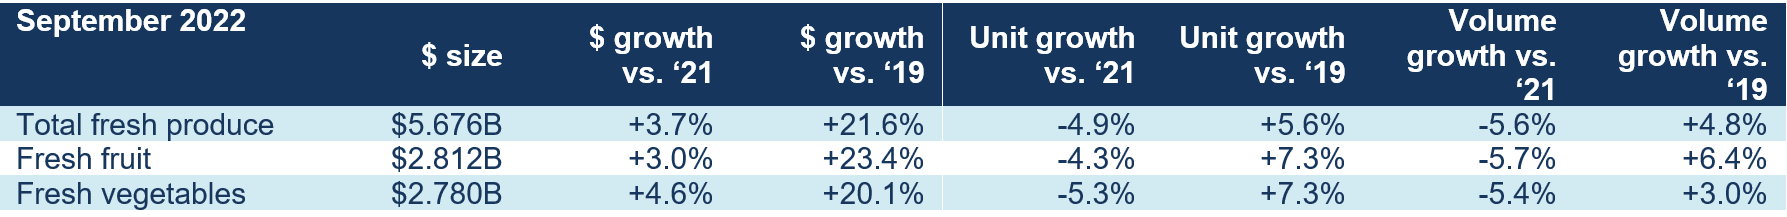
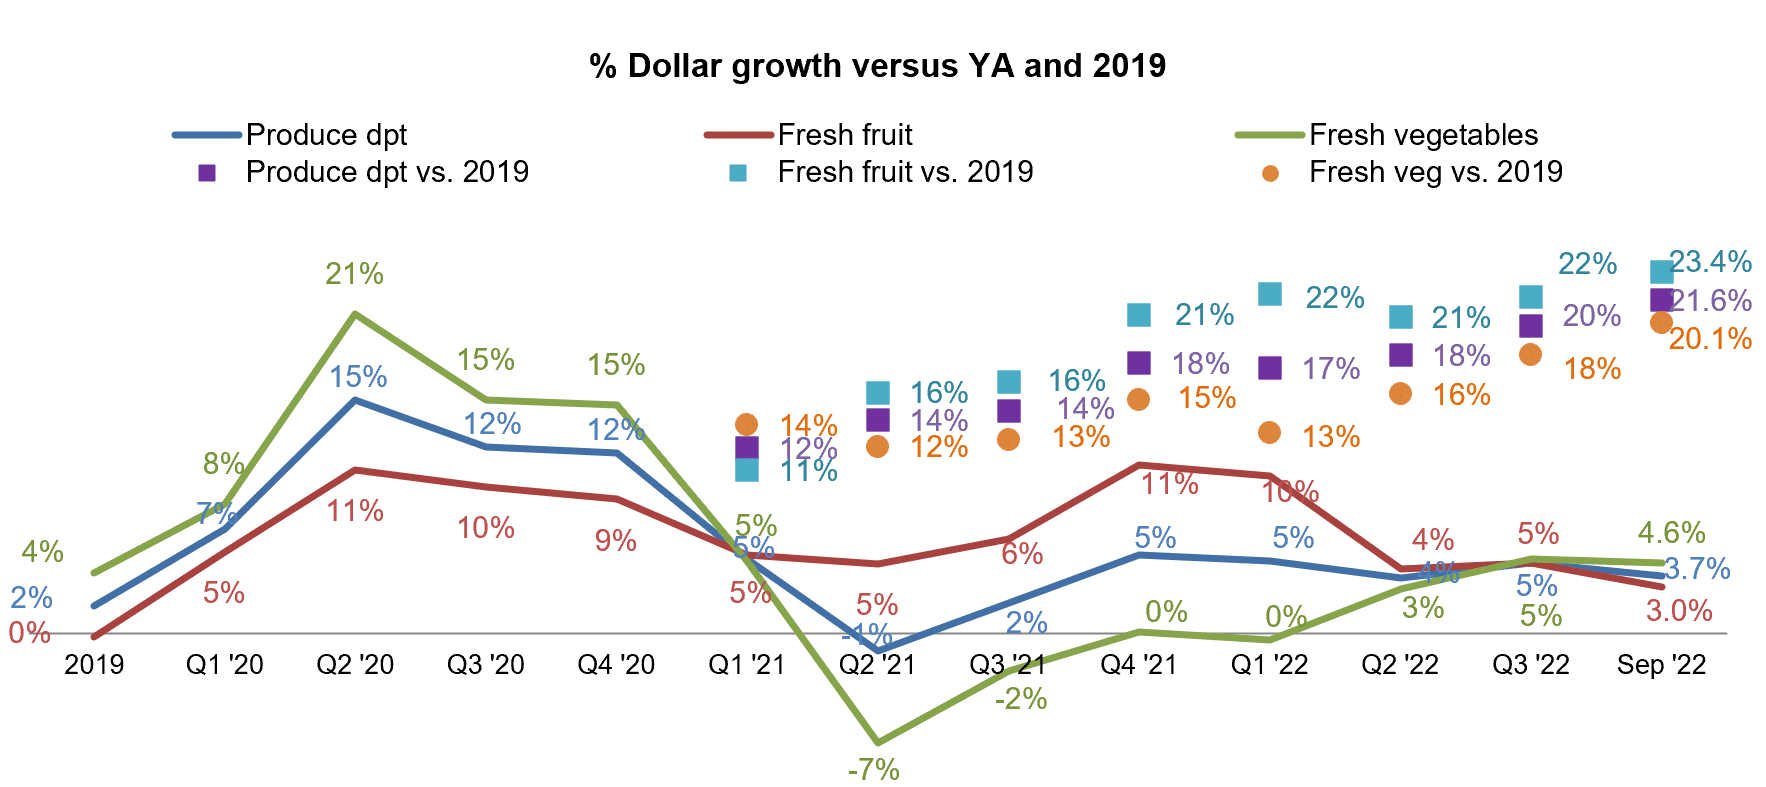
September 2022 fresh produce sales reached $5.7 billion, surpassing the record set the prior year by +3.7%. However, looking beyond dollars that were highly affected by inflation, unit and volume declined versus September 2021 by around 5%. “Volume declines are steeper than unit declines,” noted Parker, “which may point to consumers moving to smaller pack sizes. We are seeing this in the meat department as well.” The drought conditions may have an impact on these numbers as weather-induced discoloration, bruises or burns are impacting yields. In turn, this can impact in-store availability and price points on lower-quality items.
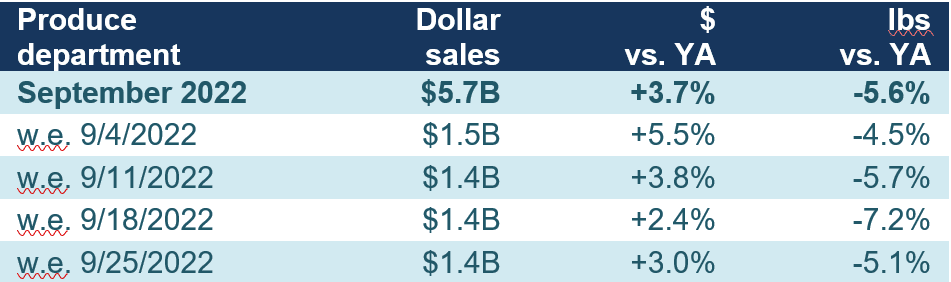
Fresh produce sales tapered off from $1.497 billion the first full week of September to $1.372 billion the fourth week ending September 25th. With it, the year-on-year growth rates fell from a high of +5.5% to as low as +2.4%. Year-on-year volume declines averaged between 4.5% and 7.2%. “September continued a pattern of high gasoline and food inflation and pressure on produce units and volume continues,” Parker noted. “At the same time, we have to keep in mind that both units and volume are still ahead of 2019.”
“Vegetables are taking over as the top area of growth,” said Watson. “Given the substantial increases in price versus pre-pandemic, the gains over 2019 are now trending in the low to mid-twenties.”
Fresh Produce Share of Total Fruits and Vegetables
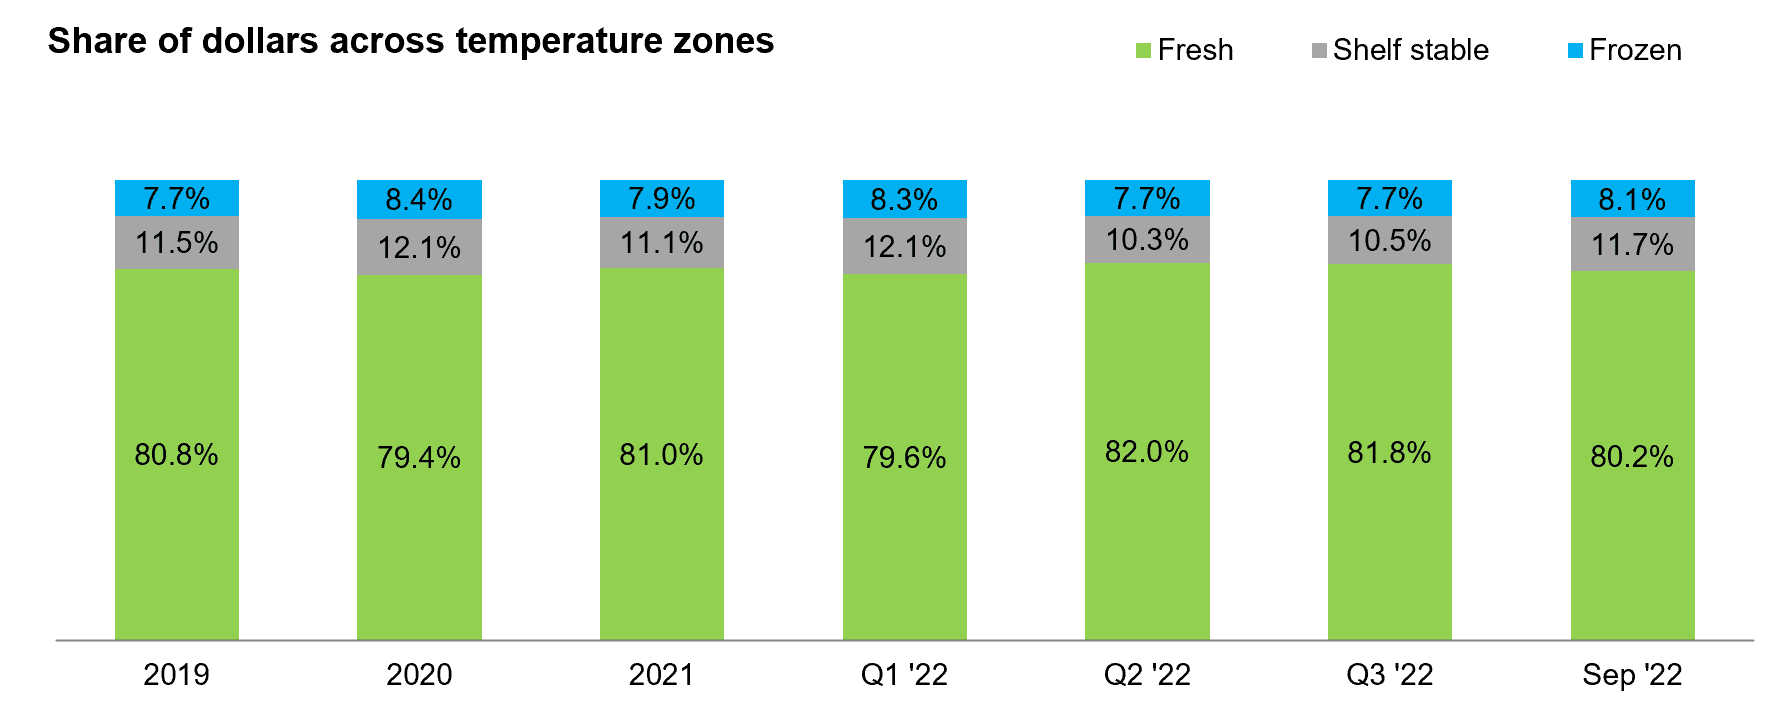
“The fresh share of total fruits and vegetables dropped in the second quarter of 2022,” Watson commented. “In September, the fresh share dropped to 80.2%, back to what it was at the beginning of the year. Yet, inflation for fresh fruit and vegetables has been much lower than that of frozen and shelf-stable, which includes canned and dried fruit and vegetables.”

The below-average growth/inflation for fresh produce meant a drop in the share of fresh fruit and vegetables versus the share represented by frozen (8.1%) and shelf-stable (11.7%).
Fresh Produce Dollars versus Volume
Fresh produce pound sales have trailed behind year ago levels since March 2021, but volume pressure sharpened in 2022 to around 5 points below year ago. In September 2022, pounds trailed the 2021 performance by 5.6%. Pounds are starting to look better against the 2019 levels as food dollars are yet again moving back to retail.
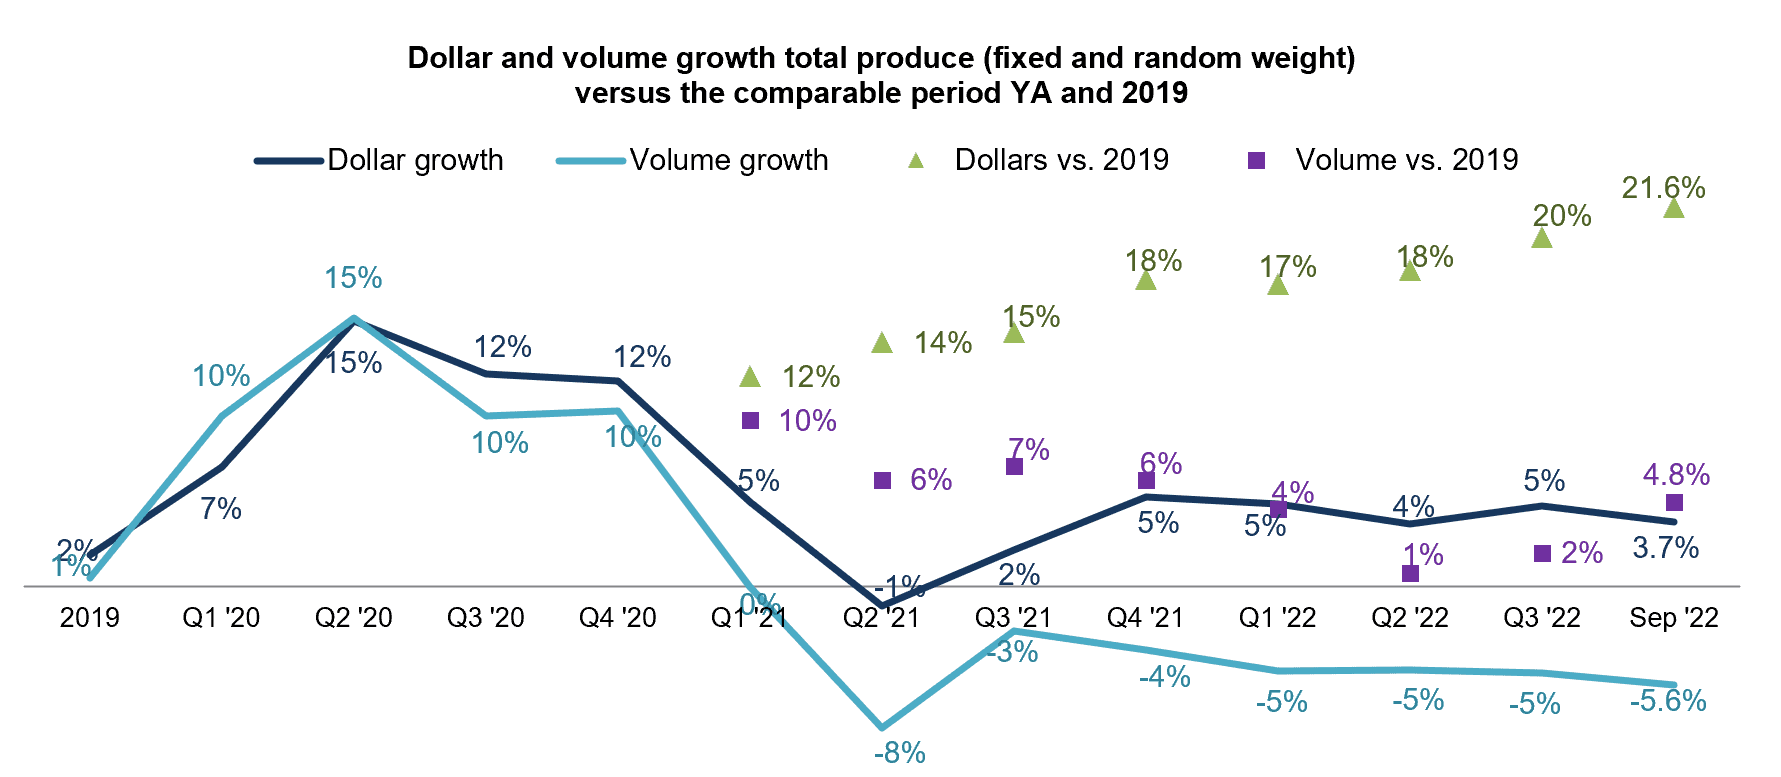
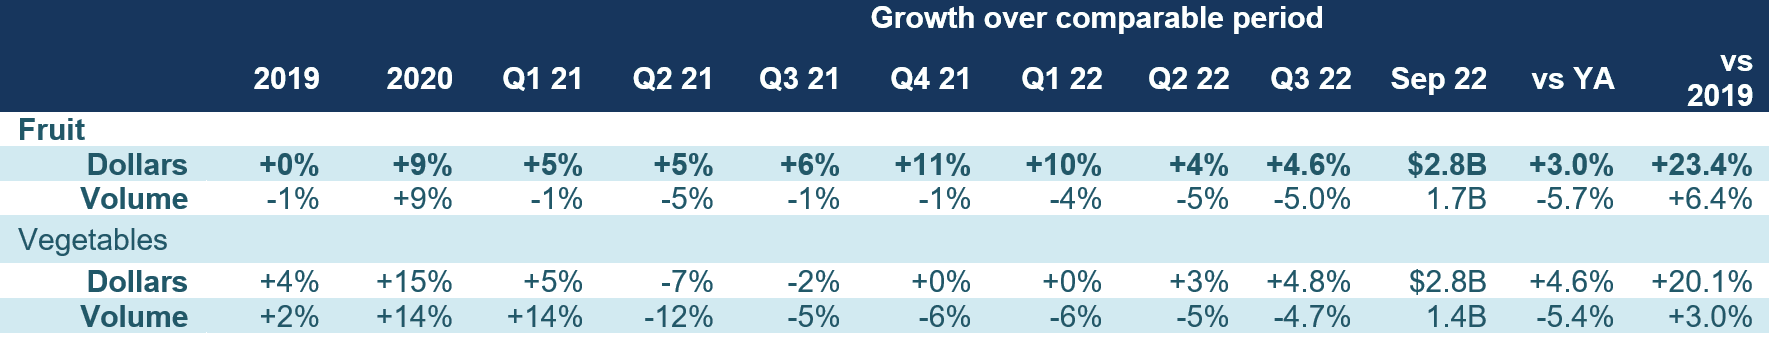
The overall produce volume pressure is driven equally by fruit and vegetables. Fruit pounds were down -5.7% year-on-year in September, while vegetable volume sales were off 5.4%.
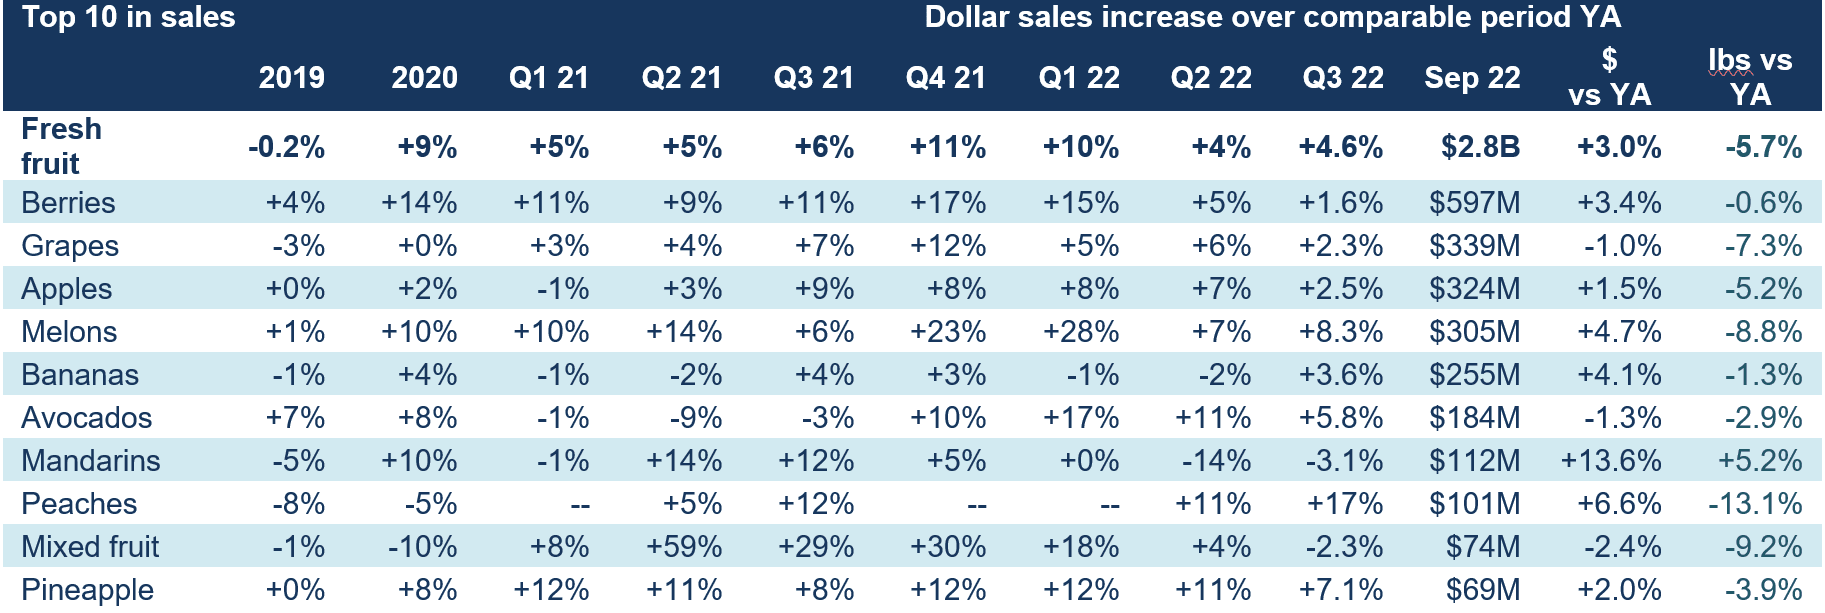
Fresh Fruit Sales in September
“The overall volume pressure in fruit is echoed by nearly all the big sellers with the one exception of mandarins,” Parker said. “Berries had a few months where volume was off, but sales levels have recovered to within one point of last year.” In September, volume declines were strongest for peaches, mixed fruit and melons as retailers transitioned to their fall sets.
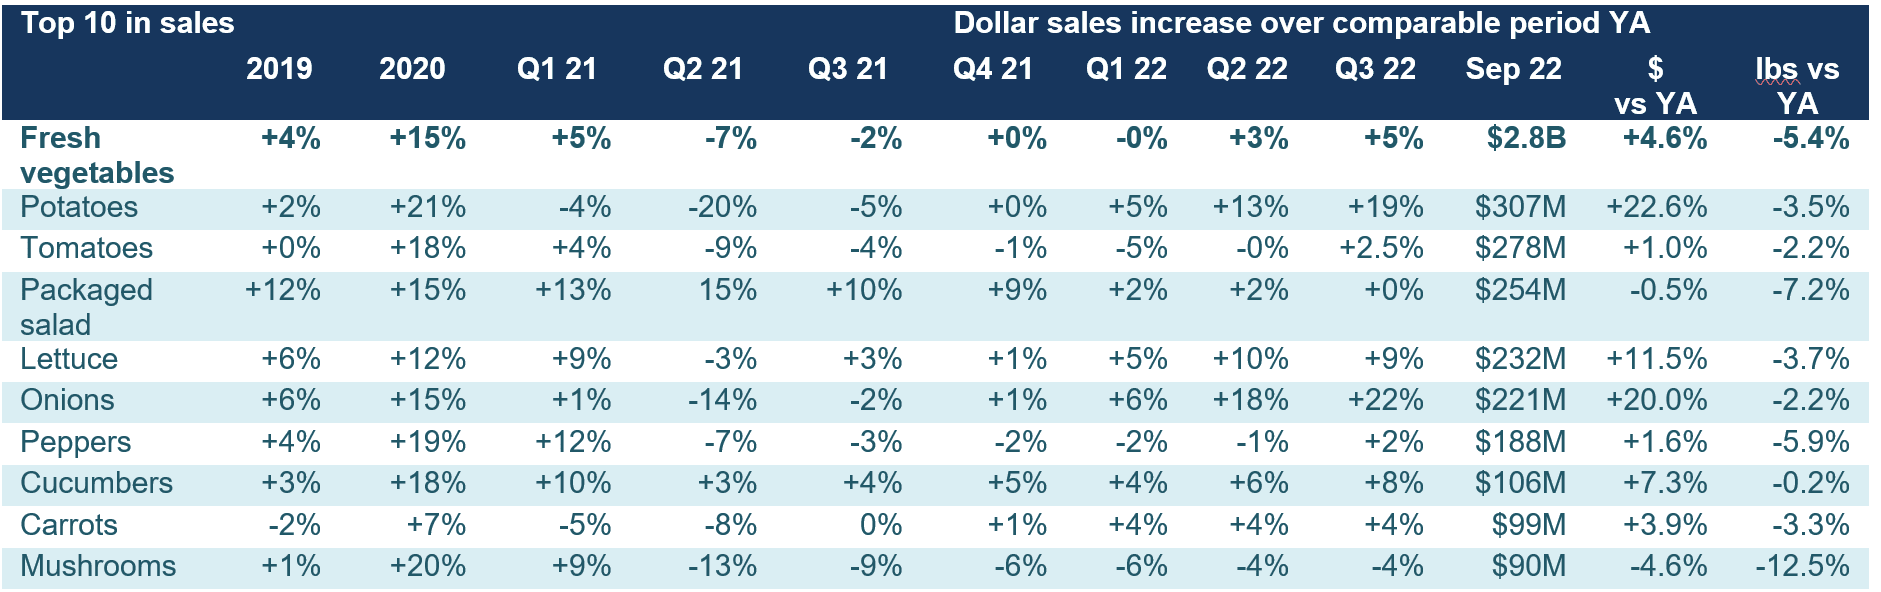
Fresh Vegetables Sales in September
“September saw big upticks in the sales of potatoes, lettuce and onions, though in all cases the boost was inflationary driven,” said Watson. “Cucumbers came the closest to year-ago levels.”
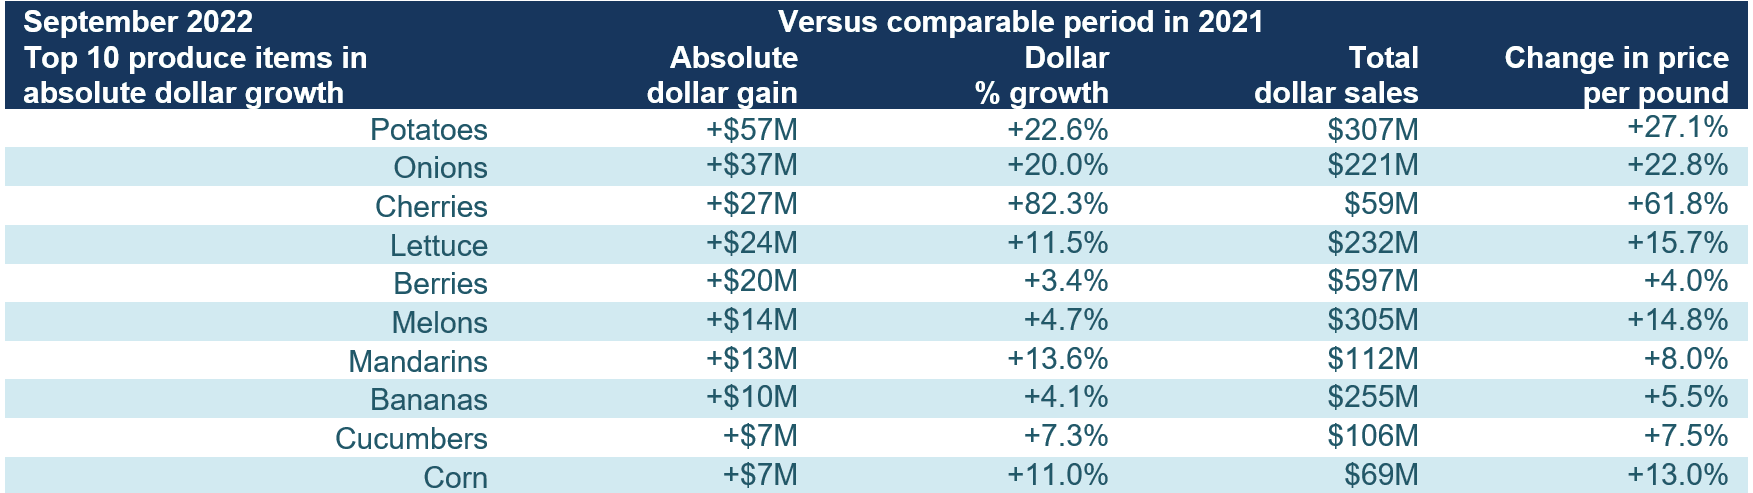
Fresh Produce Absolute Dollar Gains
In September 2022, fresh vegetables added $121 million in sales and fruit added $82 million when compared to September 2021. Gains were achieved in many different ways. Potatoes, onions and cherries each had inflation of 20% or more compared with the average price per pound in September 2021. Berries, mandarins, bananas and cucumbers had inflation well below the rate for total food and beverages but gains were driven by strong demand.
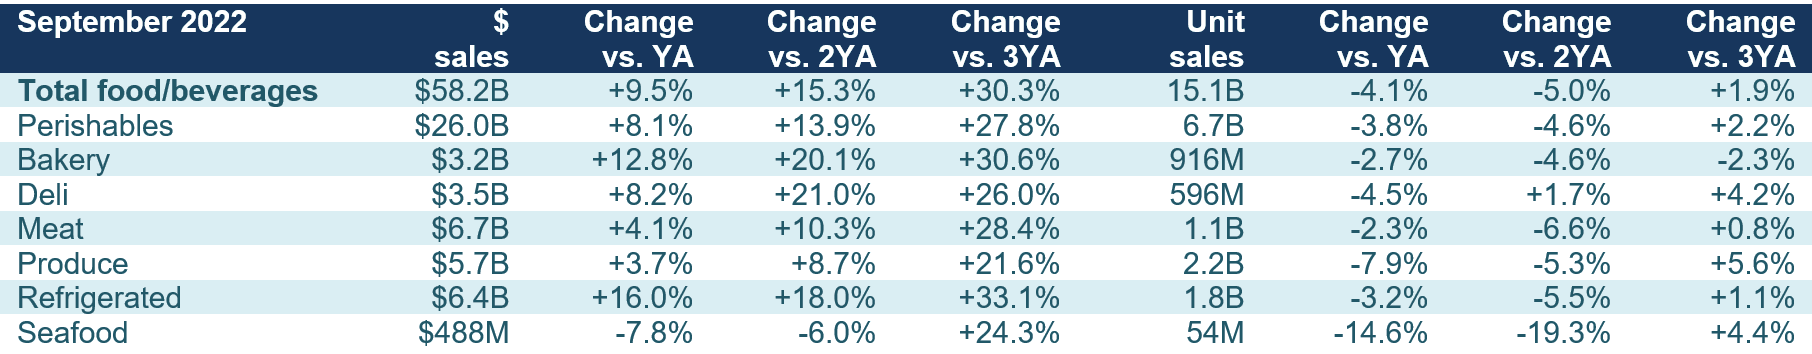
Perishables Performance
The smallest of the fresh departments, seafood, continued to experience substantial dollar and unit pressure in September 2022. The unit performance for the other areas improved notably versus August but remained down year-on-year across the board.
What’s Next?
In 2020 and early 2021, American’s total credit card debt and average savings rates saw vast improvements. According to the Fed, credit card balances peaked at $927 billion in the fourth quarter of 2019, followed by five consecutive quarters of decreases as the COVID-19 pandemic set in, bottoming out at $770 billion in the first quarter of 2021. Since then, credit card balances have risen to $856 billion, just 7.7% below the all-time record. Expectations based on the trend lines are that credit card debt will reach a new high in the next few months. This is particularly important in the light of the Federal Reserve having raised the prime rate several times this year in an effort to dampen inflation.
At the same time, the National Savings Rate has fallen far below pre-pandemic levels, according to the Bureau of Economic Analysis. In August 2022, the average U.S. savings rate as a percentage of disposable income was 3.5% — about half that of the pre-pandemic average. Unlike the early months of the pandemic, that means consumers have been subsidizing income with credit cards or have less income left after paying taxes and spending on essentials in the light of the 40-year high inflation.
This marketplace is impacting consumer sentiment. The University of Michigan Consumer Sentiment (UMSCENT) dropped 20% versus year ago to its lowest levels in many decades, at 51.5, with an index of 100 being neutral.
In totality, consumers are reacting with a pullback on units and volume to manage their spending. But at the same time, baskets still contain items focused on value, convenience and premiumization rather than consumers shopping on price alone.
These patterns are likely to persist as inflationary pressure remains extremely high. The September IRI survey found that:
The next report, covering October, will be released in mid-November. In addition to the data provided here, the IFPA also now offers InSite – an online interactive data set covering both produce and floral performance as well as a look at the 2021 consumer sentiment surveys. Start your free trial today! See www.freshproduce.com/insite for more detail. We also encourage you to contact Joe Watson, IFPA’s VP, Retail, Foodservice and Wholesale, at jwatson@freshproduce.com with any questions or concerns. Please recognize the continued dedication of the entire grocery and produce supply chains, from farm to retailer. #produce #joyoffresh #SupermarketSuperHeroes.
Date ranges:
2019: 52 weeks ending 12/28/2019
2020: 52 weeks ending 12/27/2020
Q1 2021: 13 weeks ending 3/28/2021
Q2 2021: 13 weeks ending 6/27/2021
Q3 2021: 13 weeks ending 9/26/2021
Q4 2021: 13 weeks ending 12/26/2021
Q1 2022: 13 weeks ending 3/27/2022
Q2 2022: 13 weeks ending 6/26/2022
Q3 2022: 13 weeks ending 9/25/2022
September 2022: 4 weeks ending 9/25/2022
