
Coronavirus concern levels among primary grocery shoppers have remained mostly flat between September 2021 and January 2022, according to the monthly primary shopper survey series by IRI.
“In January, 38% of the population were extremely concerned over COVID-19, which was down sharply from 66% in April 2020,” said Jonna Parker, Team Lead for IRI Fresh. “Shoppers are very aware of food inflation (89%) and the vast majority (95%) worry about it. In total, 42% of shoppers are extremely concerned about the price increases they are seeing across the store — which means food inflation has more people on high alert than COVID-19 as of January 2022.”
The combined effect of concerns over COVID-19, inflation and supply chain challenges explains why shopper demand remains in flux as we enter the third pandemic year.
In 2022, IRI, 210 Analytics and the International Fresh Produce Association (IFPA) will continue to team up to document the ever-changing marketplace and its impact on fresh produce sales.
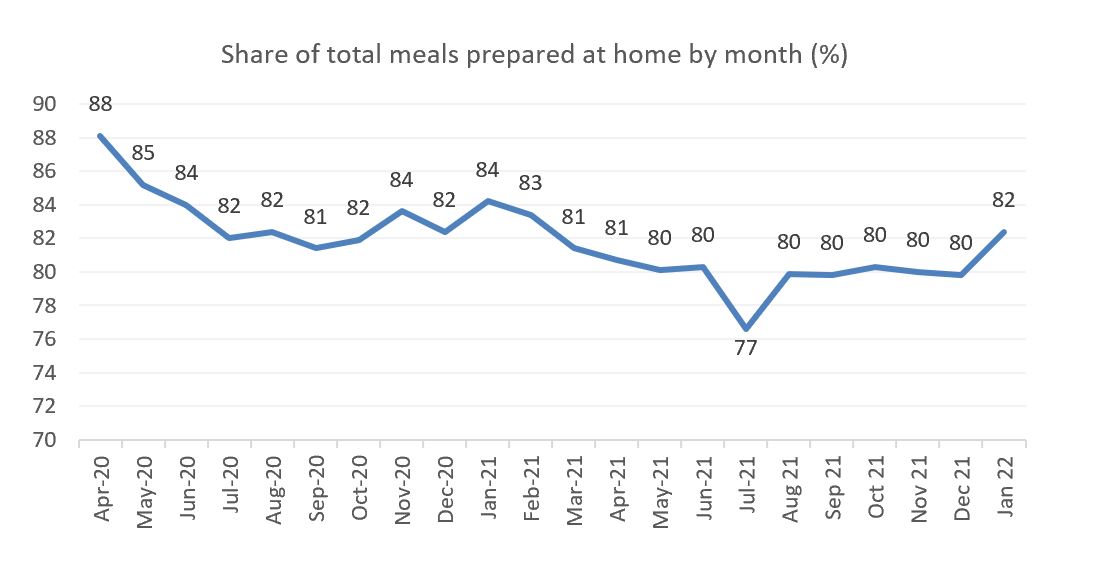
The combination of 40-year high inflation and the upswing in COVID-19 cases moved more meals to the home in January 2022, at 82% of all meal occasions. This is the highest number since February 2021.
Restaurant takeout remained popular in January 2022, at 54% of shoppers having done so, but fewer people dined inside, at 41%. In addition to COVID concerns, cutting back on restaurant spending is one of the most popular money-saving measures.
In response to inflationary pressure around the store, 64% of shoppers have made one or more changes to what and how they buy. Forty-five percent of shoppers look for sales specials more often, 31% are cutting back on non-essentials, 19% buy more private brand and 12% now shop at a lower-cost retailer. The vast majority of trips took place in-store in January 2022, at 86%. During the early months of the pandemic, as many as 20% of trips were online. This dropped to a low of 11% in July of 2021 and sat at 14% in January 2022.
The 14% was split between delivery (7%), curbside pickup (6%) and in-store pickup (1%). When shopping in person, 73% estimate they spent as much time in the store as they normally do but 20% said they shopped faster. Shoppers predict that their shopping will remain store-centric: 65% say all their shopping will be in store versus just 4% who believe they will purchase all groceries online.
The remaining 31% plan to mostly purchase a little or some items online in a mixed format shopping approach. “This means in-person trips will continue to capture the bulk of purchases in the next few months,” added Parker. “This also means a continued lead role for fresh produce and its eye-appeal to anchor people to the store for stock-up and fill-in trips.”
Inflation
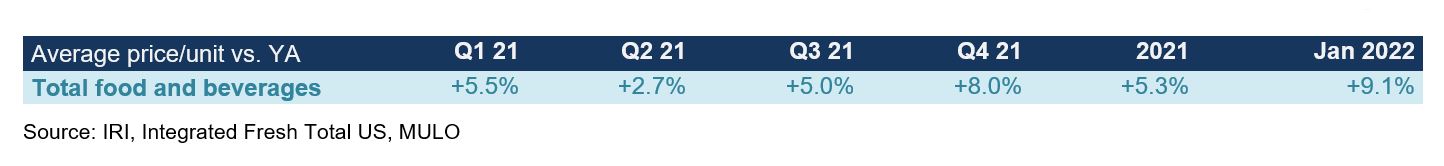
The consumer price index increased 7.5% for the 12 months ending January 2022, the highest increase in 40 years, according to the Bureau of Labor Statistics. IRI-measured price per unit for all food and beverages in multi-outlet stores, including supermarkets, club, mass, supercenter, drug, military, and other retail food stores, also shows that prices continued to rise over and above their elevated 2020 and 2021 levels. In January 2022, the average price per unit was up 9.1% versus January 2021 and +15.3% versus two years ago across all food and beverages. For the latest 52 weeks ending January 30, 2022, prices increased 5.7% — pulled down by much milder inflation in the second quarter of 2021.
Fresh produce prices are also higher than last year. In January 2022, the price per pound for total fresh produce increased by 9.0% over January 2021. The latest 52-week look is milder, at +7.1%, given the much milder inflation in the second quarter of 2021. Vegetable inflation is far below average; but, fruit prices increased by nearly 14%. “Consumers are aware and concerned about the inflation they are seeing,” said Joe Watson, VP, Retail, Foodservice & Wholesale for IFPA. “And as a volume-driven business, the industry is concerned as well and doing everything in its power to get adequate supply to the stores and keeping prices down.”

January 2022 Sales
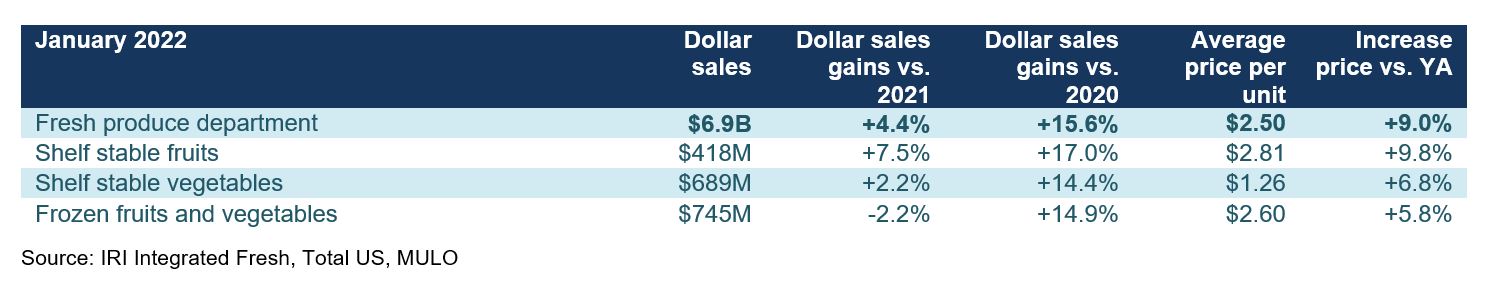
January 2022 brought $67 billion in food and beverage sales — up 5.8% over 2021 and 18.6% over 2020. However, inflation played a significant role with year-on-year unit sales down 3.0%. Perishables, including produce, seafood, meat, bakery and deli, had the highest year-over-year sales growth in 2021, at +6.2%. However, fresh produce sales gains were below average, at +4.4%. Frozen foods had the highest increase versus 2020, at +26.0%.

From a dollar sales perspective, January 2022 was another great month for fresh produce, surpassing the records set in 2020 and 2021. However, dollar gains were inflation-boosted while units and volume sales declined year-on-year. “The risk in the current levels of inflation is volume pressure,” said Watson. “At the same time, it is hard to measure the effect of supply chain disruption, several winter storms affecting the Northeast and the impact of frozen and canned purchases on fresh produce sales. In all, January 2022 sales still tracked ahead of January 2020, which was not yet affected by the pandemic purchase patterns.”

Each of the five January weeks generated $1.3 billion or more, with the week ending January 16 being the biggest, at $1.43 billion. While year-on-year dollar sales were higher each week, volume sales were down. Year-on-year decreases varied from -1.7% the week ending January 16th to -6.2% the first week of the year.

“Our monthly shopper surveys are finding that consumers are hyper aware of inflation and are trying to mitigate the increases as much as possible,” said Parker. “And that is exactly what we are seeing in recent trip baskets. On average, people are spending roughly the same amount of money per trip, but they have many fewer items in their baskets. Saving by buying less is typically one of the later money-saving measures during periods of high inflation; but, with the lack of promotions and already cooking a lot more at home, consumers are drawing on the lessons they learned and fine-turned during the Great Recession. For many that means buying less quantity and we are seeing that very clearly in fresh produce.”
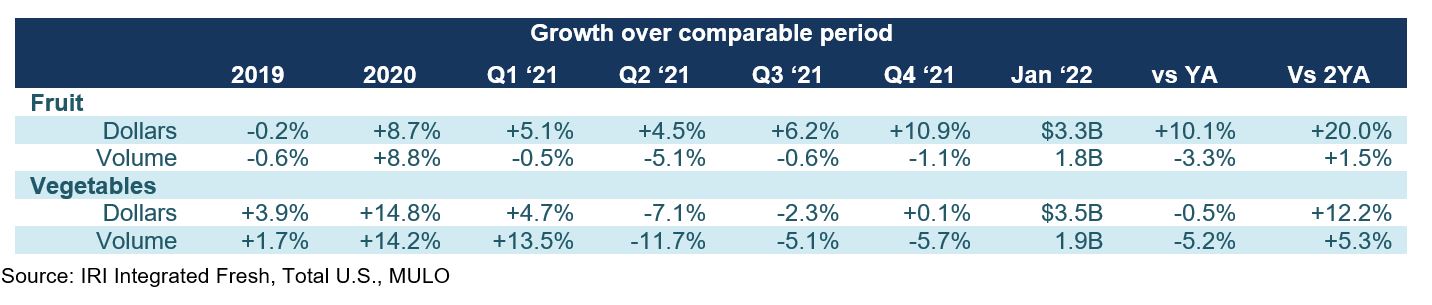
January 2022 gains were down from the fourth quarter growth numbers across the board. Year-on-year, vegetables dropped into the negative.

Fresh Share
Despite above-average inflation for fresh produce, its share of dollars remained below average in January 2022. Shelf-stable fruits had a very strong January with sales gains of 7.5% year-on-year. Both frozen and shelf-stable are heavily impacted by supply chain disruptions and assortment as well as inventory levels have been down significantly over recent months.
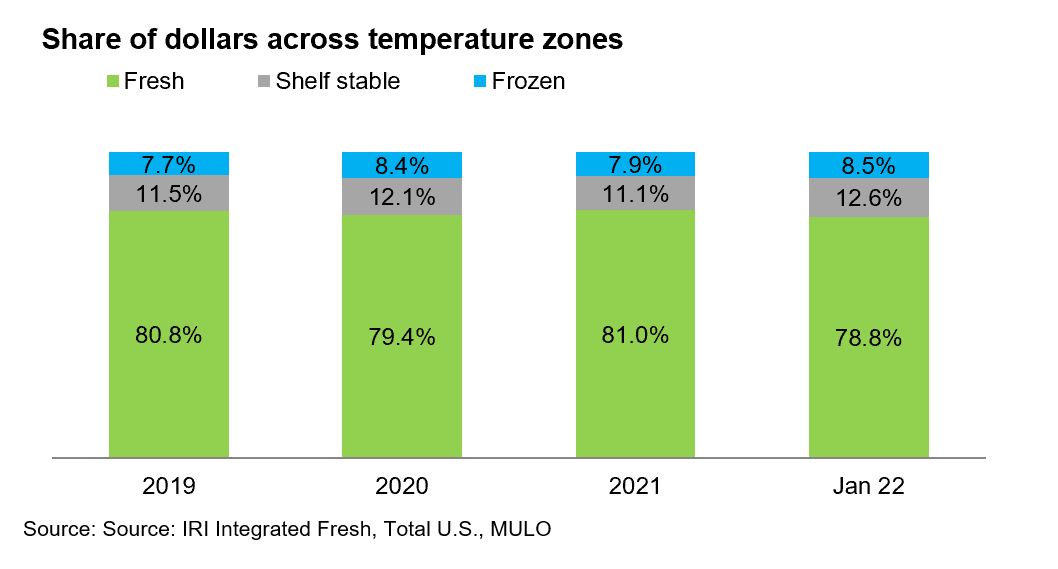
The January 2022 share of dollars for fresh produce was 78.8%, unchanged from December 2021. The fresh share peaked in the summer of 2021, at around 84%.
Fresh Produce Dollars versus Volume
Fresh produce pound sales trailed behind year ago levels all throughout 2021. In January 2022, pound growth dropped to its lowest level since the second quarter of 2021. Additionally, the gap between dollars (+15.6%) and pound growth (+3.3%) when compared with 2020 remained more than 12 points.

Comparing January fruit pound to dollar sales growth very clearly shows the impact of inflation. While January fruit dollars gained 10.1% over January 2021 levels, pounds were down 3.3%. The differences in the dollar versus pound performance were a little less pronounced for vegetables, but also shows the significant inflationary impact. The fourth quarter 2021 numbers were similar to the ones seen in January 2022.
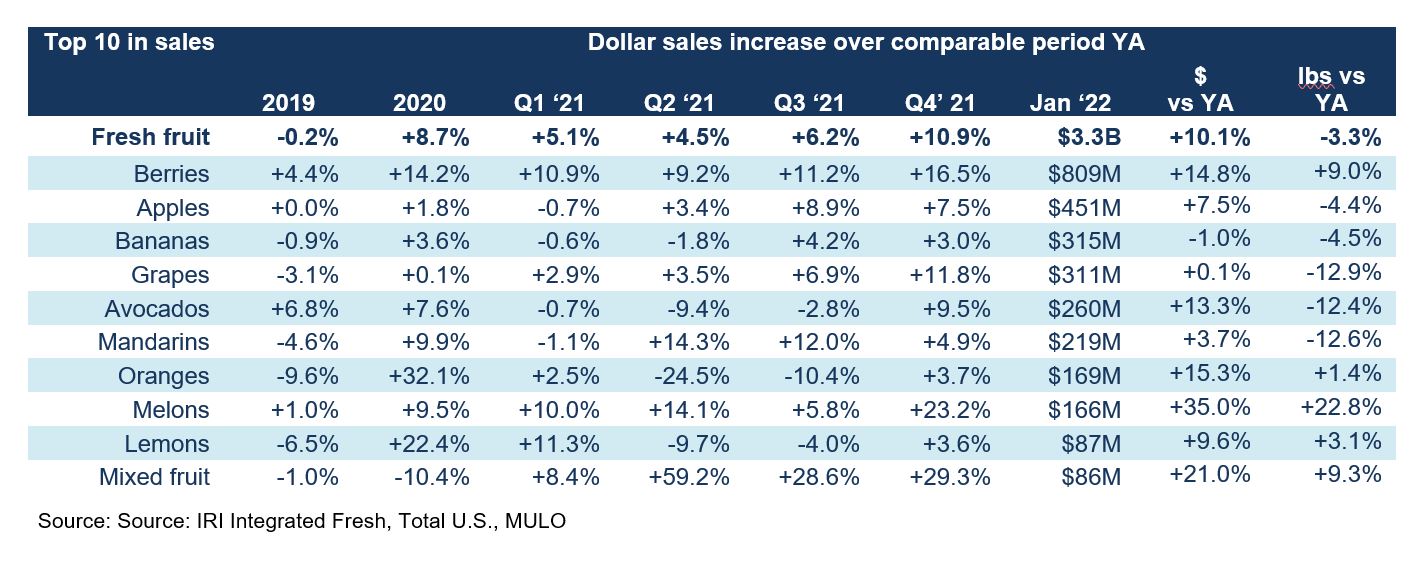
Fresh Fruit Sales in January
“On the fruit side, all top 10 sellers gained versus year ago with the exception of bananas,” said Parker. “In a change from our reporting last year, we will now be showing the increase in dollars and the increase in volume versus year ago in the columns to the far right. The difference between the two percentages is a close match for inflation on a per pound basis, though lower promotional levels also play into higher dollar gains. For instance, while January 2022 avocado dollar sales were up 13.3%, pound sales were down 12.4%, which would translate into inflation of about 26% on a per pound basis. In looking at the actual numbers, the average price per pound for avocados in January 2022 was up 29.4% versus year ago while promotional levels were down by 15.4%. This new reporting will help provide a better look at the effects of inflation plus less promoting on the dollar performance.”
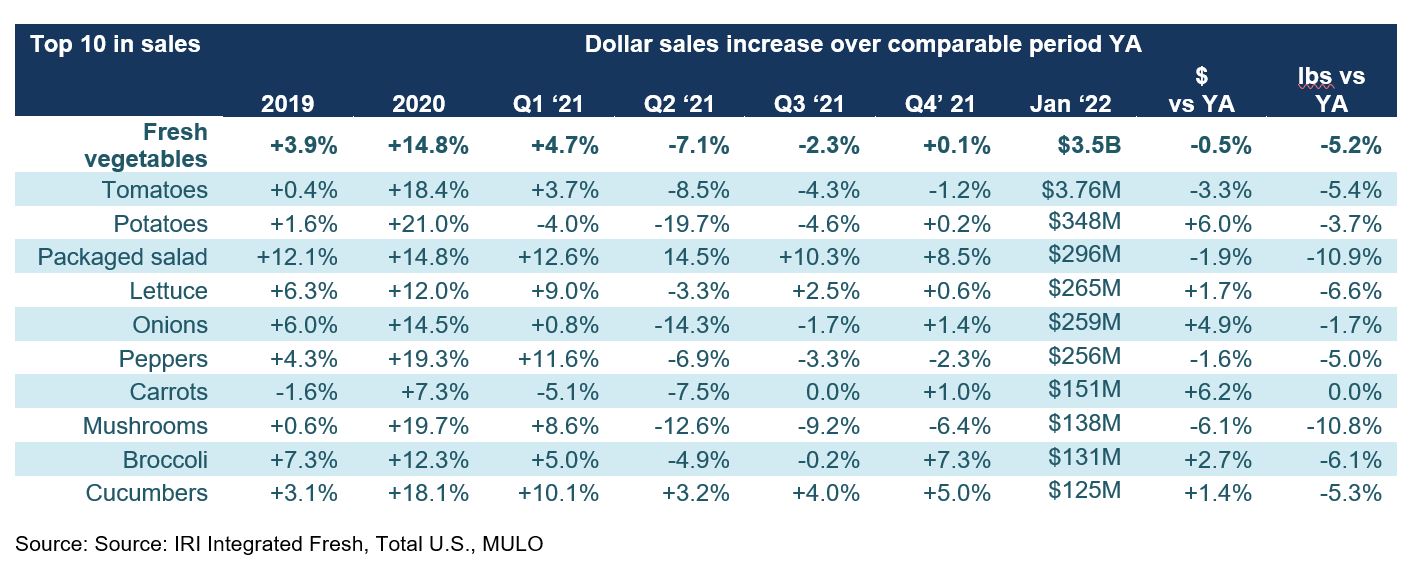
Fresh Vegetables Sales in January
“The top 10 sellers on the vegetable side had a mixed performance in terms of dollar sales growth but has been very consistent in makeup,” said Watson. “Tomatoes, potatoes and packaged salads have been the top three sellers for many months running. The importance of salads is further underscored by lettuce sales, in fourth place.” Carrots had the strongest volume growth performance, pulling even with year ago levels.
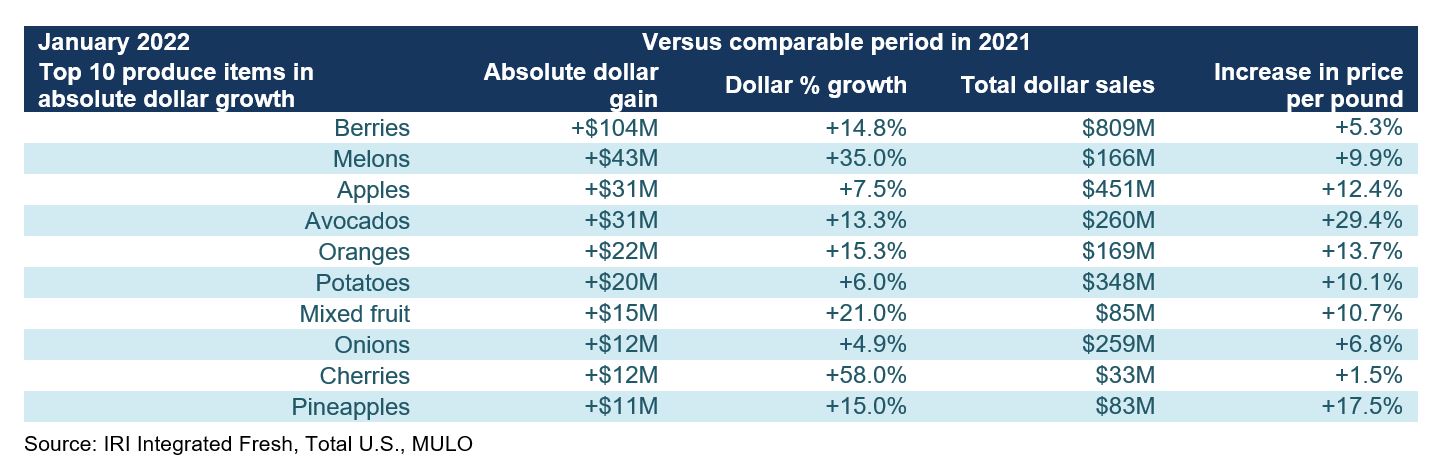
Fresh Produce Absolute Dollar Gains
“The top 10 in absolute dollar gains showed both small and large categories are important for department growth,” said Parker. “But more than anything, it shows the impact of inflation. Impressively, berry prices only increased 5.3% in January 2022, yet berries remained the leader in absolute dollar growth with an additional $104 million in January sales. That was more than twice as much as the number two, melons, that achieved an additional $43 million in sales.” The top 10 in absolute dollar growth was dominated by fruit, directly related to the high levels of inflation.
Perishables Performance
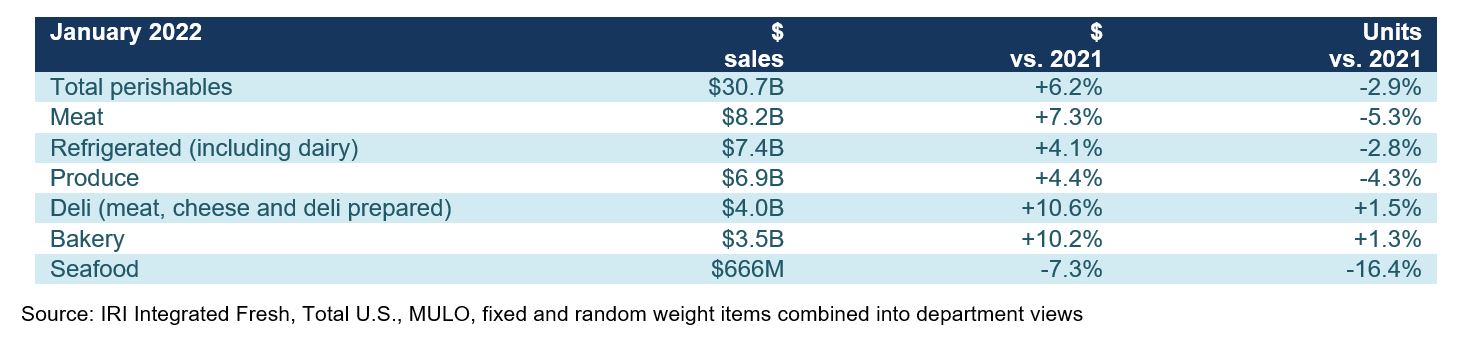
A look across fresh foods departments for the five January 2022 weeks show perimeter strength in dollars. All departments, with the exception of seafood, gained year-over-year, with the highest increases going to deli. However, only deli and bakery, the two departments that struggled during the first year of the pandemic had positive unit growth in January. Seafood is significantly smaller than the other fresh departments and experienced double-digit unit declines.
Floral
The floral department had strong January 2022 when regarding dollars with more than a 3% gain versus year ago. However, much like in produce, floral sales were boosted by inflation and units were down 12.5% and volume 4.6%. Indoor made up the bulk of sales and had the higher growth rate.
January 2022 sales reached $363 million and while up versus year ago, this was down from $458 million in December 2021. Indoor not only had the better January performance but has been outperforming outdoor floral since the second quarter of 2021.
The top three biggest sellers this month were roses, bouquets and potted plants. Growth for roses was still upwards of 10% versus year ago, however, unit sales were down slightly, at -2.4%. Potted plants were not able to hold the line in January 2022 versus year ago, whether dollars or units.
What’s Next?
The marketplace disruption caused by inflation, supply chain challenges and COVID-19 is not showing signs of letting up any time soon.
Shoppers are reacting in a wide variety of ways:
• At 82.4%, the at-home share of all meals reached its highest level in a year, which favors spending at food retail.
• At the same time, the inflationary levels in retail have two-thirds of shoppers looking for one or more money saving measures. Inflation will likely continue to drive dollar gains for most categories in the foreseeable future but is pressuring unit and volume sales.

• For the first time since the onset of the pandemic, a greater share of shoppers (29%) feel their financial situation a year from now will be worse versus better (23%). About half, 48%, think it will be unchanged. This outlook may prompt a greater focus on money-saving measures beyond the current marketplace behaviors alone.
• Continued rising inflation and shortages are driving stock up behaviors among 42% of shoppers. While 58% do not buy more than they need, 14% stocked up on one or more items out of concerns for continued price increases and 19% stocked up out of fear that the item will be out-of-stock next time.
The next report, covering January, will be released in mid-March. We encourage you to contact Joe Watson, IFPA’s VP, Retail, Foodservice and Wholesale, at jwatson@freshproduce.com with any questions or concerns. Please recognize the continued dedication of the entire grocery and produce supply chains, from farm to retailer. #produce #joyoffresh #SupermarketSuperHeroes.
Date ranges:
2019: 52 weeks ending 12/28/2019
2020: 52 weeks ending 12/27/2020
Q1 2021: 13 weeks ending 3/28/2021
Q2 2021: 13 weeks ending 6/27/2021
Q3 2021: 13 weeks ending 9/26/2021
Q4 2021: 13 weeks ending 12/26/2021
January 2022: 5 weeks ending 1/30/2022
