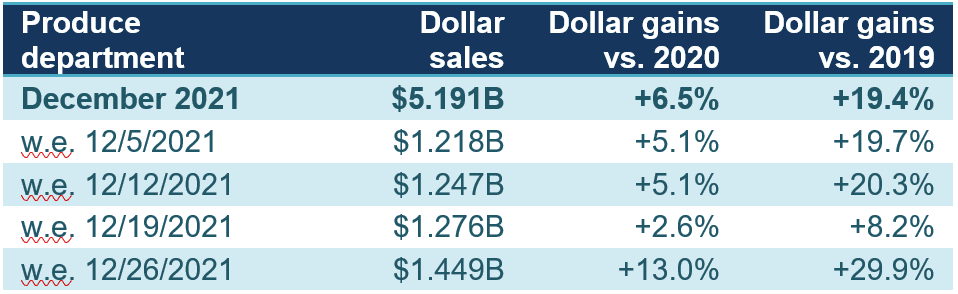
The four December weeks generated a minimum of $1.2 billion, with the holiday week being the biggest with sales of nearly $1.5 billion. The week ending December 26 likely included purchases for the Christmas holiday as well as New Year’s festivities, boosting sales 13% above year ago levels and an astounding 29.9% over 2019.
Source: IRI, Integrated Fresh, Total US, MULO
“Our surveys indicated that the winter holiday celebrations would be home-centric but with larger party sizes,” said Jonna Parker, Team Lead for IRI Fresh. “And that is exactly what we saw playing out in produce and other departments. The holiday week sales were extremely strong and that is an important finding for the early 2022 holidays. I am thinking ahead to Valentine’s Day, for instance, a holiday where retail typically loses out to foodservice. In working with other fresh departments, produce has a great opportunity to shine with easy, restaurant equivalent meal solutions.”
IRI, 210 Analytics and the Produce Marketing Association (PMA) have teamed up since March 2020 to document the ever-changing marketplace and its impact on fresh produce sales.
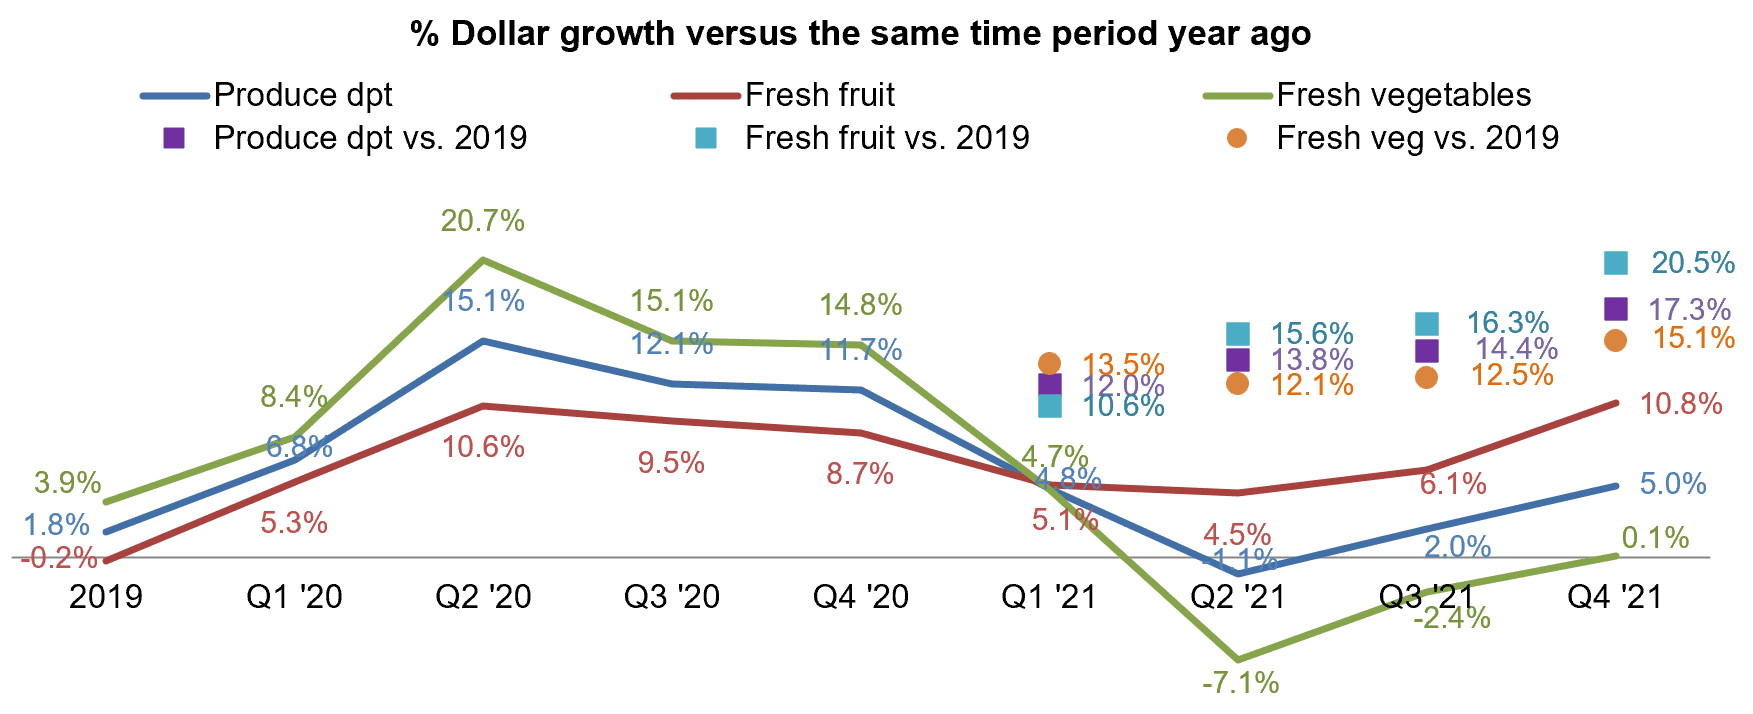
Rolling up the October through December results sees fourth quarter vegetable sales back in positive year-on-year growth territory for the first time since the first quarter. Vegetables had the stronger performance in 2020 and thus the harder path to growth. The comparison to 2019 shows very stable gains for both fruits and vegetables ever since the start of the pandemic.
Source: IRI Integrated Fresh, Total U.S., MULO
Fresh Share
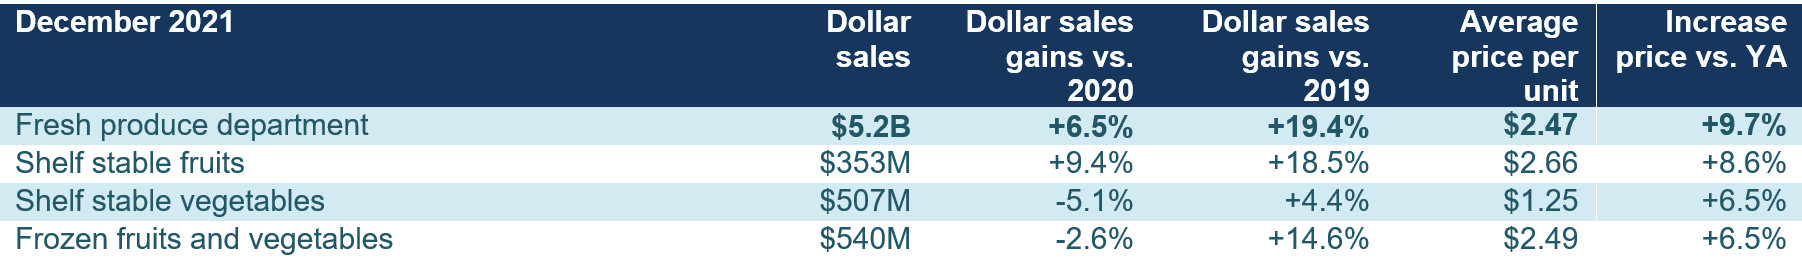
Despite above-average inflation for fresh produce, its share of dollars fell in December. Shelf-stable fruits, in particular had a very strong December with sales gains of 9.4% year-on-year, hand-in-hand with unit and volume gains. Both frozen and shelf-stable are heavily impacted by supply chain disruptions and assortment as well as inventory levels have been down significantly over recent months.
Source: IRI Integrated Fresh, Total US, MULO
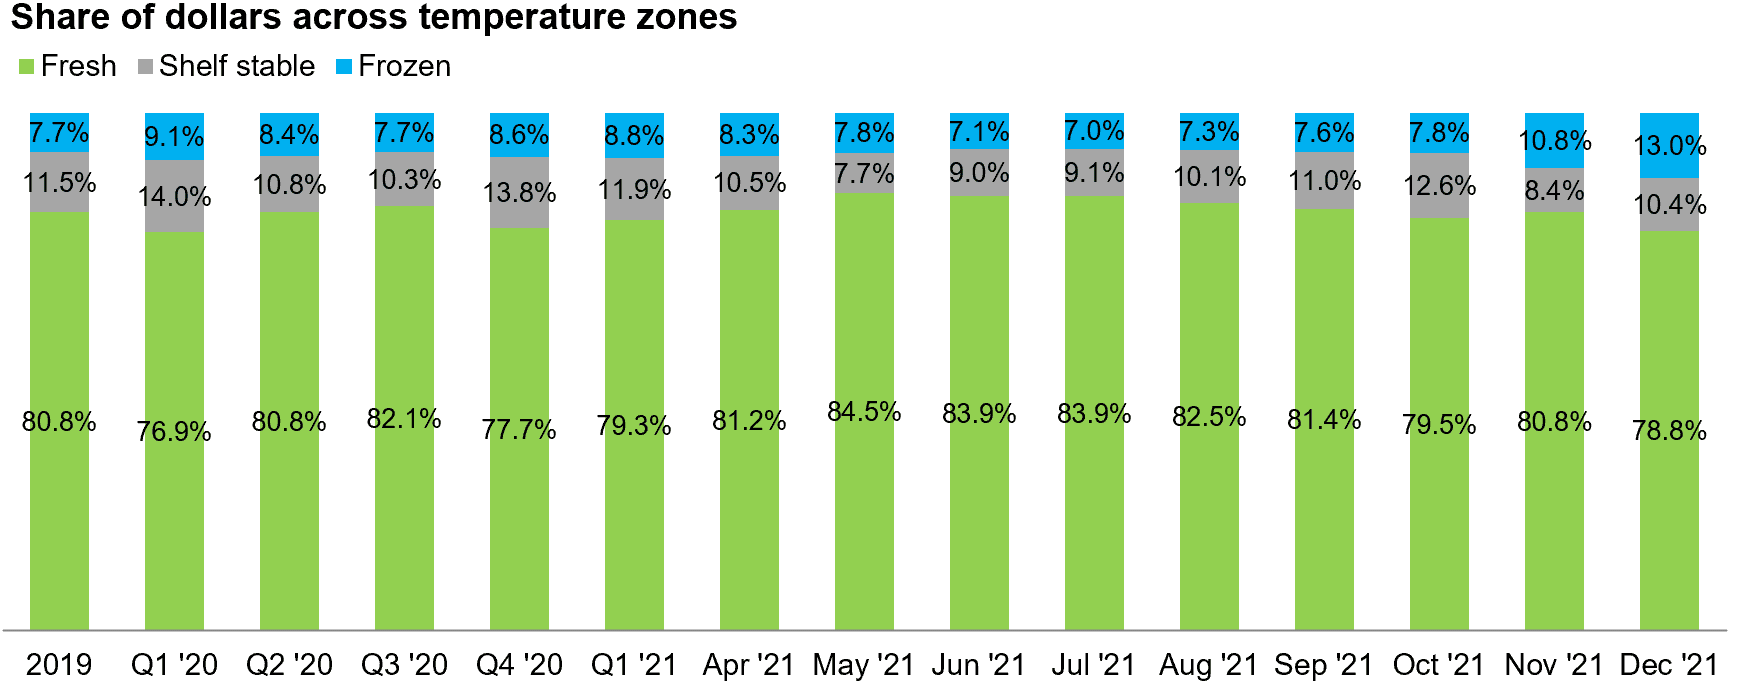
The December share of dollars for fresh produce was 78.8%, continuing the downward trend observed since late spring/summer times when the fresh share rose to around 84%.
Source: IRI Integrated Fresh, Total U.S., MULO
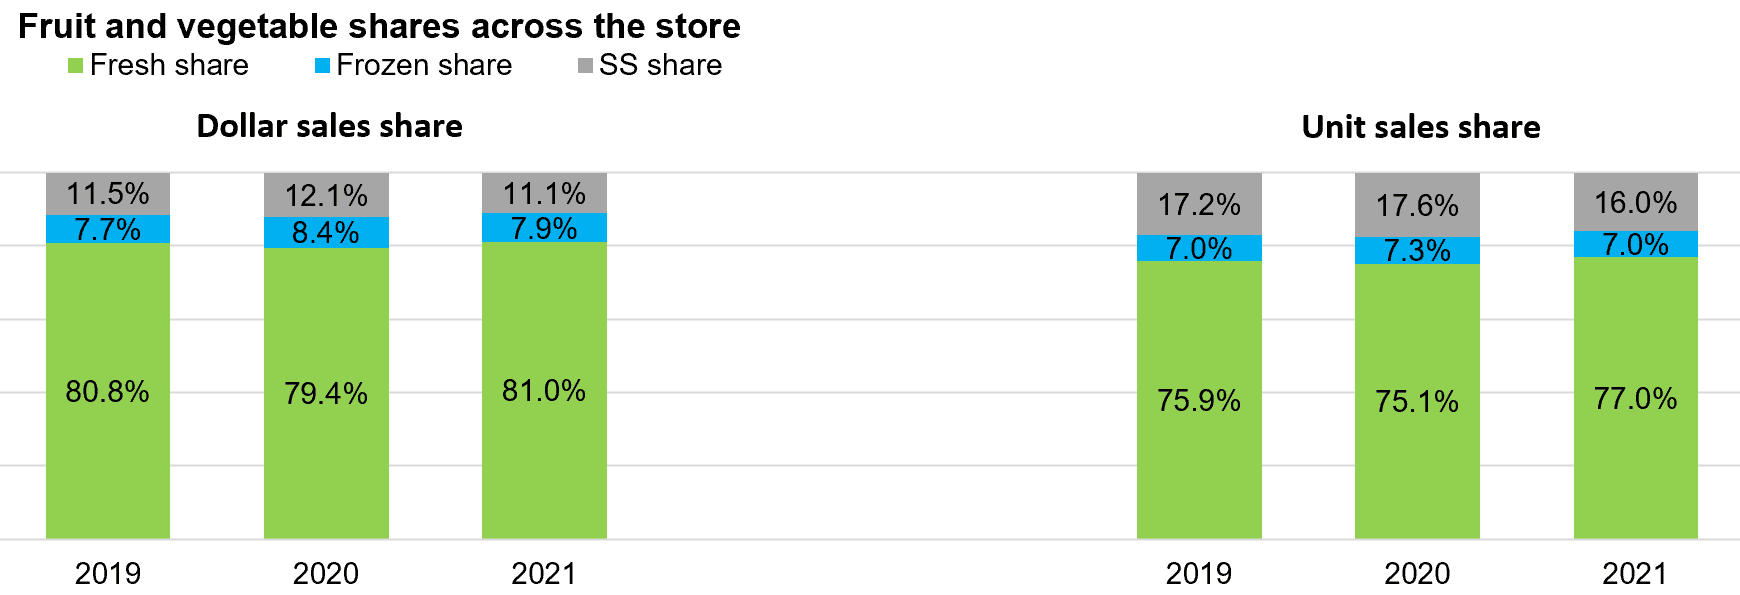
Comparing the three calendar years shows that fresh lost significant ground in 2020, when shoppers looked to shop less and have inventory on hand to last them during lockdown periods. In 2021, the fresh produce share of dollars recovered to typical levels, but its above-average inflation played a role. When removing the effect of inflation by looking at unit sales it is clear that the strong summer months helped boost the 2021 fresh share to above typical levels, at 77% of units. Shelf-stable does not have a pound-equivalent, rendering a volume comparison impossible.
Source: IRI Integrated Fresh, Total U.S., MULO
Fresh Produce Dollars versus Volume
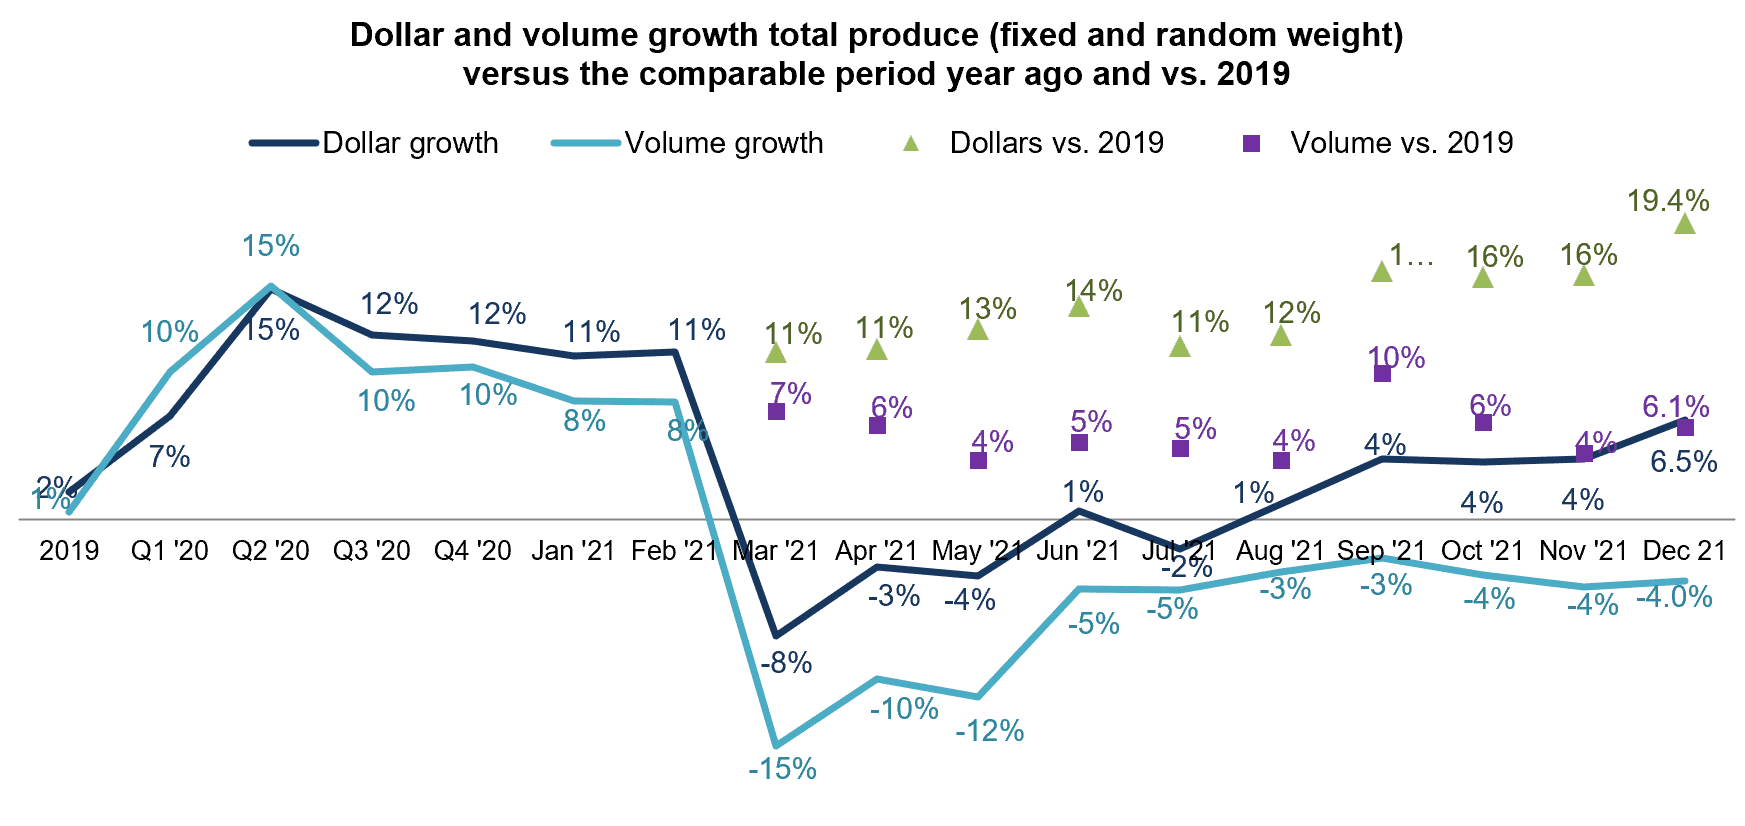
September was the highwater mark for volume sales when pounds came within 2.5 points of last year’s levels. In December, volume remained 4.0% below year ago levels. Pound sales are still 6.1% ahead of the pre-pandemic normal. This is down from a high of 9.6% in September.
Source: IRI Integrated Fresh, Total U.S., MULO
Comparing December fruit pound to dollar sales very clearly shows the impact of inflation. While December fruit dollars gained 13.0% over December 2020 levels, pounds were down 1.5%. The differences in the dollar versus pound performance were a little less pronounced for vegetables, but also shows the significant impact for vegetables. The fourth quarter numbers were similar to the ones seen in December.
Source: IRI Integrated Fresh, Total U.S., MULO
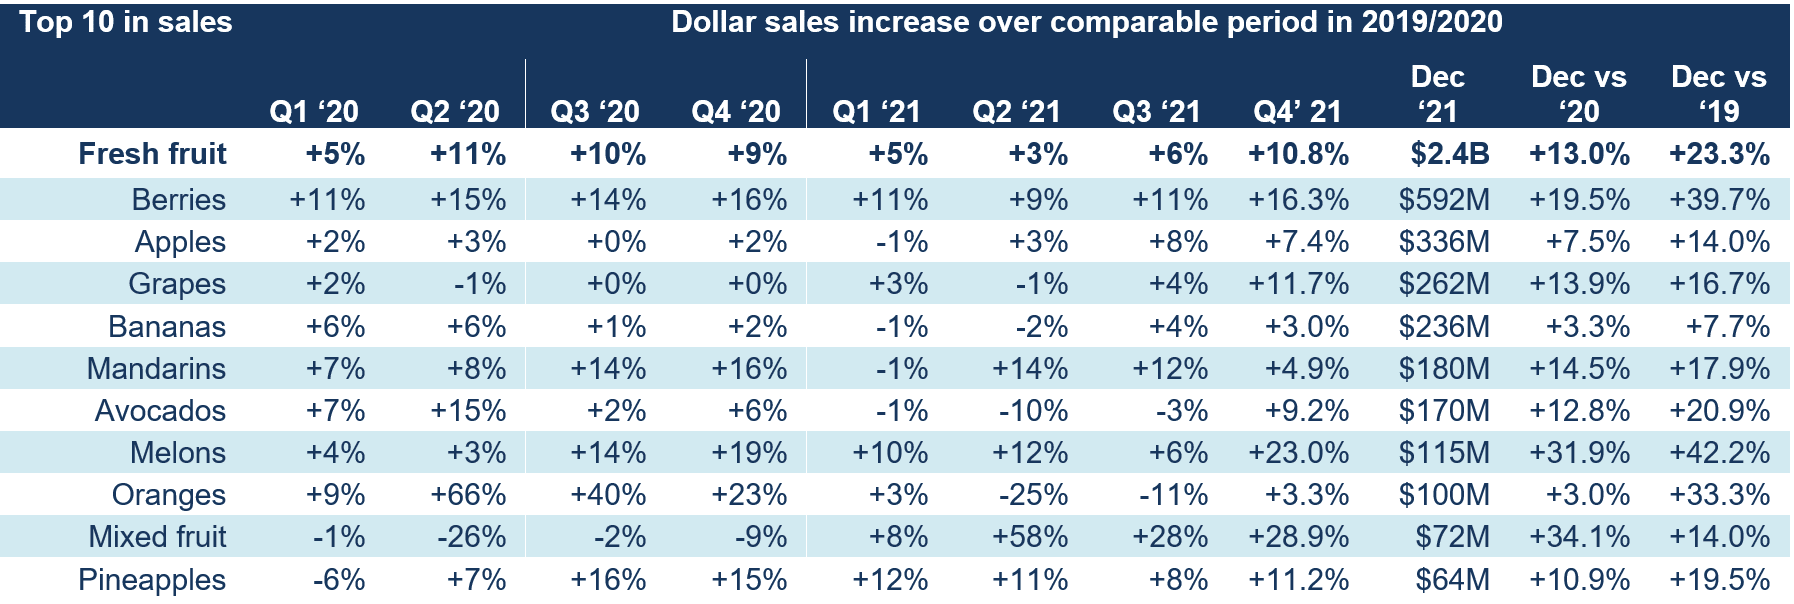
Fresh Fruit Sales in December
“On the fruit side, all top 10 items gained versus year ago,” said Parker. “In fact, eight out of the 10 top sellers in December gained in double digits, boosted by inflation. The month features a very similar set of powerhouses, such as berries, avocados and bananas, that we see month after month. However, the resurgence of entertaining is clear when regarding the very strong performance of both melons and mixed fruit in the fourth quarter and December, specifically.”
Source: IRI Integrated Fresh, Total U.S., MULO
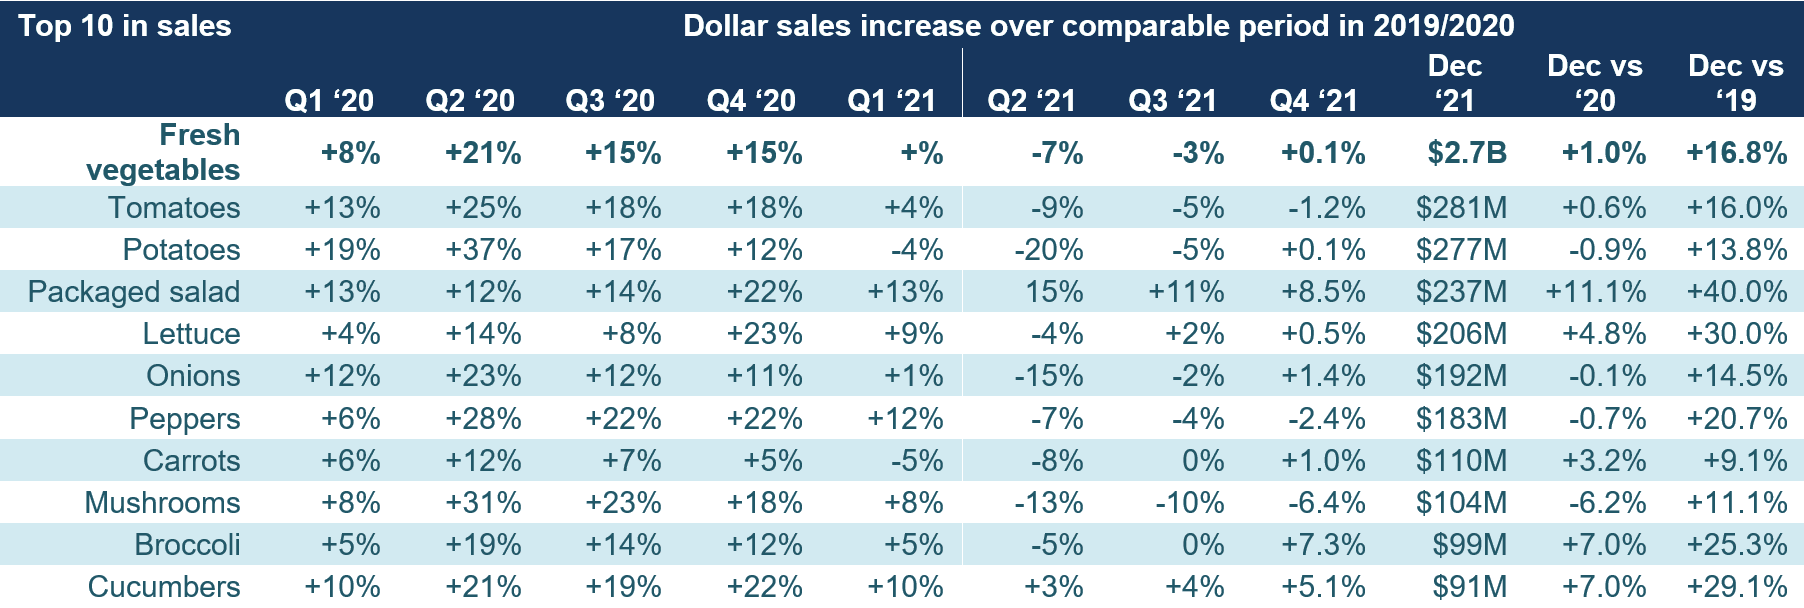
Fresh Vegetables Sales in December
“The top 10 sellers on the vegetable side had a mixed performance in terms of dollar sales growth,” said Watson. “Vegetables did not see the same inflationary boost as fruit and while total vegetables increased sales by 1% over December 2020 levels, four areas lost ground, including potatoes, onions, peppers and mushrooms. However, given the very strong 2020 performance, it is important to compare to normal sales levels as well, which shows demand is still quite strong for all top 10 sellers, even taking the effect of inflation into account.”
Source: IRI Integrated Fresh, Total U.S., MULO
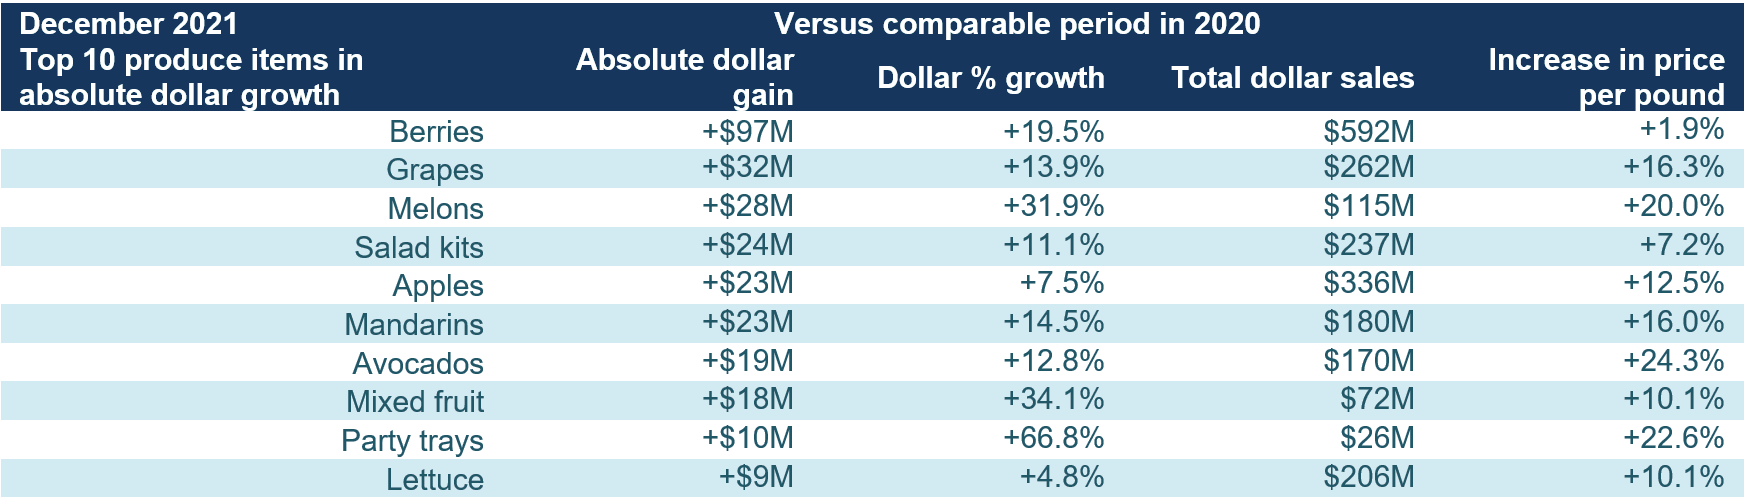
Absolute Dollar Gains
“The top 10 in absolute dollar gains showed both small and large categories are important for department growth,” said Parker. “But more than anything, it shows the impact of inflation. While melons, mixed fruit and party trays had a tremendous December performance as people entertained at home, the average price per pound for rose 20.0% for melons (highly affected by cut melons), 10.1% for mixed fruit and 22.6% for party trays. Impressively, berry prices only increased 1.9% over December 2020, yet berries remain the leader in absolute dollar growth.”
The top 10 in absolute dollar growth was dominated by fruit, directly related to the high levels of inflation.
Source: IRI Integrated Fresh, Total U.S., MULO
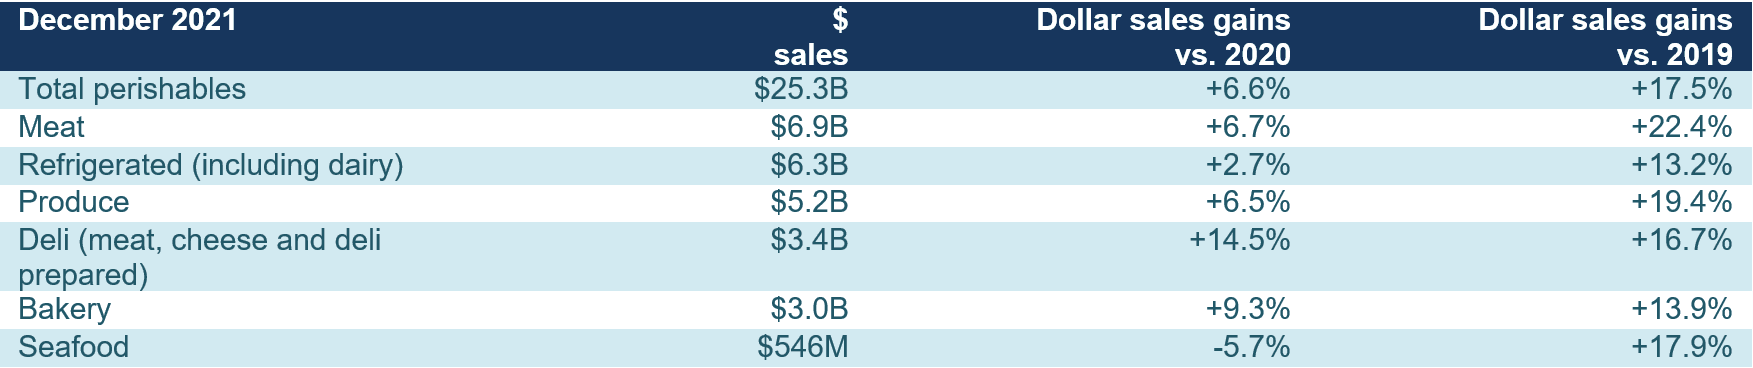
Perishables Performance
A look across fresh foods departments for the four December weeks shows perimeter strength. All departments, with the exception of seafood, gained year-over-year, with the highest increases going to deli. Seafood is significantly smaller than the other fresh departments and deli sales overtook bakery sales this month.
Source: IRI Integrated Fresh, Total U.S., MULO, fixed and random weight items combined into department views
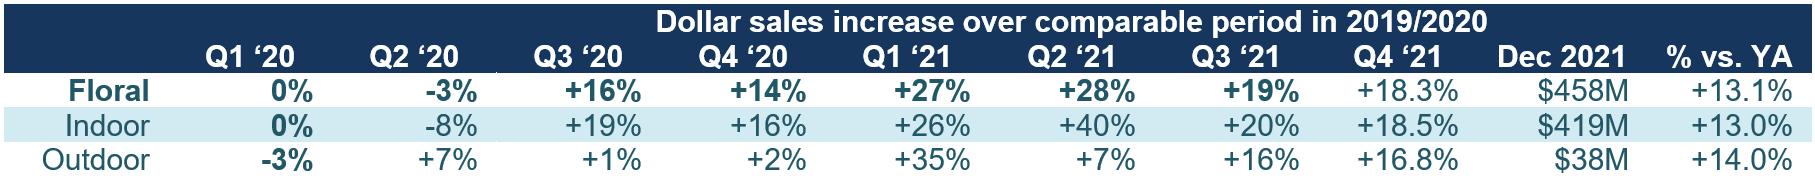
Floral
The floral department had a tremendous year, reaching $7.2 billion in sales, reflecting an increase of 24.0% over 2020 levels and 29.2% over 2019 levels. Dollar gains came hand-in-hand with unit and volume growth. Indoor made up the bulk of sale and had the higher growth rate.
Source: IRI, Integrated Fresh, Total US, MULO, % change vs. year ago.
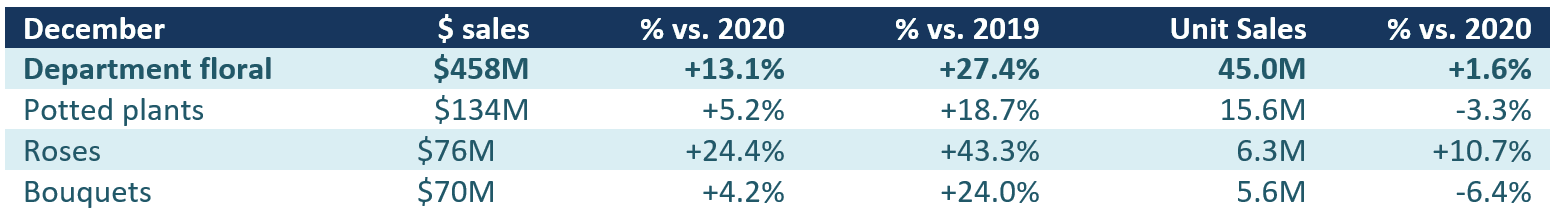
December was a big month for floral, with sales reaching $458 million, up 13.1% over the 2020 records. Both indoor and outdoor floral sales increased, but indoor made up the bulk of sales, at $419 million.
Source: IRI Integrated Fresh, Total U.S., MULO
The top three biggest sellers this month were potted plants, roses and bouquets. Growth for roses was still upwards of 24% versus year ago and sales were up an astounding 43% versus 2019. Unit sales for roses were up 10.7%.
Source: IRI Integrated Fresh, Total U.S., MULO
What’s Next?
Marketplace disruption is likely to continue through the first quarter of 2022 at a minimum.
In December 2021, 38% of shoppers encountered issues with availability of items they had planned to purchase. The highest out-of-stocks were reported for toilet paper, canned goods and milk.
In response to not being able to buy what they came for, 34% of shoppers spent their money elsewhere and 26% ended up not purchasing the planned item at all — underscoring the significant impact of out-of-stocks on sales.
– 34% went to a different store and another 7% went online and bought it from another store.
– 26% forewent the purchase.
– 24% bought a different brand or variety.
– 19% returned to the store later.
22% of shoppers stocked up on certain items out of concern that they may not be available next time they shop.
18% stocked up on certain items for other reasons, including rapidly rising inflation. This could affect fresh produce sales with dollars shifting to canned and frozen.
The latest COVID-19 wave has not resulted in the same levels of concern as those early in the pandemic.
33% is extremely concerned — a ratio that was double as high during the early months.
Despite the arrival of the Omicron variant, 73% are not any more or less worried; 27% are more worried and 7% are less worried.
Eighty percent of consumers bought from restaurants in December 2021 — a few points down from prior months. Engagement is driven by takeout and delivery:
54% of primary shoppers have gotten takeout and 20% have ordered home delivery.
49% have dined inside at a restaurant and 10% have eaten outdoors at a restaurant.
The next report, covering January, will be released in mid-February. We encourage you to contact Joe Watson, IFPA’s VP, Retail, Foodservice and Wholesale, at jwatson@freshproduce.com with any questions or concerns. Please recognize the continued dedication of the entire grocery and produce supply chains, from farm to retailer. #produce #joyoffresh #SupermarketSuperHeroes.
Date ranges:
2019: 52 weeks ending 12/28/2019
Q1 2020: 13 weeks ending 3/29/2020
Q2 2020: 13 weeks ending 6/28/2020
Q3 2020: 13 weeks ending 9/27/2020
Q4 2020: 13 weeks ending 12/27/2020
Q1 2021: 13 weeks ending 3/28/2021
Q2 2021: 13 weeks ending 6/27/2021
Q3 2021: 13 weeks ending 9/26/2021
Q4 2021: 13 weeks ending 12/26/2021
December 2021: 4 weeks ending 12/26/2021
The four December weeks generated a minimum of $1.2 billion, with the holiday week being the biggest with sales of nearly $1.5 billion. The week ending December 26 likely included purchases for the Christmas holiday as well as New Year’s festivities, boosting sales 13% above year ago levels and an astounding 29.9% over 2019.
Source: IRI, Integrated Fresh, Total US, MULO
“Our surveys indicated that the winter holiday celebrations would be home-centric but with larger party sizes,” said Jonna Parker, Team Lead for IRI Fresh. “And that is exactly what we saw playing out in produce and other departments. The holiday week sales were extremely strong and that is an important finding for the early 2022 holidays. I am thinking ahead to Valentine’s Day, for instance, a holiday where retail typically loses out to foodservice. In working with other fresh departments, produce has a great opportunity to shine with easy, restaurant equivalent meal solutions.”
IRI, 210 Analytics and the Produce Marketing Association (PMA) have teamed up since March 2020 to document the ever-changing marketplace and its impact on fresh produce sales.
Rolling up the October through December results sees fourth quarter vegetable sales back in positive year-on-year growth territory for the first time since the first quarter. Vegetables had the stronger performance in 2020 and thus the harder path to growth. The comparison to 2019 shows very stable gains for both fruits and vegetables ever since the start of the pandemic.
Source: IRI Integrated Fresh, Total U.S., MULO
Fresh Share
Despite above-average inflation for fresh produce, its share of dollars fell in December. Shelf-stable fruits, in particular had a very strong December with sales gains of 9.4% year-on-year, hand-in-hand with unit and volume gains. Both frozen and shelf-stable are heavily impacted by supply chain disruptions and assortment as well as inventory levels have been down significantly over recent months.
Source: IRI Integrated Fresh, Total US, MULO
The December share of dollars for fresh produce was 78.8%, continuing the downward trend observed since late spring/summer times when the fresh share rose to around 84%.
Source: IRI Integrated Fresh, Total U.S., MULO
Comparing the three calendar years shows that fresh lost significant ground in 2020, when shoppers looked to shop less and have inventory on hand to last them during lockdown periods. In 2021, the fresh produce share of dollars recovered to typical levels, but its above-average inflation played a role. When removing the effect of inflation by looking at unit sales it is clear that the strong summer months helped boost the 2021 fresh share to above typical levels, at 77% of units. Shelf-stable does not have a pound-equivalent, rendering a volume comparison impossible.
Source: IRI Integrated Fresh, Total U.S., MULO
Fresh Produce Dollars versus Volume
September was the highwater mark for volume sales when pounds came within 2.5 points of last year’s levels. In December, volume remained 4.0% below year ago levels. Pound sales are still 6.1% ahead of the pre-pandemic normal. This is down from a high of 9.6% in September.
Source: IRI Integrated Fresh, Total U.S., MULO
Comparing December fruit pound to dollar sales very clearly shows the impact of inflation. While December fruit dollars gained 13.0% over December 2020 levels, pounds were down 1.5%. The differences in the dollar versus pound performance were a little less pronounced for vegetables, but also shows the significant impact for vegetables. The fourth quarter numbers were similar to the ones seen in December.
Source: IRI Integrated Fresh, Total U.S., MULO
Fresh Fruit Sales in December
“On the fruit side, all top 10 items gained versus year ago,” said Parker. “In fact, eight out of the 10 top sellers in December gained in double digits, boosted by inflation. The month features a very similar set of powerhouses, such as berries, avocados and bananas, that we see month after month. However, the resurgence of entertaining is clear when regarding the very strong performance of both melons and mixed fruit in the fourth quarter and December, specifically.”
Source: IRI Integrated Fresh, Total U.S., MULO
Fresh Vegetables Sales in December
“The top 10 sellers on the vegetable side had a mixed performance in terms of dollar sales growth,” said Watson. “Vegetables did not see the same inflationary boost as fruit and while total vegetables increased sales by 1% over December 2020 levels, four areas lost ground, including potatoes, onions, peppers and mushrooms. However, given the very strong 2020 performance, it is important to compare to normal sales levels as well, which shows demand is still quite strong for all top 10 sellers, even taking the effect of inflation into account.”
Source: IRI Integrated Fresh, Total U.S., MULO
Absolute Dollar Gains
“The top 10 in absolute dollar gains showed both small and large categories are important for department growth,” said Parker. “But more than anything, it shows the impact of inflation. While melons, mixed fruit and party trays had a tremendous December performance as people entertained at home, the average price per pound for rose 20.0% for melons (highly affected by cut melons), 10.1% for mixed fruit and 22.6% for party trays. Impressively, berry prices only increased 1.9% over December 2020, yet berries remain the leader in absolute dollar growth.”
The top 10 in absolute dollar growth was dominated by fruit, directly related to the high levels of inflation.
Source: IRI Integrated Fresh, Total U.S., MULO
Perishables Performance
A look across fresh foods departments for the four December weeks shows perimeter strength. All departments, with the exception of seafood, gained year-over-year, with the highest increases going to deli. Seafood is significantly smaller than the other fresh departments and deli sales overtook bakery sales this month.
Source: IRI Integrated Fresh, Total U.S., MULO, fixed and random weight items combined into department views
Floral
The floral department had a tremendous year, reaching $7.2 billion in sales, reflecting an increase of 24.0% over 2020 levels and 29.2% over 2019 levels. Dollar gains came hand-in-hand with unit and volume growth. Indoor made up the bulk of sale and had the higher growth rate.
Source: IRI, Integrated Fresh, Total US, MULO, % change vs. year ago.
December was a big month for floral, with sales reaching $458 million, up 13.1% over the 2020 records. Both indoor and outdoor floral sales increased, but indoor made up the bulk of sales, at $419 million.
Source: IRI Integrated Fresh, Total U.S., MULO
The top three biggest sellers this month were potted plants, roses and bouquets. Growth for roses was still upwards of 24% versus year ago and sales were up an astounding 43% versus 2019. Unit sales for roses were up 10.7%.
Source: IRI Integrated Fresh, Total U.S., MULO
What’s Next?
Marketplace disruption is likely to continue through the first quarter of 2022 at a minimum.
In December 2021, 38% of shoppers encountered issues with availability of items they had planned to purchase. The highest out-of-stocks were reported for toilet paper, canned goods and milk.
In response to not being able to buy what they came for, 34% of shoppers spent their money elsewhere and 26% ended up not purchasing the planned item at all — underscoring the significant impact of out-of-stocks on sales.
– 34% went to a different store and another 7% went online and bought it from another store.
– 26% forewent the purchase.
– 24% bought a different brand or variety.
– 19% returned to the store later.
22% of shoppers stocked up on certain items out of concern that they may not be available next time they shop.
18% stocked up on certain items for other reasons, including rapidly rising inflation. This could affect fresh produce sales with dollars shifting to canned and frozen.
The latest COVID-19 wave has not resulted in the same levels of concern as those early in the pandemic.
33% is extremely concerned — a ratio that was double as high during the early months.
Despite the arrival of the Omicron variant, 73% are not any more or less worried; 27% are more worried and 7% are less worried.
Eighty percent of consumers bought from restaurants in December 2021 — a few points down from prior months. Engagement is driven by takeout and delivery:
54% of primary shoppers have gotten takeout and 20% have ordered home delivery.
49% have dined inside at a restaurant and 10% have eaten outdoors at a restaurant.
The next report, covering January, will be released in mid-February. We encourage you to contact Joe Watson, IFPA’s VP, Retail, Foodservice and Wholesale, at jwatson@freshproduce.com with any questions or concerns. Please recognize the continued dedication of the entire grocery and produce supply chains, from farm to retailer. #produce #joyoffresh #SupermarketSuperHeroes.
Date ranges:
2019: 52 weeks ending 12/28/2019
Q1 2020: 13 weeks ending 3/29/2020
Q2 2020: 13 weeks ending 6/28/2020
Q3 2020: 13 weeks ending 9/27/2020
Q4 2020: 13 weeks ending 12/27/2020
Q1 2021: 13 weeks ending 3/28/2021
Q2 2021: 13 weeks ending 6/27/2021
Q3 2021: 13 weeks ending 9/26/2021
Q4 2021: 13 weeks ending 12/26/2021
December 2021: 4 weeks ending 12/26/2021
Anne-Marie Roerink is the President of 210 Analytics.


 The latest COVID-19 wave has not resulted in the same levels of concern as those early in the pandemic.