

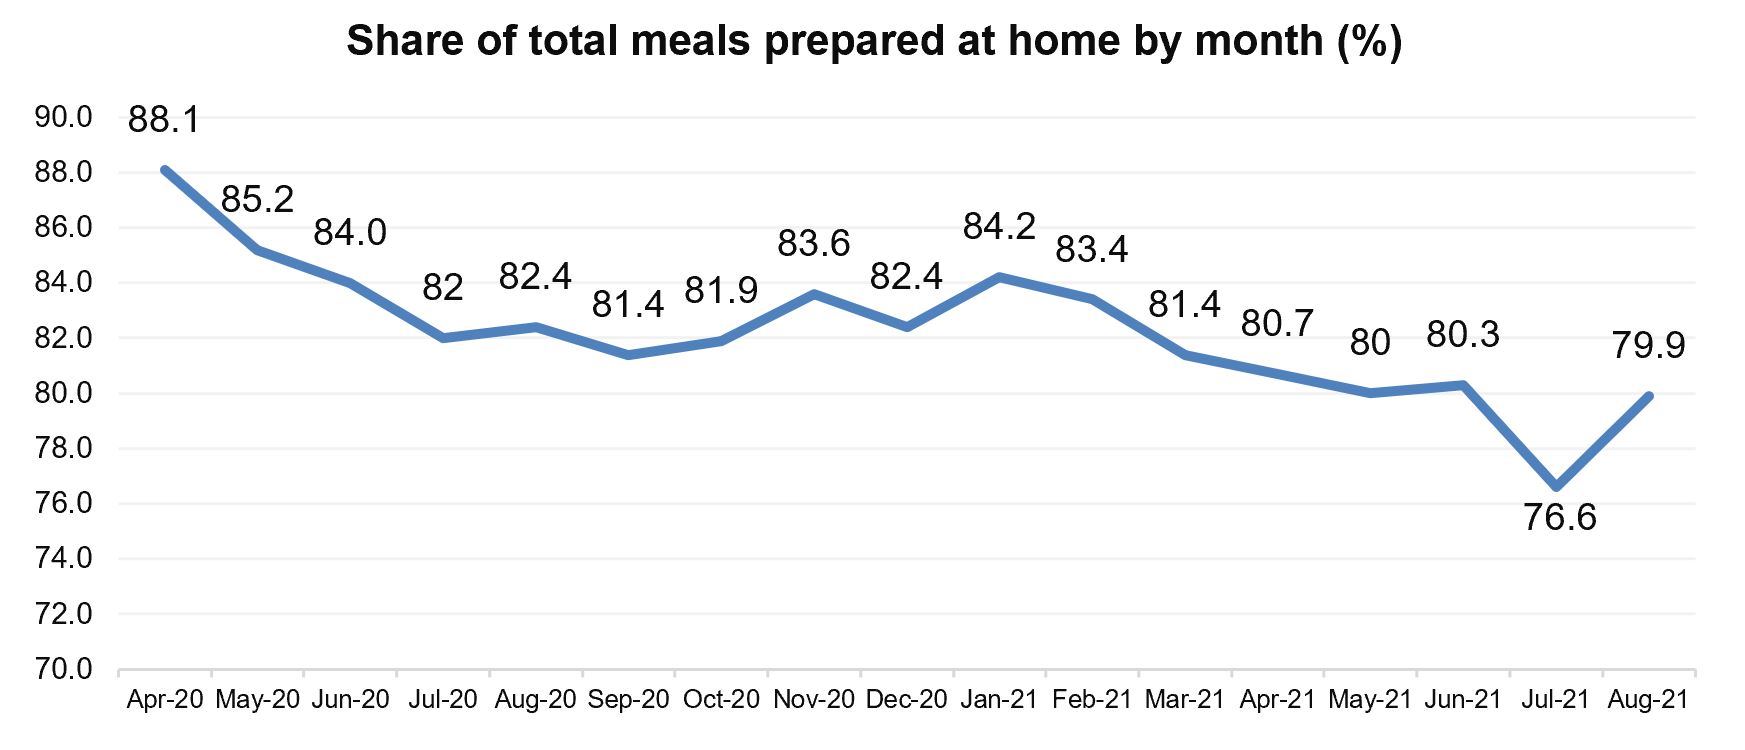
The multi-month normalization of grocery shopping patterns came to a halt in August.
“Since January 2021, we had been seeing the share of meals prepared at home decrease a little each month,” said Jonna Parker, Team Lead Fresh with IRI. “However, with the elevation of COVID-19 cases in the past month, IRI’s latest survey wave among primary shoppers found that the share of meals prepared at home increased once more to nearly 80% from 76.6% in July.”
At the same time, the survey found that people were a little less likely to eat on premise at restaurants. After reaching a high of 50% of primary shoppers in July, the share dropped to 48% in August. Restaurant takeout remained at its high pandemic levels: 53% of consumers have gotten takeout and 20% had restaurant food delivered in the past few weeks.
“Additionally, August saw a bit of an uptick in ecommerce orders after several months of trips moving back to in-person visits,” said Parker. “While these are small shifts, online versus in-store trips can mean different items being purchased, but can also affect impulse areas, including fruit and floral.” The survey also found that shoppers continued to spend less time in-store than they did pre-pandemic.
Combined, all these changes point to the increase in COVID-19 cases across the country prompting some reversal in the normalization of grocery shopping patterns. IRI, 210 Analytics and the Produce Marketing Association (PMA) have teamed up since March 2020 to document the ever-changing marketplace and its impact on fresh produce sales.
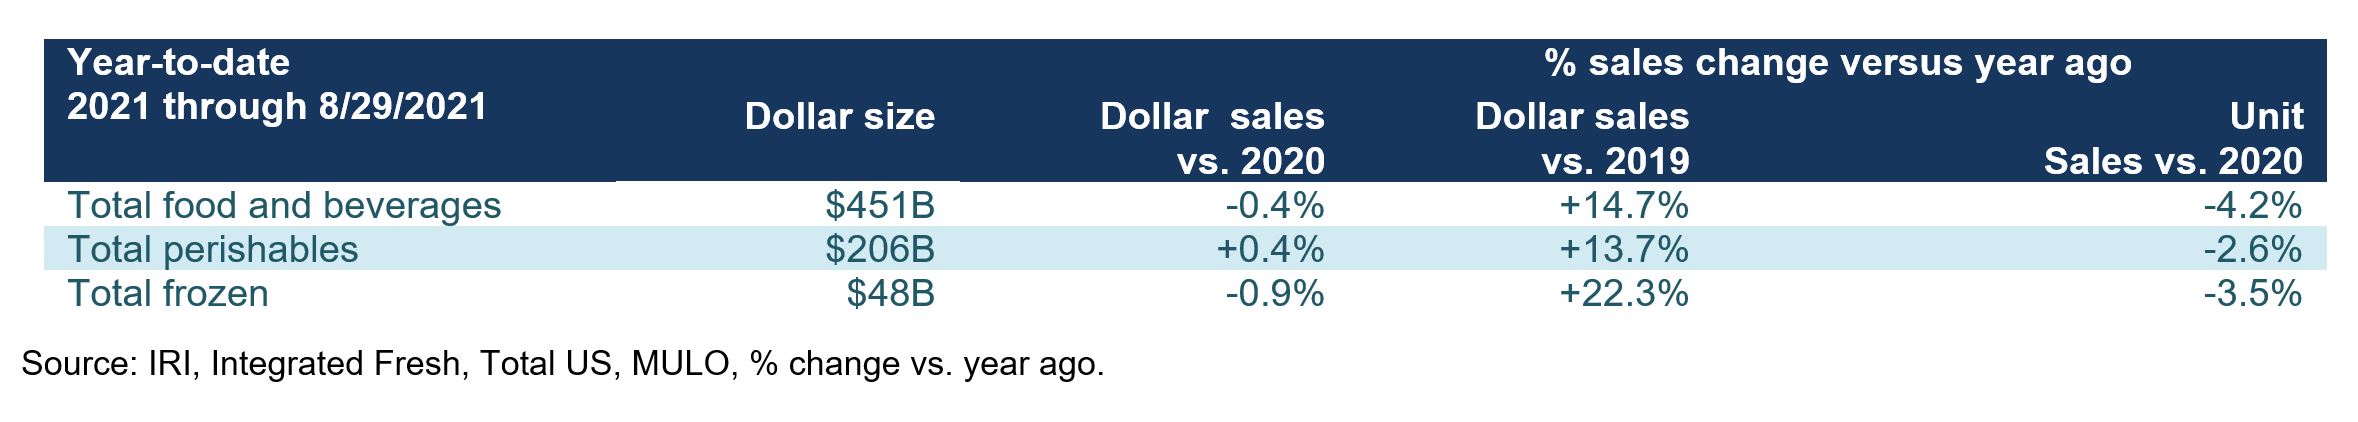
Year-to-Date Sales
The first eight months of the year brought $451 billion in food and beverage sales, which was down just 0.4% from the same period in 2020 – edging closer to year-ago levels each month. Unit sales, however, were down 4.2%. When compared to 2019, dollar sales were up 14.7%. The same pattern holds true for total perishables and frozen items. Frozen foods have the highest increase versus the pre-pandemic normal of 2019, at +22.3%.
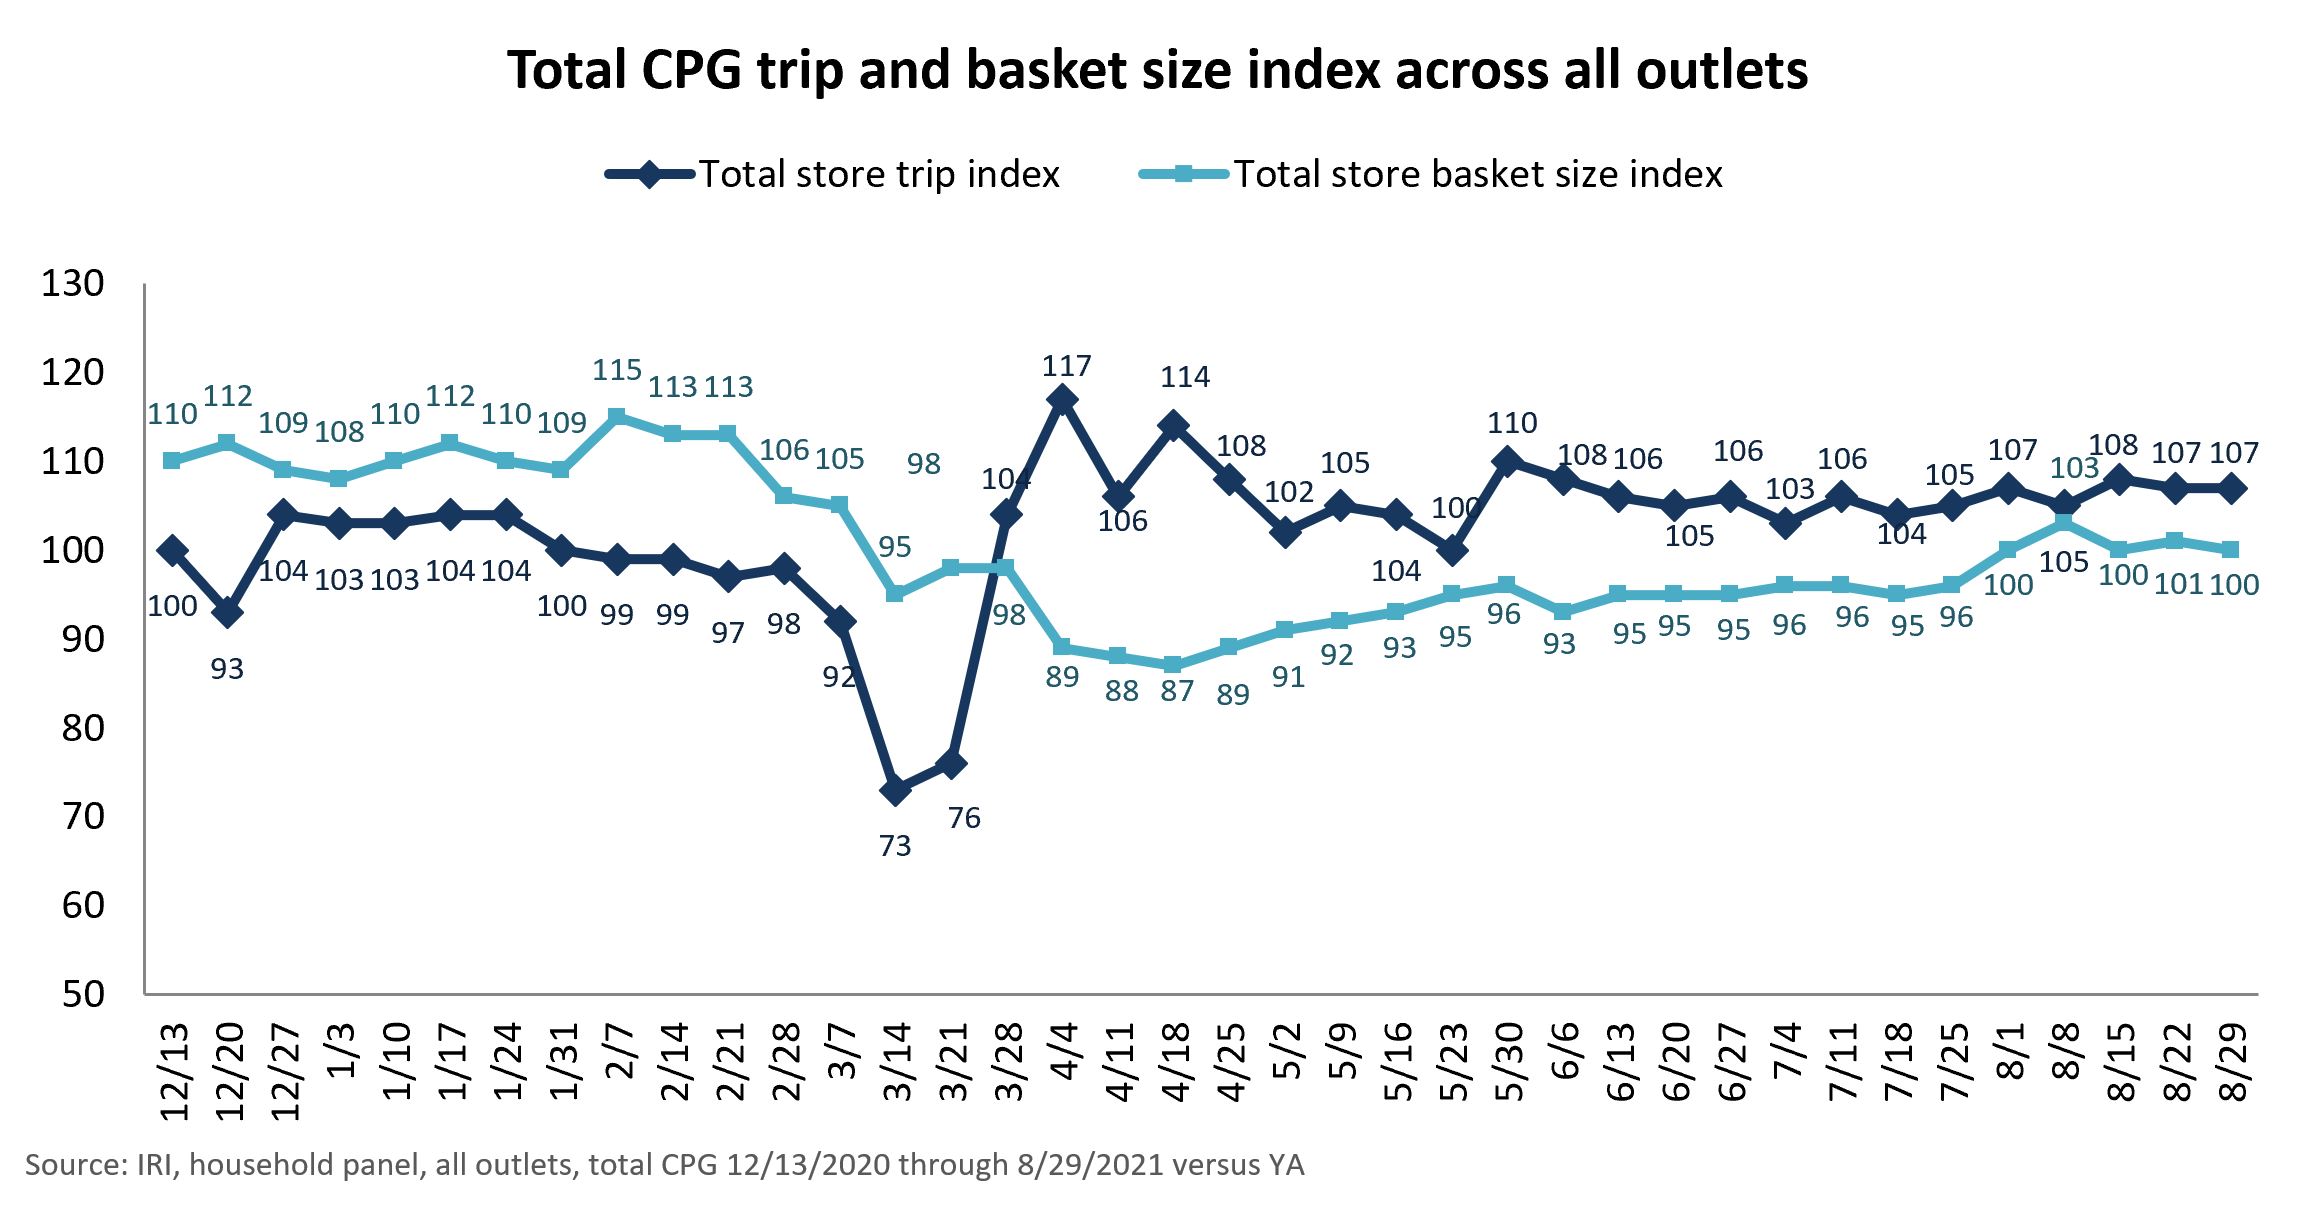
Trips and Basket Size
2020 had many fewer in-store trips but a highly elevated basket size when people did shop. Come March, that picture reversed with trips trending well above 2020 levels. August was the first month where both in-store trips and the average basket size trended on par or above year-ago levels. The combination of elevated trips and spending is what drove the strong August sales performance.
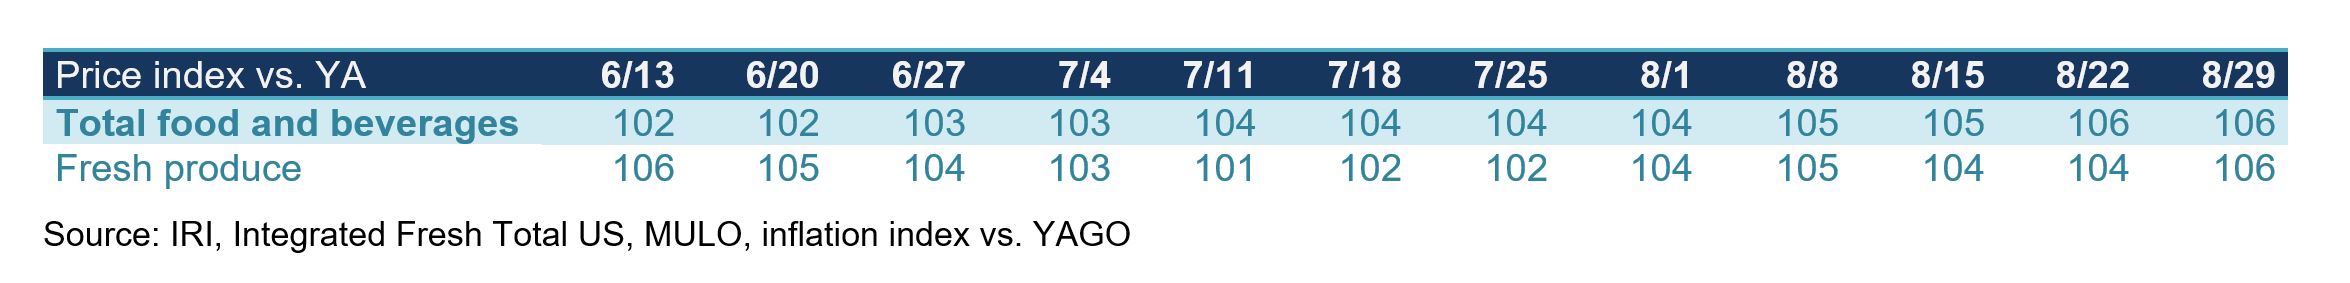
Food Inflation
Food retail price inflation has become a big topic of discussion in recent months and produce prices, by and large, are no exception. IRI-measured price inflation (i.e. dollars divided by volume sold at retail) shows that prices continued to rise over and above their elevated 2020 levels for total food and beverages. The price index for fresh produce is right in line with total food and beverages most weeks currently showing a 6% increase versus 2020 this past August. The July numbers from the Bureau of Labor Statistics (BLS) showed record increases for restaurant prices and very similar increases for food-at-home.
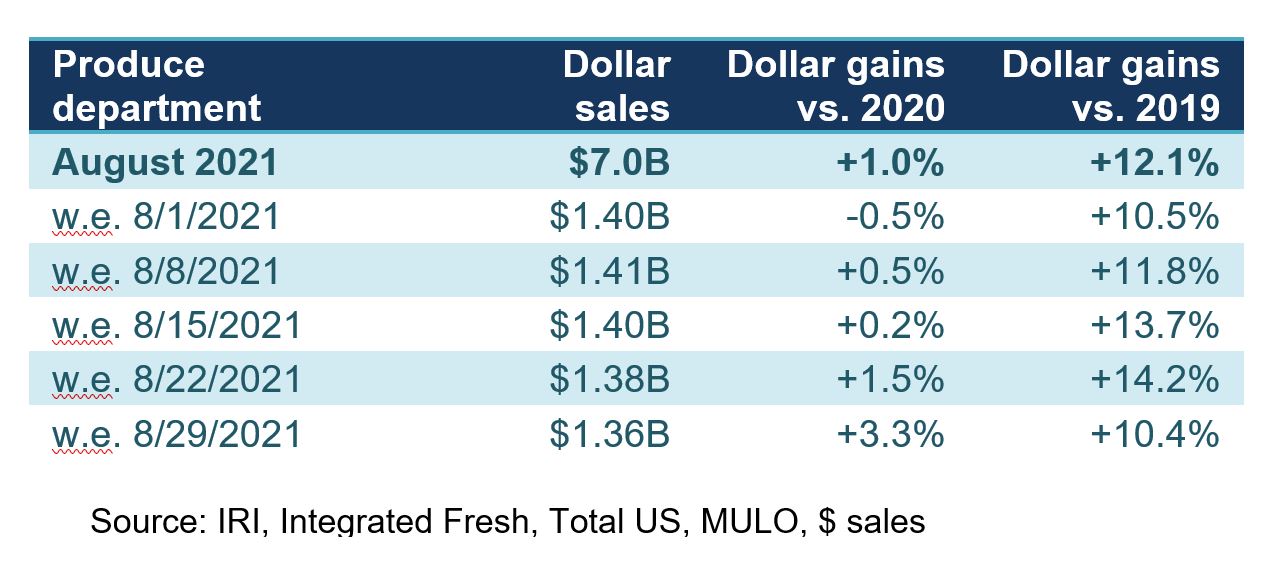
Week-by-Week Sales Fresh Produce
Fresh produce accomplished very consistent sales each of the five August weeks, right around $1.4 billion. That meant an uptick over year-ago levels most weeks.
Combined, the five August weeks generated $7.0 billion, which was up 1% year-over-year and 12% over pre-pandemic August 2019.
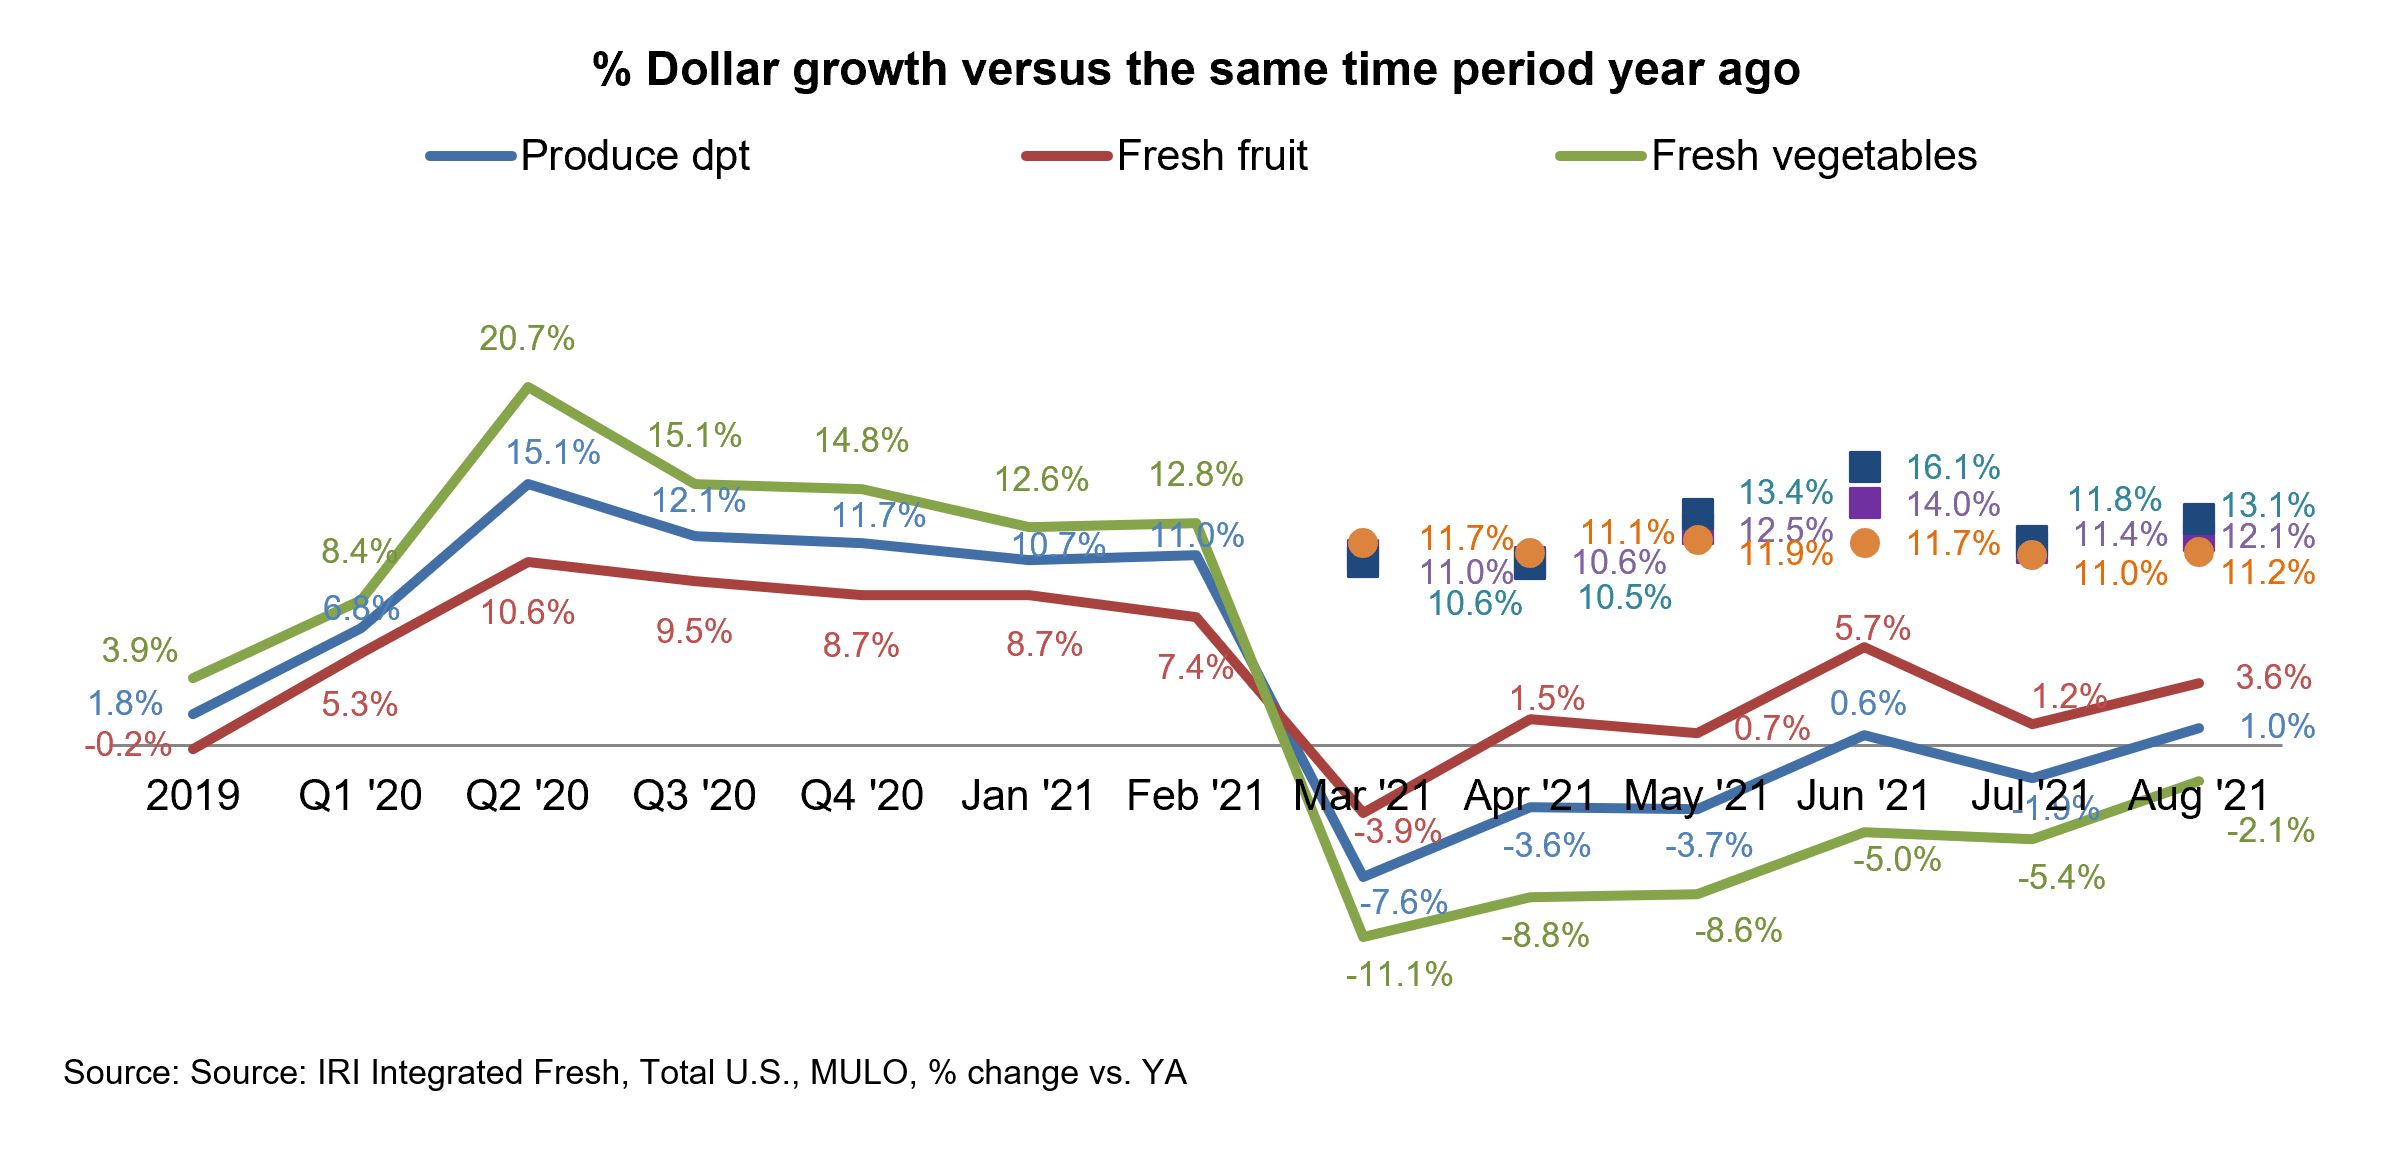
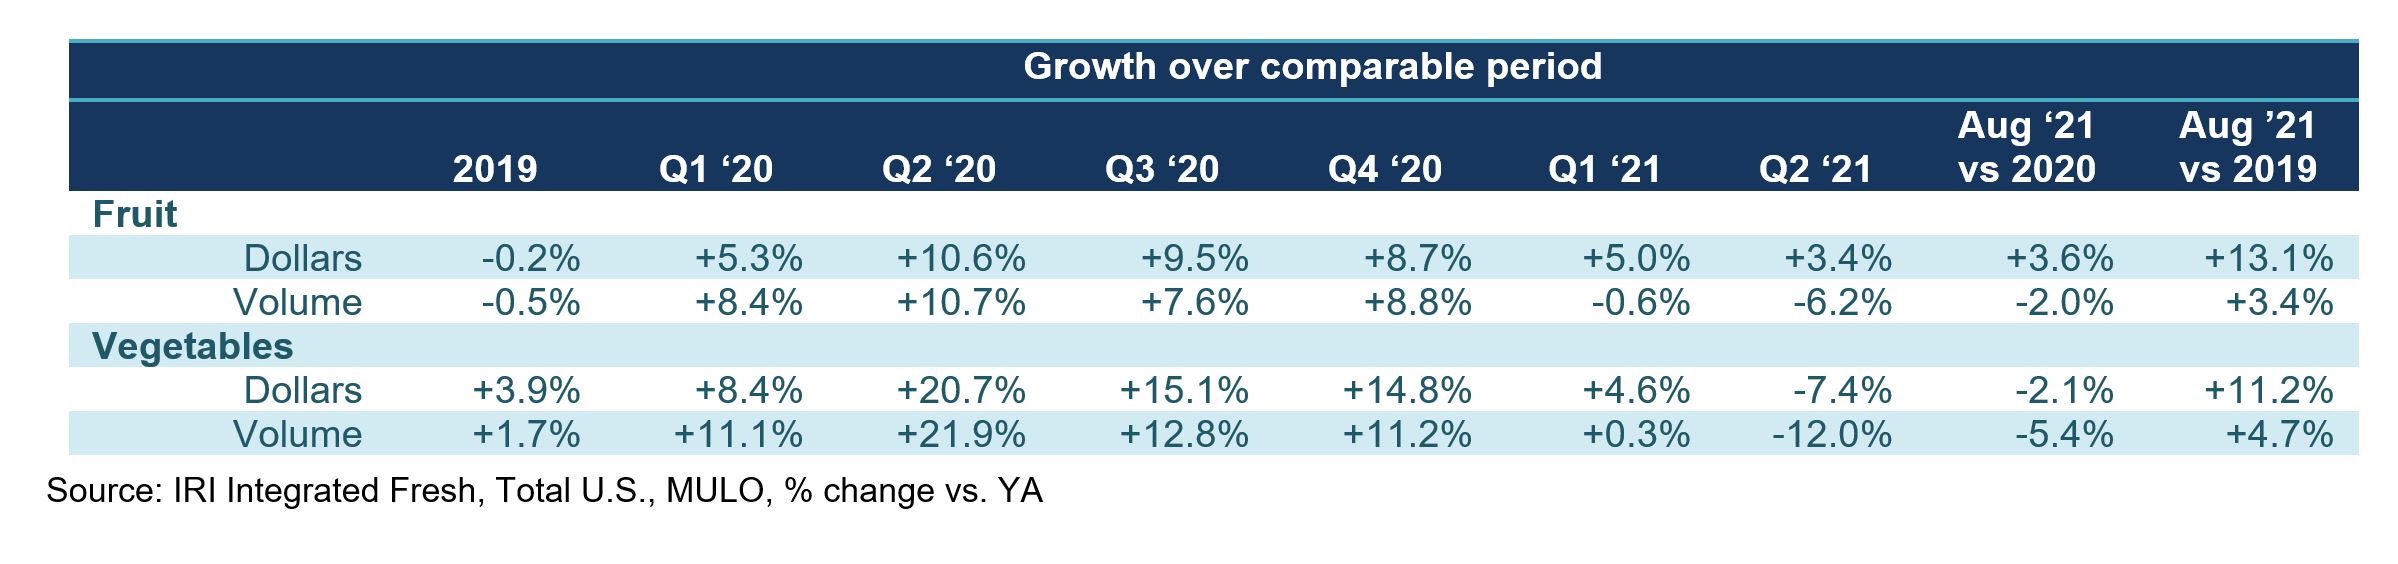
“August delivered the strongest year-on-year results we have seen since having to go up against the pandemic sales peaks in March,” said Joe Watson, VP of Membership and Engagement for PMA. “Once more, it was fruit sales that boosted overall fresh produce sales past year ago levels, but vegetables had a very strong August as well, now within just two points from the 2020 sales levels. The difference in fruit and vegetable year-over-year performance lies in their 2020 sales results. Vegetables had much higher gains in 2020, which means a tougher road for growth this year. Additionally, fruit has experienced slightly higher inflation thus far in 2021 than vegetables, which boosts dollar sales gains.”
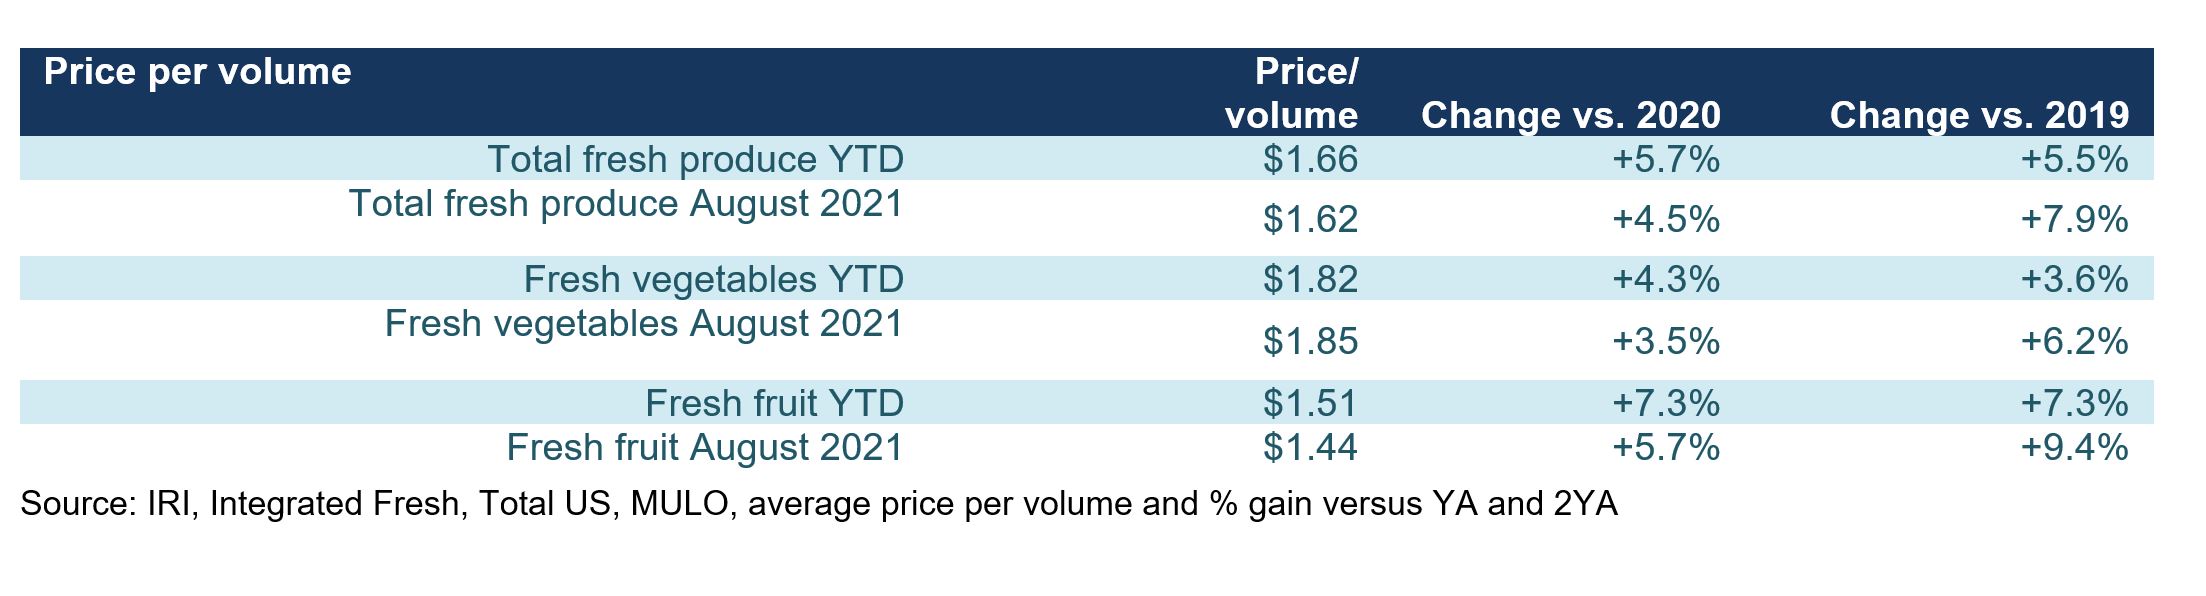
Watson is referring to the 5.7% increase in the price per pound for fresh produce since the start of 2021 versus the same period in 2020. The average price per pound for fruit has increased 7.3% during this period, versus just 4.3% for vegetables.
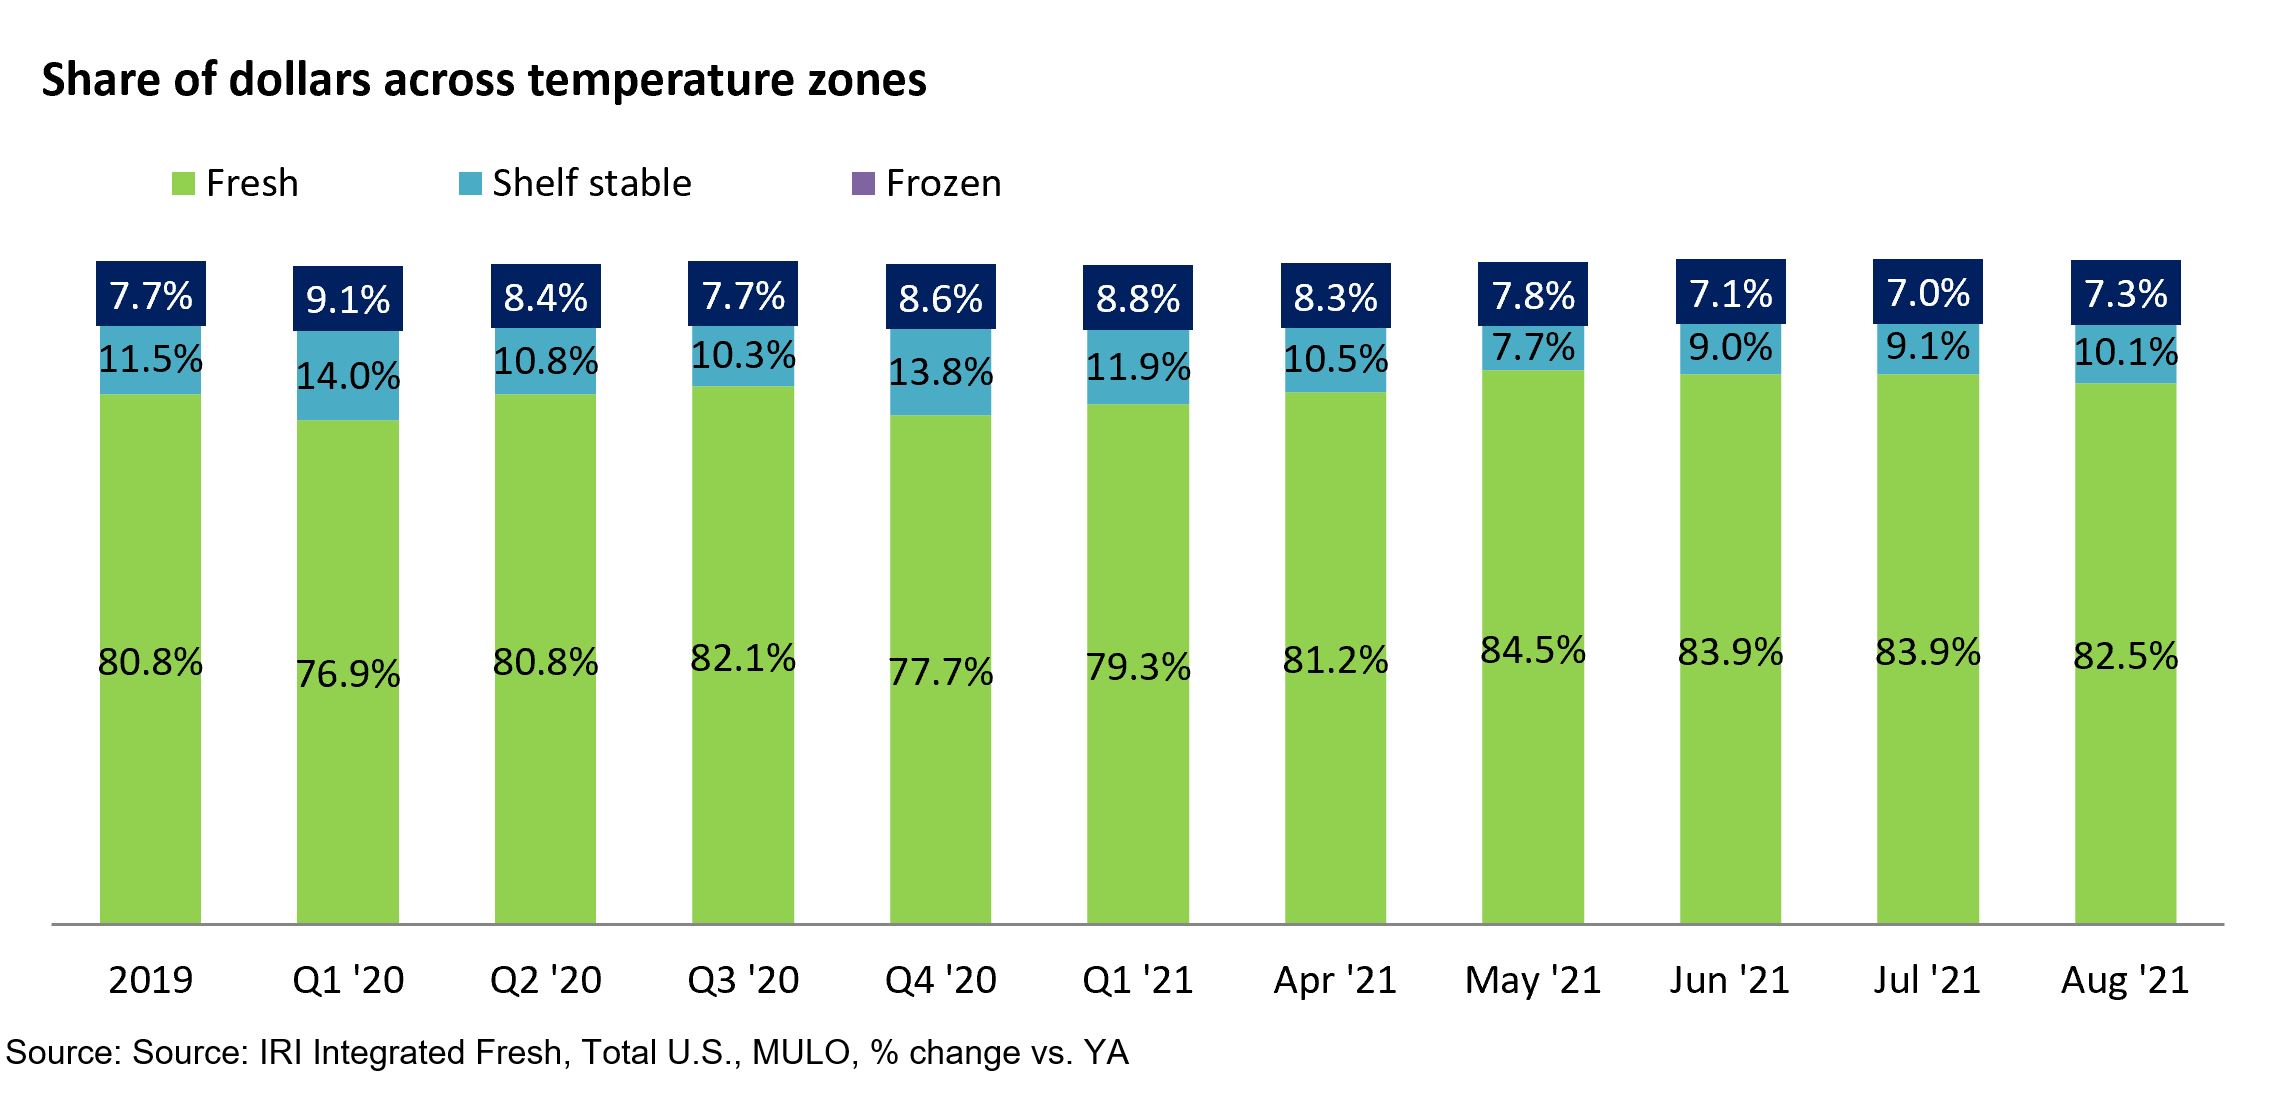
Fresh Share
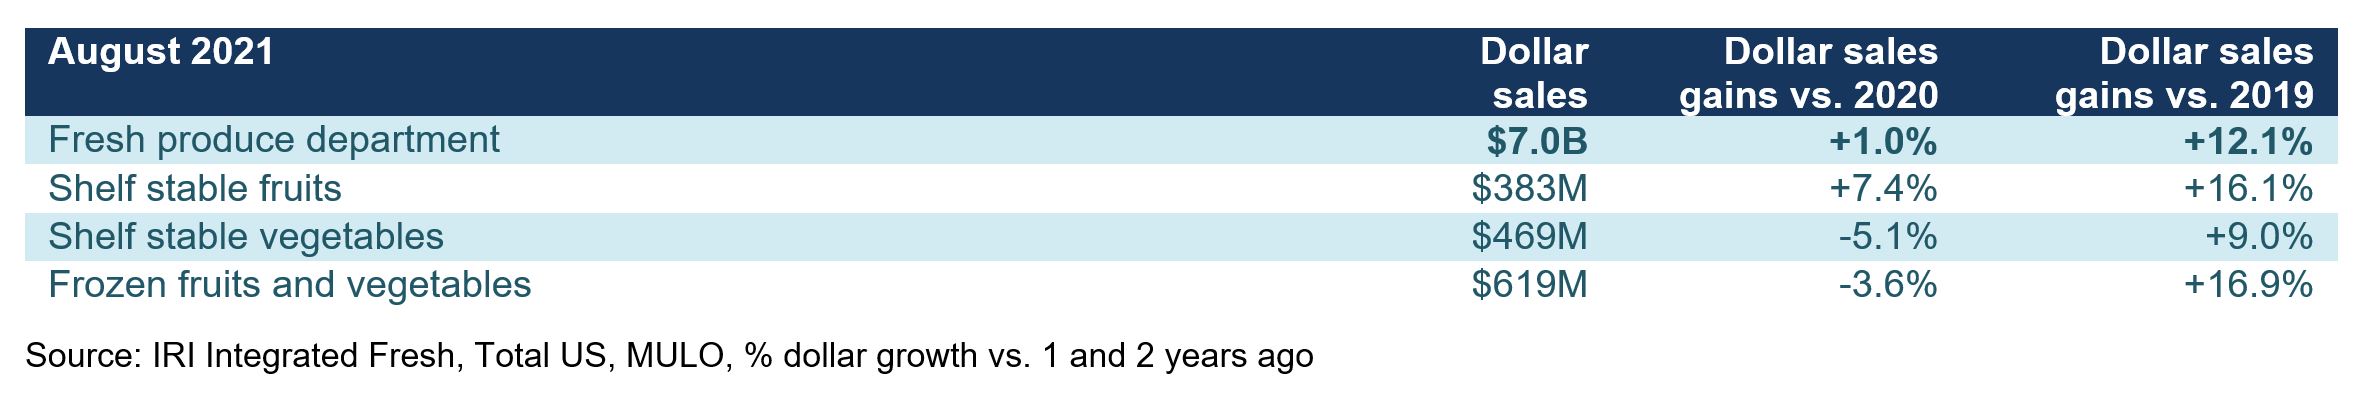
In addition to year-over-year growth in fresh fruit, shelf-stable fruit also gained, at +7.4%. Frozen fruits and vegetables remained up about 17% sales growth over 2019 but could not match their highly elevated 2020 performance.
“The fresh share of total fruit and vegetable dollars across the store remained dropped slightly this August,” said Watson. “Frozen fruit and vegetable sales took back a little of the share they had lost over the last two months and are back to 7.3% in August of 2021. While 82.5% of total fruit and vegetable dollars is the smallest share for fresh produce dollars we have seen since April, in part this is due to inflation now also hitting frozen and shelf stable areas to the same tune as fresh.”
Fresh Produce Dollars versus Volume
The gap between the fresh produce dollar and volume performance persisted in August. Importantly, both dollars (+12.1%) and pound sales (+3.9%) tracked well ahead of 2019’s rates — meaning retail continues to sell many more pounds of fresh produce in August 2021 than it did pre-pandemic.
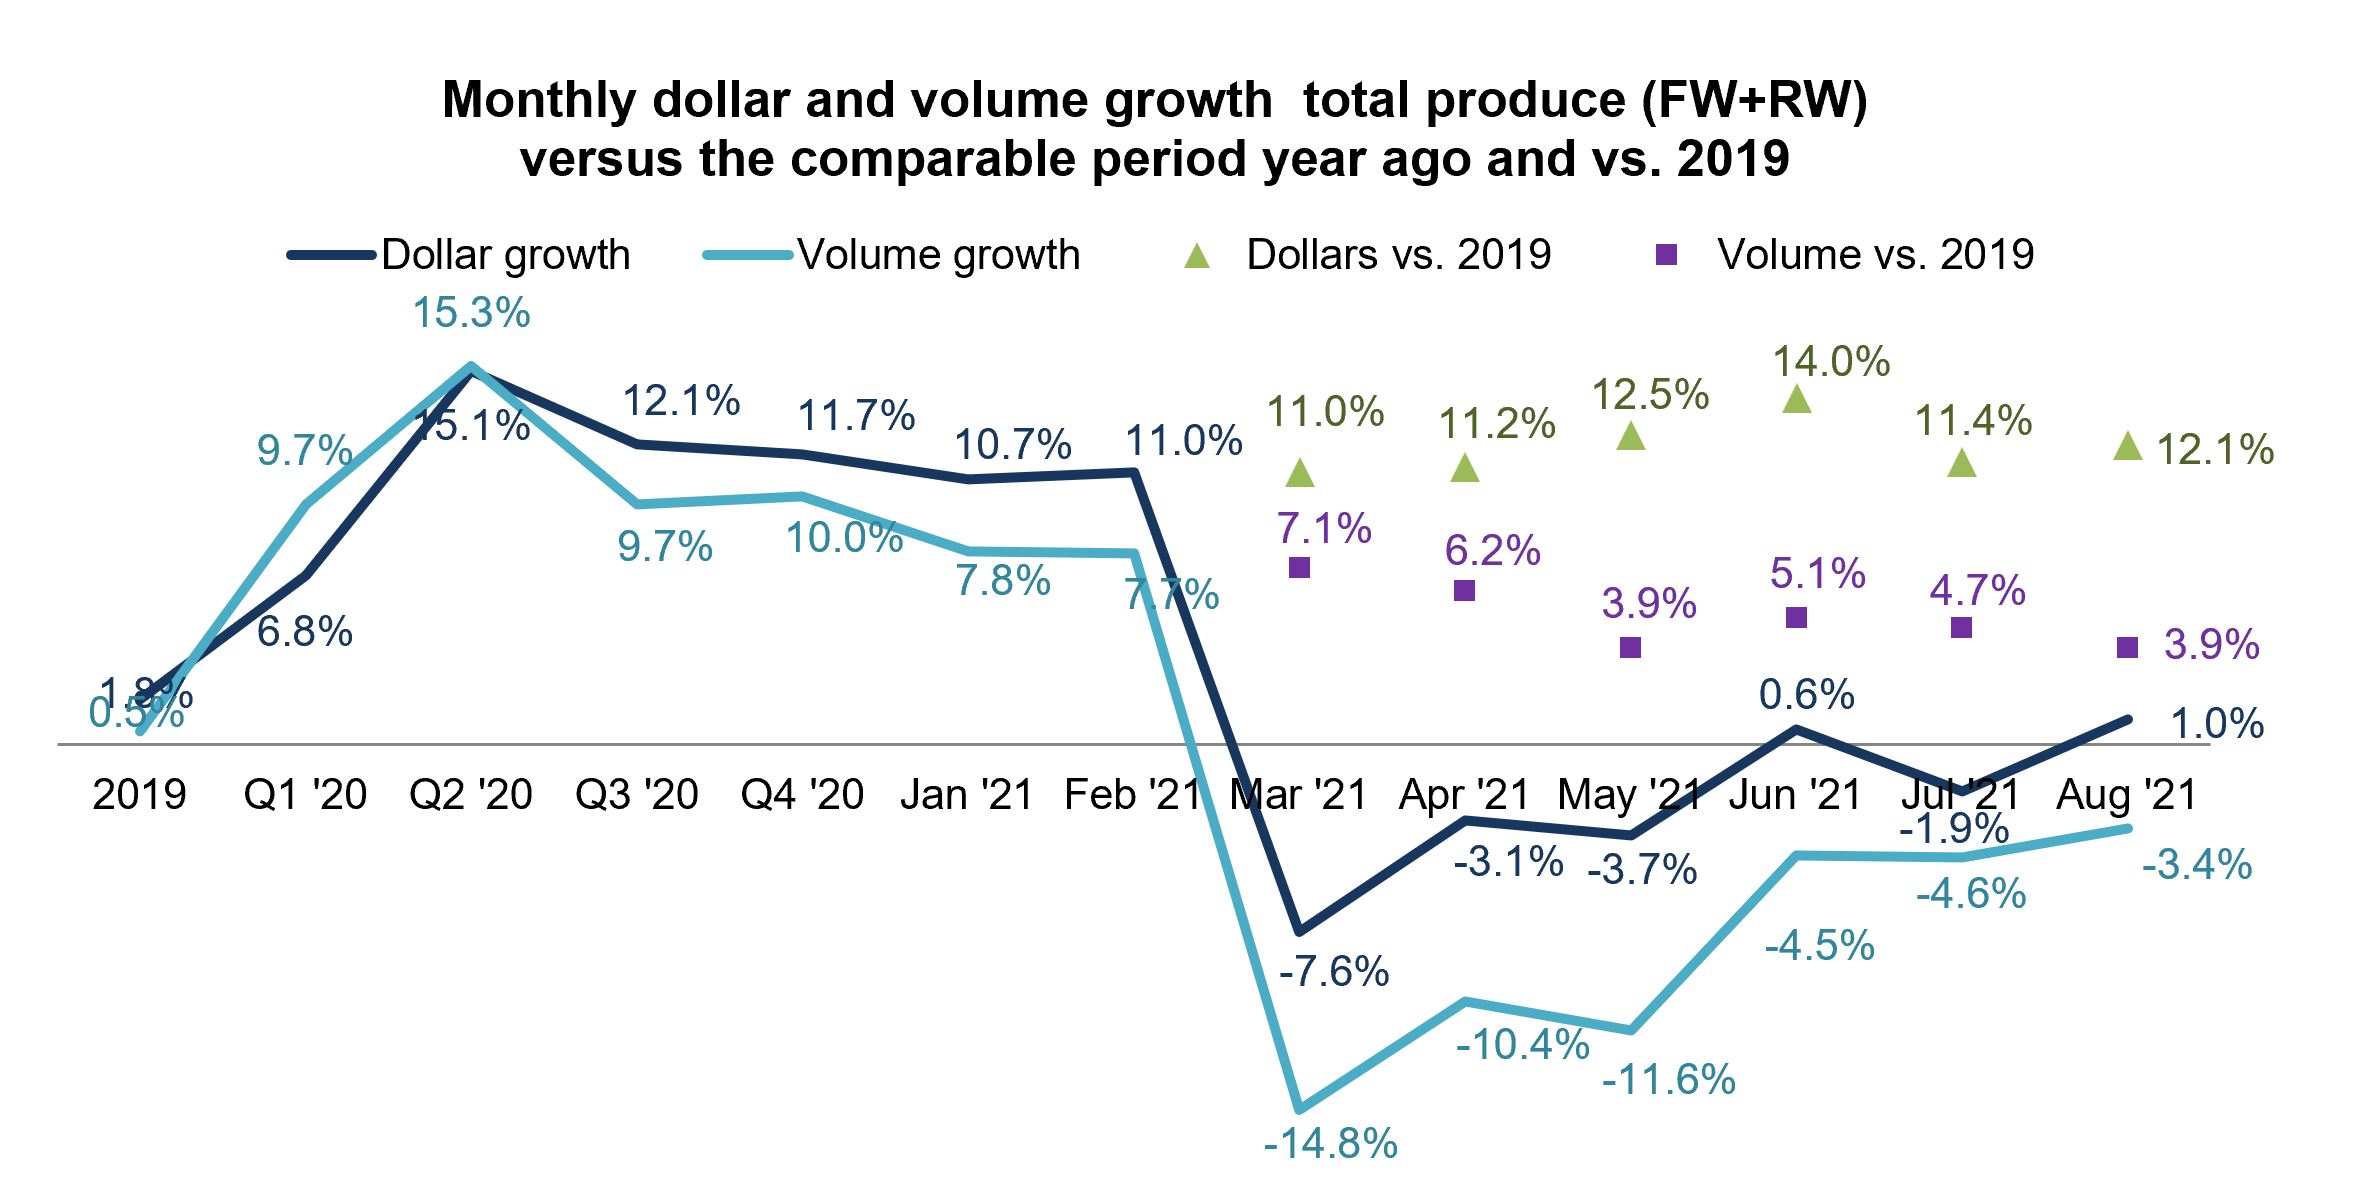
“Comparing 2021 vegetable pound sales versus the pre-pandemic 2019 normal is particularly impressive,” said Watson. “Free and clear of the effect of inflation, it shows that U.S. retailers sold 4.7% more pounds of vegetables in August 2021 than the same month in 2019. Retailers sold an additional 3.4% pounds of fruit. That means there is still a lot more product moving through the system today. Consumers continuing to solve 80% of meals at home is the driver there.”
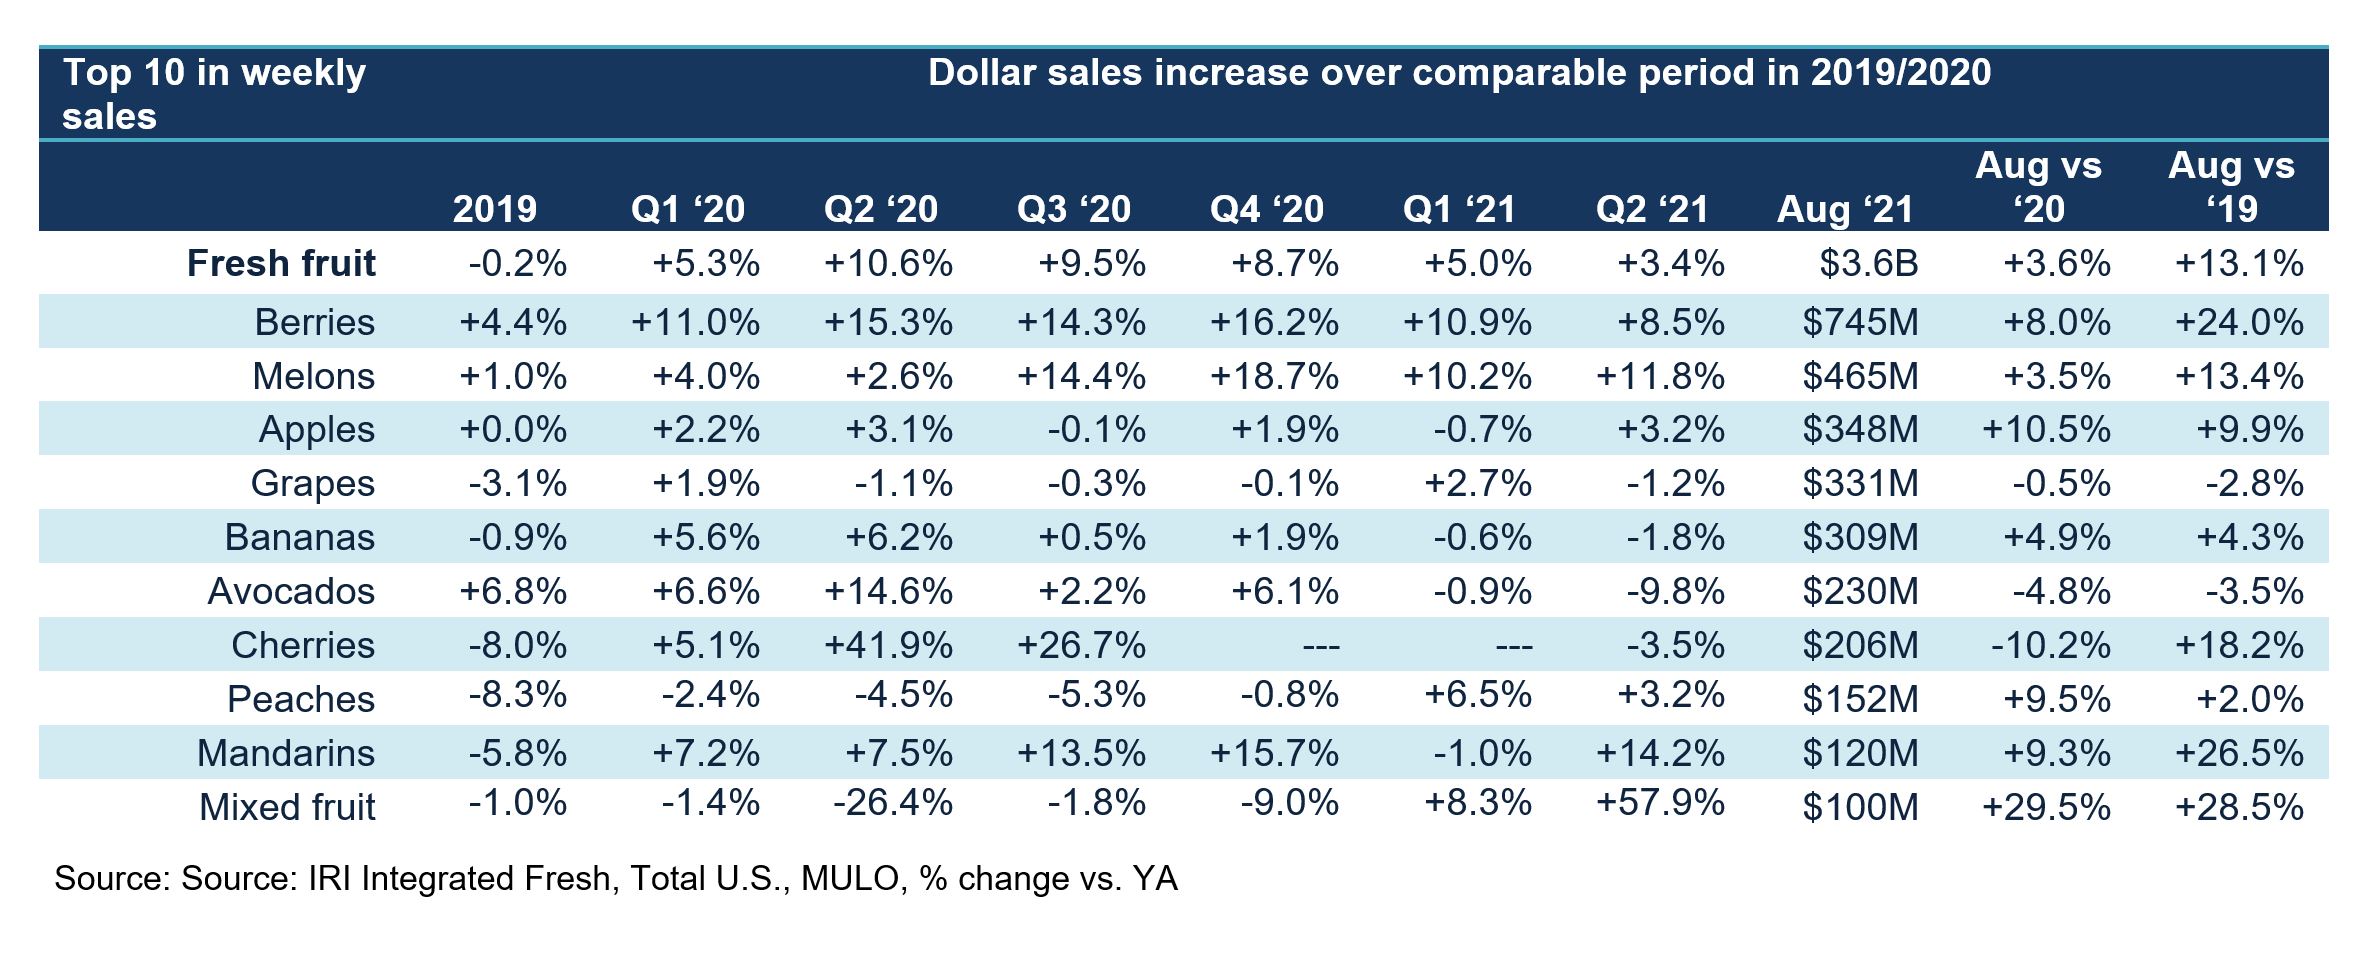
Fresh Fruit Sales in August
“Cherry season is always fast and their top three sales rank placement was short lived,” said Parker. “Yet, cherry sales remain in the top 10, with apples, grapes bananas and avocados showing strong sales. Importantly, all but three fruits managed to improve sales year-over-year in August and apples and mixed fruit grew sales by double digits. Deflation in avocados has been pulling sales down for a while, even though engagement and volume sales are strong.”
Berries, apples, bananas and grapes have been steady top 10 sellers, but mandarins, peaches, cherries and mixed fruit are all relative newcomers. Cherries and peaches tend to have short selling seasons and mandarins replaced oranges to represent citrus fruits.
Fresh Vegetables Sales in August
“Vegetables generated about $3.2 billion in August sales with many of the same powerhouses we have seen all year,” said Watson. “Mushrooms climbed a bit higher in the rankings with nice year-on-year gains and broccoli bumped corn out of the top 10.”

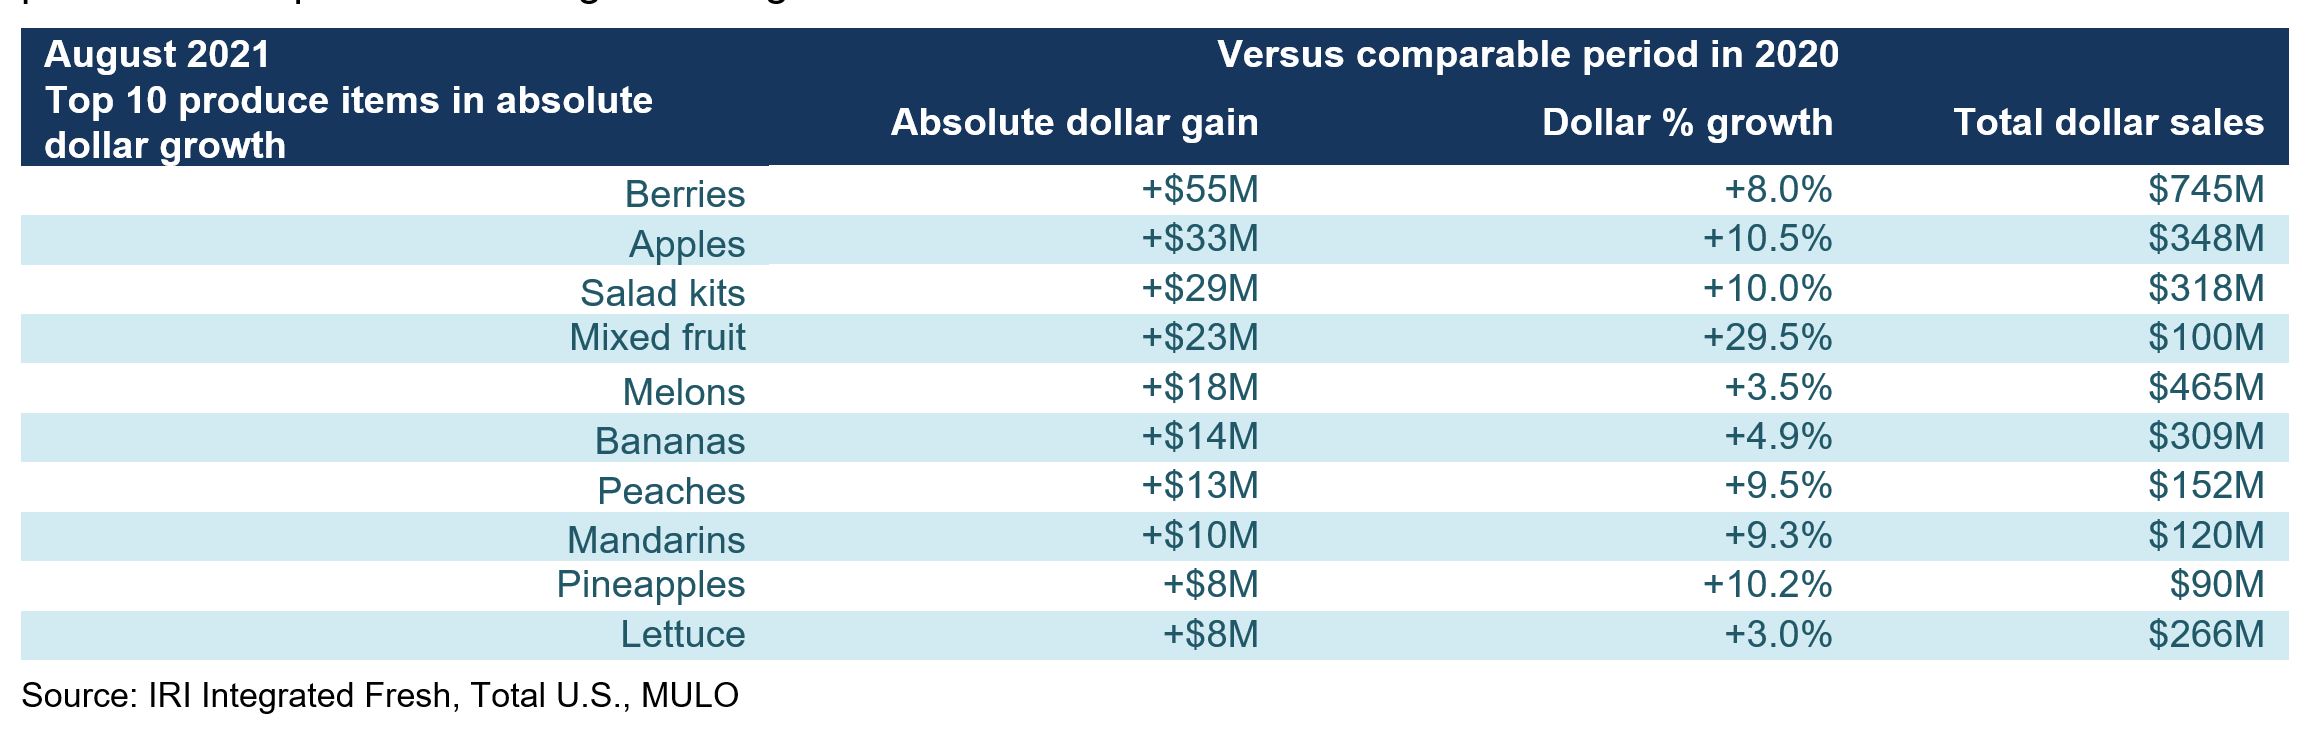
Absolute Dollar Gains
“The top 10 in absolute sales show both small and large categories can be significant contributors to growth,” said Parker. “Berries have been a pandemic powerhouse for many, many months, but areas such as peaches, mandarins and pineapples show the importance of seasonal offerings to department sales. Key is extending that interest into other parts of the department- taking advantage of seasonal interest to showcase within Produce and across the store.”
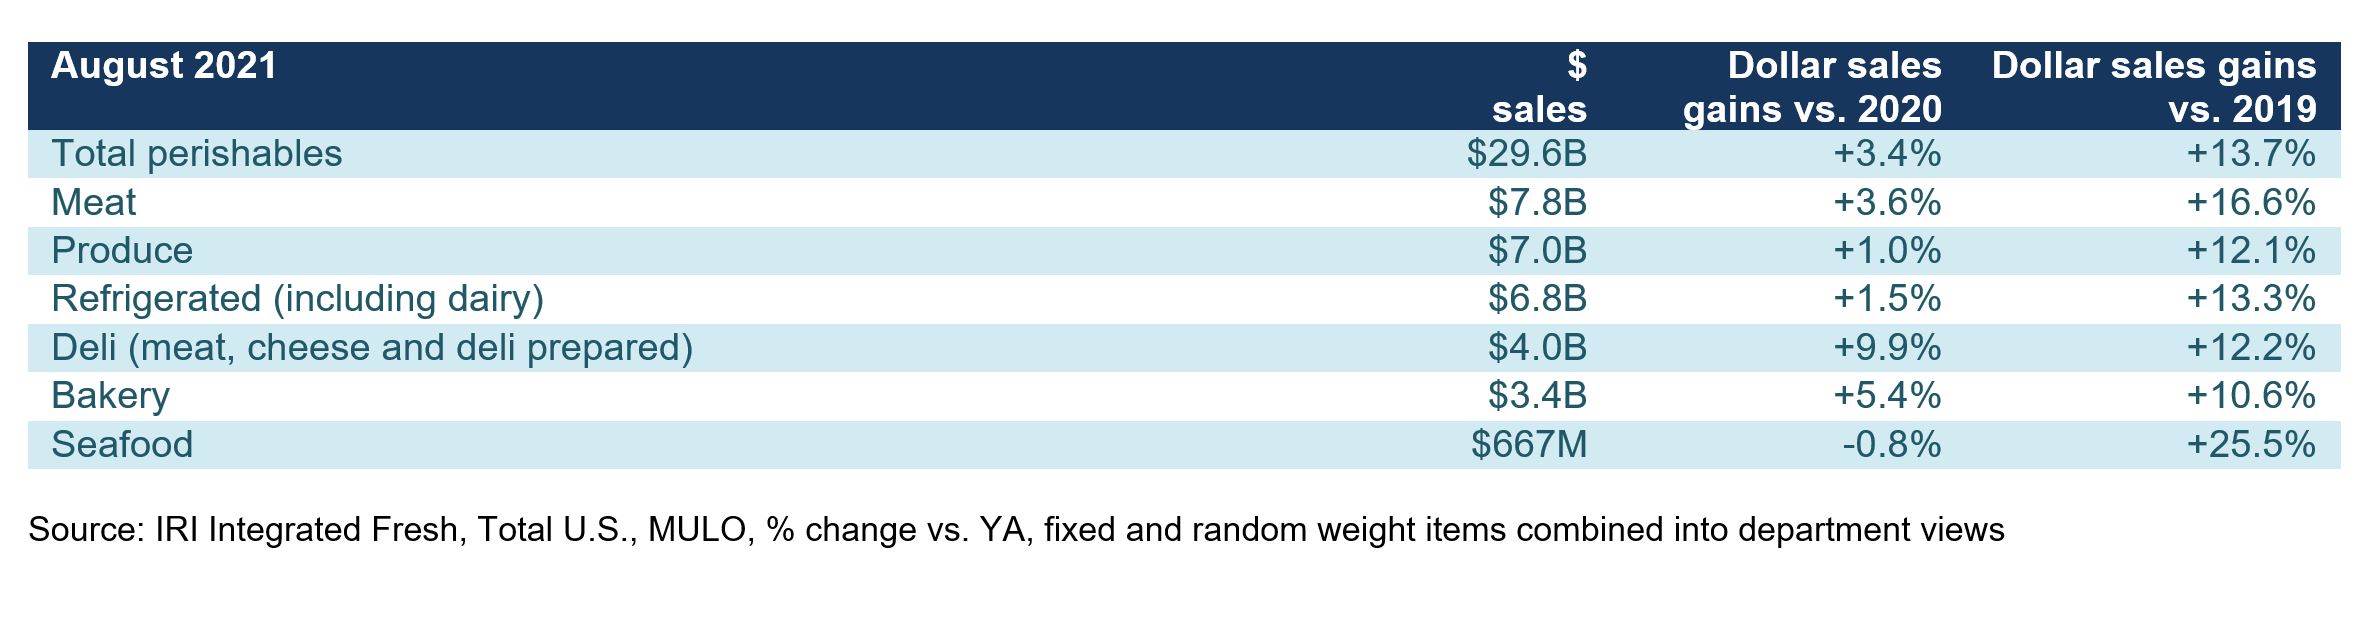
Perishables Performance
A look across fresh foods departments for the five August weeks shows perimeter strength. All but fresh seafood gained year-over-year, with the highest increases going to deli and bakery. It is important to remember, however, that the year-on-year look is heavily influenced by the 2020 performance which was off for these two departments versus up significantly for meat, produce, refrigerated and seafood.
Floral
Floral sales have been seeing double-digit gains ever since the third quarter of 2020 and growth is only accelerating. For the building calendar year, the weeks between January and September 9, 2021, floral has generated nearly $5.4 billion in sales. This reflects an increase of 25.8% versus the same period a year ago.
What’s Next?
The elevated COVID-19 case counts prompted some reversal in the normalization of shopping patterns, but nothing like the changes seen in 2020 or earlier this year. Engagement with restaurants remained high even if slightly fewer people ate on premise. The mix of food service and retail solving consumer meal needs remains tipped to the retail/at home side for the foreseeable future as it has been since March 2020.
As of yet, most school districts are planning to resume in-person education. As of the second week of August, the IRI survey found that:
• 11% of kids ages six to 12 and 14% of teenagers will be in virtual education.
• 4% of children 6-12 and 5% of teenagers will be in hybrid education (a combination of virtual and in person)
• 79% of children 6-12 and 37% of teenagers will be at school in person.
This is in vast contrast to August 2020 when 58% of children were in virtual education and only 16% of children attended school in person.
Additionally, fewer people are working from home. In August 2020, 34% of primary shoppers in the IRI survey were working from home five days a week versus 28% in the August 2021 wave. Likewise, the share who works from home one or more days a week decreased from 53% to 46%.
This may have implications for items that are typical lunchbox solutions as well as change the dynamics between units and volume. Since the start of the pandemic, large servings/family packs have been popular, resulting in stronger volume versus unit gains. However, with schools and offices reopening, we may start to see a shift back to more on-the-go, single-serve solutions.
The next report, covering September, will be released in mid-October. We encourage you to contact Joe Watson, PMA’s Vice President of Membership and Engagement, at jwatson@pma.com with any questions or concerns. Please recognize the continued dedication of the entire grocery and produce supply chains, from farm to retailer. #produce #joyoffresh #SupermarketSuperHeroes.
Date ranges:
2019: 52 weeks ending 12/28/2019
Q1 2020: 13 weeks ending 3/29/2020
Q2 2020: 13 weeks ending 6/28/2020
Q3 2020: 13 weeks ending 9/27/2020
Q4 2020: 13 weeks ending 12/27/2020
Q1 2021: 13 weeks ending 3/28/2021
Q2 2021: 13 weeks ending 6/27/2021
August 2021: 5 weeks ending 8/29/2021
