Scattered growing regions, each with their own challenges, characterize the current state of produce markets.
After leaving Georgia, Eastern vegetables are now harvested in a large number of states, including North Carolina, Tennessee, New Jersey, Michigan and others.
The upcoming Olympic boxing matches resemble the fight for quality produce in the summer.
The year is shaping up to have extreme heat, forest fires, supply inflation, driver shortages, and a busy hurricane season. All these factors will lead to price (and quality) variability over the next few months.
Blue Book has teamed with ProduceIQ BB #:368175 to bring the ProduceIQ Index to its readers. The index provides a produce industry price benchmark using 40 top commodities to provide data for decision making.
ProduceIQ Index: $1.05 /pound, +4.0 percent over prior week Week #28, ending July 16th
Even though decentralized harvesting regions complicate logistics, options exist for nimble procurement to find quality somewhere. Green bell pepper, for example, is grown in California and a handful of Eastern states.
Overall, supply is steady, and demand is healthy. In the West, heat is bringing an early close to California’s season in Bakersfield, and Fresno is just beginning production. High freight costs make FOB shipping point a significant factor in sourcing.
In the East, supply is generally lighter as Georgia ended and harvesting is scattered among multiple states. This is the opportune time for most local programs.
Historically, green bell pepper prices have a wide range until demand tends to slump in mid-August.
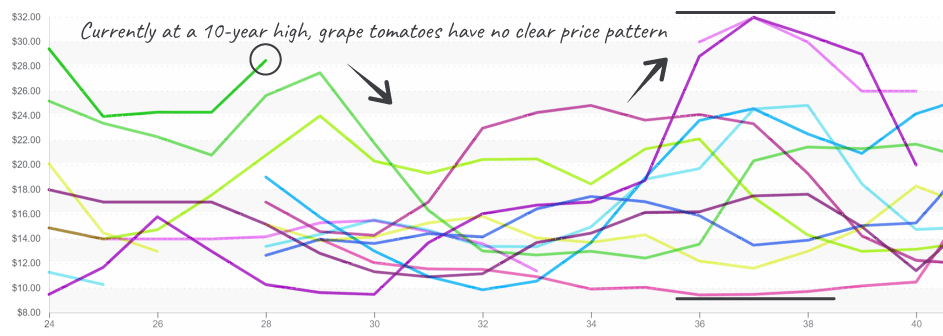
Led by increases in grape and cherry varieties of tomatoes, ProduceIQ’s Tomato category index is at a ten-year high. Grape tomatoes are charting new price territory.
Heat in the Western U.S. is stunting Californian supply. Although reports on grape and cherry tomato vary due to the sprawling nature of summer growing regions, the supply of grape and cherry tomatoes on these labor-intensive crops is limited.
Grape Tomatoes in the East near $30 per case, though typically move lower by late July.
Belated transition from California to Mexico is tightening up Avocado markets. Decreases in the availability of smaller avocados in pushing up prices on all sizes. Mexican “Loca” Avocados are not meeting U.S. avocado industry “dry matter” standards.
Dry matter standards are the percentage of oil content inside the avocado. In the U.S., that percentage must be over 23 percent. High elevation farms in Mexico are taking advantage and prices should remain elevated.
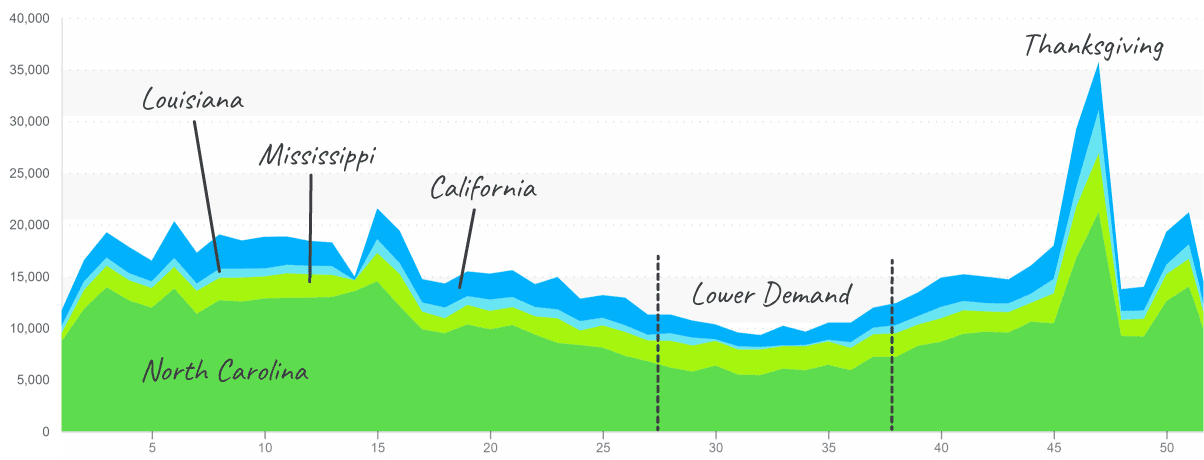
Buoyed by increased demand from Europe and lower inventory, sweet potatoes are experiencing above-average pricing. Consistent demand for this shelf-stable crop and a weakening supply on larger sizes is causing markets to hold around $17 per case.
Historically, movement volume lessens from now through week #36, which then ramps up to Thanksgiving. Markets on sweet potatoes may change if North Carolina is impacted by any supply disruptions.
Sweet Potatoes are experiencing increased demand and above-average prices. (2019 volume is typical movement by region. Chart units are 1,000 pounds.)
Weak harvests out of Mexico and California are elevating blackberry and raspberry prices. Berry growers in the West will continue struggling to increase volumes for the remainder of season as they battle drought and heat. Labor is an added challenge for growers who raise manual-intensive crops like berries.
The ProduceIQ Index is the fresh produce industry’s only shipping point price index. It represents the industry-wide price per pound at the location of packing for domestic produce, and at the port of U.S. entry for imported produce.
ProduceIQ uses 40 top commodities to represent the industry. The Index weights each commodity dynamically, by season, as a function of the weekly 5-year rolling average Sales. Sales are calculated using the USDA’s Agricultural Marketing Service for movement and price data. The Index serves as a fair benchmark for industry price performance.
Scattered growing regions, each with their own challenges, characterize the current state of produce markets.
After leaving Georgia, Eastern vegetables are now harvested in a large number of states, including North Carolina, Tennessee, New Jersey, Michigan and others.
The upcoming Olympic boxing matches resemble the fight for quality produce in the summer.
The year is shaping up to have extreme heat, forest fires, supply inflation, driver shortages, and a busy hurricane season. All these factors will lead to price (and quality) variability over the next few months.
Blue Book has teamed with ProduceIQ BB #:368175 to bring the ProduceIQ Index to its readers. The index provides a produce industry price benchmark using 40 top commodities to provide data for decision making.
ProduceIQ Index: $1.05 /pound, +4.0 percent over prior week Week #28, ending July 16th
Even though decentralized harvesting regions complicate logistics, options exist for nimble procurement to find quality somewhere. Green bell pepper, for example, is grown in California and a handful of Eastern states.
Overall, supply is steady, and demand is healthy. In the West, heat is bringing an early close to California’s season in Bakersfield, and Fresno is just beginning production. High freight costs make FOB shipping point a significant factor in sourcing.
In the East, supply is generally lighter as Georgia ended and harvesting is scattered among multiple states. This is the opportune time for most local programs.
Historically, green bell pepper prices have a wide range until demand tends to slump in mid-August.
Led by increases in grape and cherry varieties of tomatoes, ProduceIQ’s Tomato category index is at a ten-year high. Grape tomatoes are charting new price territory.
Heat in the Western U.S. is stunting Californian supply. Although reports on grape and cherry tomato vary due to the sprawling nature of summer growing regions, the supply of grape and cherry tomatoes on these labor-intensive crops is limited.
Grape Tomatoes in the East near $30 per case, though typically move lower by late July.
Belated transition from California to Mexico is tightening up Avocado markets. Decreases in the availability of smaller avocados in pushing up prices on all sizes. Mexican “Loca” Avocados are not meeting U.S. avocado industry “dry matter” standards.
Dry matter standards are the percentage of oil content inside the avocado. In the U.S., that percentage must be over 23 percent. High elevation farms in Mexico are taking advantage and prices should remain elevated.
Buoyed by increased demand from Europe and lower inventory, sweet potatoes are experiencing above-average pricing. Consistent demand for this shelf-stable crop and a weakening supply on larger sizes is causing markets to hold around $17 per case.
Historically, movement volume lessens from now through week #36, which then ramps up to Thanksgiving. Markets on sweet potatoes may change if North Carolina is impacted by any supply disruptions.
Sweet Potatoes are experiencing increased demand and above-average prices. (2019 volume is typical movement by region. Chart units are 1,000 pounds.)
Weak harvests out of Mexico and California are elevating blackberry and raspberry prices. Berry growers in the West will continue struggling to increase volumes for the remainder of season as they battle drought and heat. Labor is an added challenge for growers who raise manual-intensive crops like berries.
The ProduceIQ Index is the fresh produce industry’s only shipping point price index. It represents the industry-wide price per pound at the location of packing for domestic produce, and at the port of U.S. entry for imported produce.
ProduceIQ uses 40 top commodities to represent the industry. The Index weights each commodity dynamically, by season, as a function of the weekly 5-year rolling average Sales. Sales are calculated using the USDA’s Agricultural Marketing Service for movement and price data. The Index serves as a fair benchmark for industry price performance.
Mark Campbell was introduced to the fresh produce industry as a lender for Farm Credit. After earning his MBA from Columbia Business School, he spent seven years as CFO for J&J Family of Farms and later served as CFO advisor to several produce growers, shippers and distributors. In this role, Mark saw the impediments that prevent produce growers and buyers to trade with greater access and efficiency. This led him to cofound ProduceIQ.