The West Coast is bracing for yet another heat wave this weekend. Embattled growers are developing creative solutions and seeking government aid to address heat related issues with summer crops.
A record 4.1 million acres burned last year, reducing the available fuel in some areas. Otherwise, fire season in California has ideal conditions to begin earlier and be more intense.
ProduceIQ Index: $1.01 /pound, -5.6 percent over prior week Week #27 ending July 9th
Blue Book has teamed with ProduceIQ BB #:368175 to bring the ProduceIQ Index to its readers. The index provides a produce industry price benchmark using 40 top commodities to provide data for decision making.
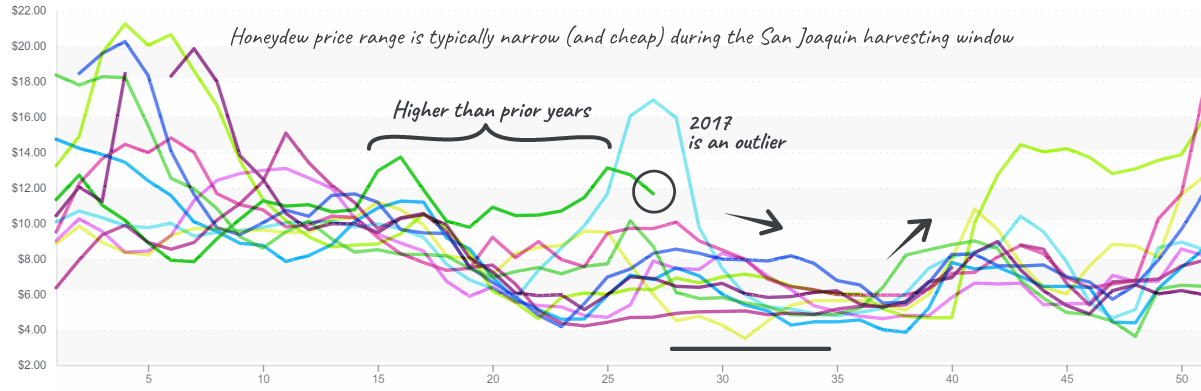
Though prices have been falling for two weeks, honeydew remains at its second highest price in the last ten years. Markets are in flux as growing fields transition and excessive heat dries out the drought sensitive commodity.
Harvesting crews should be commended for valiantly picking during very challenging conditions.
Honeydews transition to San Joaquin valley from Arizona and Southern California. The Mexican growing season is closed. Markets are reliant on the heat-exposed Central Valley growing region to meet demand.
Prices are down, but a slight shift in circumstances (like forecasted temperatures of 113 degrees Fahrenheit in The Central Valley) could quickly send prices in the opposite direction.
Honeydew movement by region for a typical year, 2019, is shown.
Honeydew prices, compared to many produce commodities, aren’t highly volatile. 2020 is higher priced than most years.
Northwest blueberry growers are reporting severe losses in yields due to the record-breaking heat wave. North Carolina, New Jersey, Michigan and Canada also have blueberries in limited supplies. Expect shortages throughout July and look for supply relief in August.
Cherry growers are facing the same unprecedented temperatures scorching the NW growing region.
Despite the unique challenges heat brings to growing cherries, in an interview with Blue Book’s Greg Johnson, Cherry Growers reported that this year’s crop is expected to surpass last year’s output.
“This year’s Northwest cherry crop is projected to reach 22.4 million 20-pound cartons, according to Northwest Cherry Growers, which would be up 17 percent over last year’s 19.8 million cartons.”
Prices are hovering around $35/case, which is middle-of-the-range over the past 10 years. Growers rise to the occasion during this short season, employing innovative strategies to battle the heat and maintain a quality supply.
Except for 2016, cherry prices tend to remain relatively flat during the Washington season.
Iceberg ahead! After a brief uptick, prices lower again. Iceberg spent much of the year hovering near the price floor, that was until a heat wave lit a fire under frigid prices. As demand for iceberg wanes and supply improves it seems price winter may be on the horizon again.
Grape markets vary as fields transition. Coachella and Mexican grape growers are wrapping up their season while Central Californian growers are beginning to harvest.
Prices are down 23 percent, but stay vigilant, grape markets, notoriously explosive, are primed for even more volatility as growers navigate an urgently dry and hot summer.
Aggravated by rain, heat and seasonal movement dry onion prices are gradually rising. Red and white onions are increasing, more so than yellow.
The ProduceIQ Onion index is up 17 percent over the previous week, which is a significant move for a stable commodity.
The ProduceIQ Index is the fresh produce industry’s only shipping point price index. It represents the industry-wide price per pound at the location of packing for domestic produce, and at the port of U.S. entry for imported produce.
ProduceIQ uses 40 top commodities to represent the industry. The Index weights each commodity dynamically, by season, as a function of the weekly 5-year rolling average Sales. Sales are calculated using the USDA’s Agricultural Marketing Service for movement and price data. The Index serves as a fair benchmark for industry price performance.
The West Coast is bracing for yet another heat wave this weekend. Embattled growers are developing creative solutions and seeking government aid to address heat related issues with summer crops.
A record 4.1 million acres burned last year, reducing the available fuel in some areas. Otherwise, fire season in California has ideal conditions to begin earlier and be more intense.
ProduceIQ Index: $1.01 /pound, -5.6 percent over prior week Week #27 ending July 9th
Blue Book has teamed with ProduceIQ BB #:368175 to bring the ProduceIQ Index to its readers. The index provides a produce industry price benchmark using 40 top commodities to provide data for decision making.
Though prices have been falling for two weeks, honeydew remains at its second highest price in the last ten years. Markets are in flux as growing fields transition and excessive heat dries out the drought sensitive commodity.
Harvesting crews should be commended for valiantly picking during very challenging conditions.
Honeydews transition to San Joaquin valley from Arizona and Southern California. The Mexican growing season is closed. Markets are reliant on the heat-exposed Central Valley growing region to meet demand.
Prices are down, but a slight shift in circumstances (like forecasted temperatures of 113 degrees Fahrenheit in The Central Valley) could quickly send prices in the opposite direction.
Honeydew movement by region for a typical year, 2019, is shown.
Honeydew prices, compared to many produce commodities, aren’t highly volatile. 2020 is higher priced than most years.
Northwest blueberry growers are reporting severe losses in yields due to the record-breaking heat wave. North Carolina, New Jersey, Michigan and Canada also have blueberries in limited supplies. Expect shortages throughout July and look for supply relief in August.
Cherry growers are facing the same unprecedented temperatures scorching the NW growing region.
Despite the unique challenges heat brings to growing cherries, in an interview with Blue Book’s Greg Johnson, Cherry Growers reported that this year’s crop is expected to surpass last year’s output.
“This year’s Northwest cherry crop is projected to reach 22.4 million 20-pound cartons, according to Northwest Cherry Growers, which would be up 17 percent over last year’s 19.8 million cartons.”
Prices are hovering around $35/case, which is middle-of-the-range over the past 10 years. Growers rise to the occasion during this short season, employing innovative strategies to battle the heat and maintain a quality supply.
Except for 2016, cherry prices tend to remain relatively flat during the Washington season.
Iceberg ahead! After a brief uptick, prices lower again. Iceberg spent much of the year hovering near the price floor, that was until a heat wave lit a fire under frigid prices. As demand for iceberg wanes and supply improves it seems price winter may be on the horizon again.
Grape markets vary as fields transition. Coachella and Mexican grape growers are wrapping up their season while Central Californian growers are beginning to harvest.
Prices are down 23 percent, but stay vigilant, grape markets, notoriously explosive, are primed for even more volatility as growers navigate an urgently dry and hot summer.
Aggravated by rain, heat and seasonal movement dry onion prices are gradually rising. Red and white onions are increasing, more so than yellow.
The ProduceIQ Onion index is up 17 percent over the previous week, which is a significant move for a stable commodity.
The ProduceIQ Index is the fresh produce industry’s only shipping point price index. It represents the industry-wide price per pound at the location of packing for domestic produce, and at the port of U.S. entry for imported produce.
ProduceIQ uses 40 top commodities to represent the industry. The Index weights each commodity dynamically, by season, as a function of the weekly 5-year rolling average Sales. Sales are calculated using the USDA’s Agricultural Marketing Service for movement and price data. The Index serves as a fair benchmark for industry price performance.
Mark Campbell was introduced to the fresh produce industry as a lender for Farm Credit. After earning his MBA from Columbia Business School, he spent seven years as CFO for J&J Family of Farms and later served as CFO advisor to several produce growers, shippers and distributors. In this role, Mark saw the impediments that prevent produce growers and buyers to trade with greater access and efficiency. This led him to cofound ProduceIQ.