While consumers typically held out on ordering fresh food online, it took a major leap forward during the pandemic.
The pandemic changed everything about groceries: what, how much and when people bought, but especially the where. While grocery e-commerce had been an area of growth for several years, online food and beverage sales exploded in 2020. IRI and 210 Analytics delved into the numbers, including fresh food e-commerce, to understand what drove growth and if we’re in store for further gains in 2021.
Food and beverage e-commerce
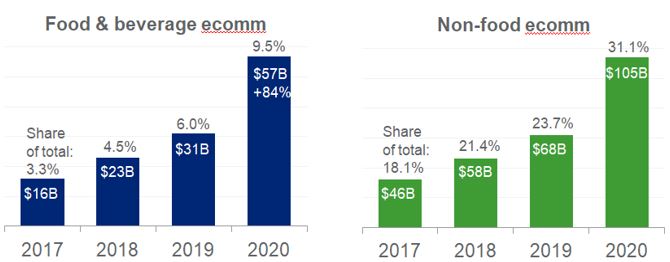
Grocery e-commerce has been an area of growth for many years. In 2017, the online portion of total food and beverage sales was a mere 3.3%. Come 2019 that had grown to 6.0% or $31 billion. The pandemic prompted not only further growth of e-commerce, but a rapid acceleration. By the end of 2020, e-commerce made up 9.5% of all food and beverage sales in the U.S., reflecting annual growth of 84%, according to IRI.
Note: Based on 205 CPG categories currently tracked in e-commerce. Estimated 2020 e-commerce share for all CPG categories is 7.8% for edible and 22.3% for nonedible, accounting for $175B total CPG ecommerce sales. E-commerce data is based on projected receipt-based sample and reported data with varying levels of granularity and accuracy available. 1. eMarketer U.S. Retail e-commerce Sales Share, by Product Category: % of Total Retail Sales. Source: IRI Omnichannel, data ending 2/28/21. IRI Strategic Analytics forecasts.
Even so, online food and beverage sales trail non-food by a wide margin. Non-food CPG ecommerce reached $105 billion in 2020, now reflecting 31% of all dollars sold. Other areas within retail saw even greater shifts. For instance, electronics now have a 50% e-commerce share, office supplies a 40% share and 38% of all apparel dollars are generated online. This signals both an important gap and growth opportunity for food and beverage e-commerce.
E-commerce engagement
The $26 billion increase in U.S. e-commerce sales was based on more people buying online, existing customers buying more each trip and people buying food and beverages online more frequently — the trifecta of growth. In 2019, 47% of consumers had purchased groceries online. In 2020, that share rose to 64%, according to research by 210 Analytics. For some, this was limited to one or two attempts perhaps during quarantine or incentivized by a retailer cash back offer.
Source: IRI eMarket Insights, Total Ecommerce by Fulfillment Type
However, many shoppers have increased their order frequency over the past year. The share ordering online weekly rose from 5% in 2019 to 11% in 2020. Likewise, the share ordering every two weeks increased from 4% to 9%. IRI found that among new online shoppers as of the start of the pandemic in March 2020, 50% continue to buy online and about 20% have become heavy hitters. The latter have ordered online at least 10 times already and are spending significant amounts online. The online basket averages $74 versus $55 for the average in-store ring. Online shoppers are less price-sensitive and spend an average of 13% more per unit online versus offline for fresh foods. The difference is highest for deli items where the average price per unit is 42% higher online than offline.
E-commerce fulfillment types
As more retailers dialed up click-and-collect or delivery, ordering through the website of local brick-and-mortar retailers is by far the most popular way to buy food and beverages online. In 2020, 69% of all CPG dollars came by means of a website of a brick-and-mortar retailer. The second-largest share was generated by third-party delivery companies, such as Instacart, at 26% and the remaining 5% came from online-only food and beverage companies. The share generated through the online presence of brick-and-mortar retailers is not only the largest but also increasing. When looking at the same three-way split during just the month of December, 73% of dollars came from the online presence of brick-and-mortar retailers versus just 2% from pure online players.
Source: IRI Consumer Network™, Total U.S. – Internet 4 WE Feb 23,2020- 4 WE Dec 27,2020.
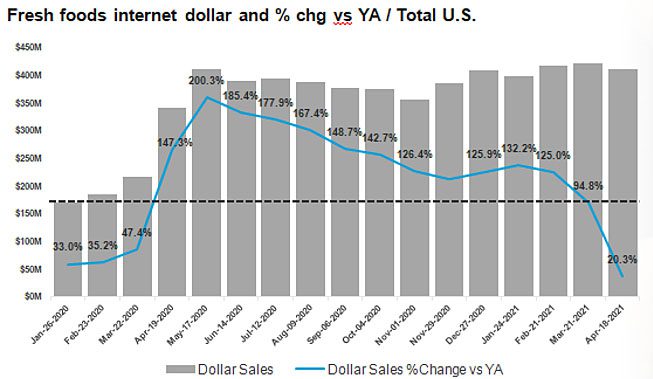
Subsequently, click-and-collect — where the order is placed online, but the shopper picks up the order at the store — is growing the fastest. Another consequence is a changing basket mix. Due to click-and-collect and the acceleration of e-commerce during the pandemic, the online basket now includes more perishable items, such as meat and produce, with fulfillment by the trusted retailer. Fresh food e-commerce, that had lagged center-store and frozen, grew as much as 200% during the early months of the pandemic. While growth rates are starting to lap those 2020 growth spikes, the absolute dollars in fresh e-commerce are holding a little over $400 million in a four-week period, according to IRI.
Brand, or basket, loyalty
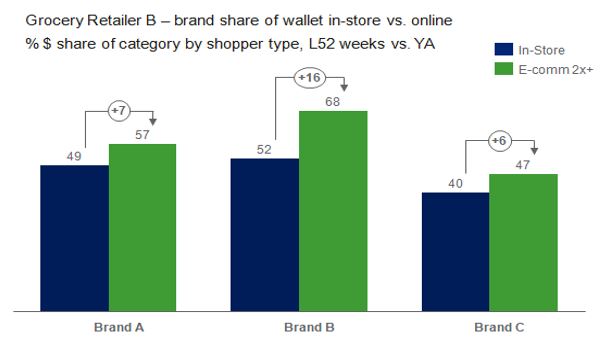
More than four in five online consumers (82%) start with their past purchases when placing an online order, according to research by 210 Analytics. The longer someone has ordered online, the more likely they are to start with their favorites. After all, more frequent online orders means a greater level of curation in their past order history. But this also has great consequences as it is resulting in great brand, or perhaps more accurately put, basket loyalty. IRI studied a variety of brands and their share of wallet in store versus online. For each, the online loyalty was significantly higher. This means winning from the first click is crucially important as is having a strategy to create visibility for new items, seasonal offerings and flavor extensions.
IRi Liquid Panel Data, Latest 52 Weeks Ending 4/18/2021.
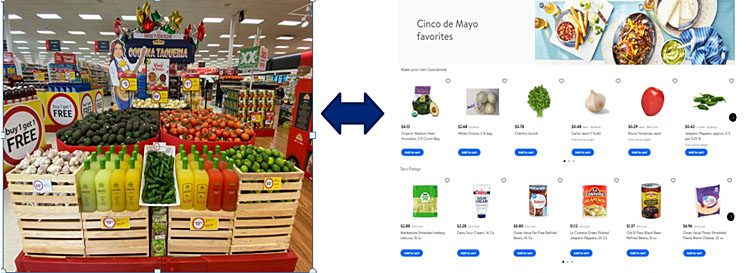
The same goes for impulse items. IRI found that items such as carbonated beverages, salty snacks and energy drinks significantly under index versus their in-store share. There are many fresh categories that benefit from impulse purchases, such as fruit, floral and baked goods, and driving impulse online in the same vein as inspiring unplanned purchases in-store will be crucial to maintain spending. Brand and retailers have room to close the lost impulse opportunity that IRI places between 0.5% and 1% of omnichannel food and beverage sales by partnering on building baskets to further push underdeveloped impulse categories online. The food industry also has a big opportunity to cross-merchandise online, much like is done in store for holidays such as Cinco de Mayo, Mother’s Day or everyday occasions.
The who
210 Analytics’ research shows that the core online grocery shopper are the older Millennials and younger Gen X-ers – shoppers right around age 40 who tend to be in their family-rearing and career-building years. Grocery e-commerce is best developed in urban areas in cities along the two coasts and is clustered among high-income households. That part is unchanged from pre-pandemic.
However, online shopping over the past year narrowed a lot of the demographic gaps, even though they still exist. Driven by concerns over the safety of shopping in store, older demographics started buying groceries online. Likewise, very young shoppers did too, right along with their online restaurant orders. Lower-income households started buying online, in part driven by many more states rapidly starting to accept SNAP (food stamp) dollars online. And shoppers in rural and small town communities also increasingly buy groceries online as local chains expanded their e-commerce capabilities.
With all the demographic changes, the items purchased online are changing too. Small and extra small brands hold a disproportionately large share of dollars in online baskets. While they only account for 14% (small brands) and 8% (very small brands) in IRI’s multi-outlet offline channels, they account for 27%, each in total ecommerce sales. Home shipment is a prime area for opportunity for niche brands. Additionally, the early adopters of grocery e-commerce had a high propensity for health and wellbeing, driving an above-average share of organic, grass-fed and other items consumers associate with health. And at the same time, their focus on saving time spurred above-average shares of convenience-focused items, such as value-added meat and produce. As a result of all of these buying tendencies, branded item sales in the fresh categories is higher online than offline, at +2% for fresh foods overall. The biggest difference is meat, where brands are 22% more likely to be in online versus offline baskets, followed by baked goods, at 16%.
Some crystal ball
While online grocery shopping isn’t for everyone, 79% of those currently doing curbside pick-up and 73% of those who order groceries for delivery expect they will continue to do so the same amount or even more often post-pandemic. This means some shifting back from online trips to in-store, which is precisely what the market has been experiencing in the past few months. But even so, 19% of all trips are still online — vastly higher than pre-pandemic. IRI is expecting continued e-commerce growth, albeit at a bit of a milder pace. IRI anticipates the share of online food and beverage dollars to reach 12% by the end of 2021, up from 9.5% in 2020.
Implications
Continue to invest with speed in digital capabilities to gain omnichannel share.
Strategize how to highlight new or seasonal items, especially ones with an impulse nature, to optimize the share in online baskets.
Consider tweaking promotional strategies to drive variety of purchase in addition to buying convenience and value. Leverage online as a way to test consumer taste.
Track and optimize digital marketing and trade/shopper spend. Inroads made by small manufacturers are a call-to-action for larger players. Likewise, online success signals an opportunity for successful distribution in-store for some of the small and very small players.
Food and beverage e-commerce is not just center-store and frozen any more. Fresh is gearing up fast and translating visual departments, such produce, and service-focused departments, such as meat, bakery and deli, to an online world is important.
Optimize the omni-channel supply chain to reduce shipping and warehouse costs.
Use targeted offers for products, solutions and services.
Build online experiences to encourage discovery, impulse and occasion-based purchases.
The pandemic changed everything about groceries: what, how much and when people bought, but especially the where. While grocery e-commerce had been an area of growth for several years, online food and beverage sales exploded in 2020. IRI and 210 Analytics delved into the numbers, including fresh food e-commerce, to understand what drove growth and if we’re in store for further gains in 2021.
Food and beverage e-commerce
Grocery e-commerce has been an area of growth for many years. In 2017, the online portion of total food and beverage sales was a mere 3.3%. Come 2019 that had grown to 6.0% or $31 billion. The pandemic prompted not only further growth of e-commerce, but a rapid acceleration. By the end of 2020, e-commerce made up 9.5% of all food and beverage sales in the U.S., reflecting annual growth of 84%, according to IRI.
Note: Based on 205 CPG categories currently tracked in e-commerce. Estimated 2020 e-commerce share for all CPG categories is 7.8% for edible and 22.3% for nonedible, accounting for $175B total CPG ecommerce sales. E-commerce data is based on projected receipt-based sample and reported data with varying levels of granularity and accuracy available. 1. eMarketer U.S. Retail e-commerce Sales Share, by Product Category: % of Total Retail Sales. Source: IRI Omnichannel, data ending 2/28/21. IRI Strategic Analytics forecasts.
Even so, online food and beverage sales trail non-food by a wide margin. Non-food CPG ecommerce reached $105 billion in 2020, now reflecting 31% of all dollars sold. Other areas within retail saw even greater shifts. For instance, electronics now have a 50% e-commerce share, office supplies a 40% share and 38% of all apparel dollars are generated online. This signals both an important gap and growth opportunity for food and beverage e-commerce.
E-commerce engagement
The $26 billion increase in U.S. e-commerce sales was based on more people buying online, existing customers buying more each trip and people buying food and beverages online more frequently — the trifecta of growth. In 2019, 47% of consumers had purchased groceries online. In 2020, that share rose to 64%, according to research by 210 Analytics. For some, this was limited to one or two attempts perhaps during quarantine or incentivized by a retailer cash back offer.
Source: IRI eMarket Insights, Total Ecommerce by Fulfillment Type
However, many shoppers have increased their order frequency over the past year. The share ordering online weekly rose from 5% in 2019 to 11% in 2020. Likewise, the share ordering every two weeks increased from 4% to 9%. IRI found that among new online shoppers as of the start of the pandemic in March 2020, 50% continue to buy online and about 20% have become heavy hitters. The latter have ordered online at least 10 times already and are spending significant amounts online. The online basket averages $74 versus $55 for the average in-store ring. Online shoppers are less price-sensitive and spend an average of 13% more per unit online versus offline for fresh foods. The difference is highest for deli items where the average price per unit is 42% higher online than offline.
E-commerce fulfillment types
As more retailers dialed up click-and-collect or delivery, ordering through the website of local brick-and-mortar retailers is by far the most popular way to buy food and beverages online. In 2020, 69% of all CPG dollars came by means of a website of a brick-and-mortar retailer. The second-largest share was generated by third-party delivery companies, such as Instacart, at 26% and the remaining 5% came from online-only food and beverage companies. The share generated through the online presence of brick-and-mortar retailers is not only the largest but also increasing. When looking at the same three-way split during just the month of December, 73% of dollars came from the online presence of brick-and-mortar retailers versus just 2% from pure online players.
Source: IRI Consumer Network™, Total U.S. – Internet 4 WE Feb 23,2020- 4 WE Dec 27,2020.
Subsequently, click-and-collect — where the order is placed online, but the shopper picks up the order at the store — is growing the fastest. Another consequence is a changing basket mix. Due to click-and-collect and the acceleration of e-commerce during the pandemic, the online basket now includes more perishable items, such as meat and produce, with fulfillment by the trusted retailer. Fresh food e-commerce, that had lagged center-store and frozen, grew as much as 200% during the early months of the pandemic. While growth rates are starting to lap those 2020 growth spikes, the absolute dollars in fresh e-commerce are holding a little over $400 million in a four-week period, according to IRI.
Brand, or basket, loyalty
More than four in five online consumers (82%) start with their past purchases when placing an online order, according to research by 210 Analytics. The longer someone has ordered online, the more likely they are to start with their favorites. After all, more frequent online orders means a greater level of curation in their past order history. But this also has great consequences as it is resulting in great brand, or perhaps more accurately put, basket loyalty. IRI studied a variety of brands and their share of wallet in store versus online. For each, the online loyalty was significantly higher. This means winning from the first click is crucially important as is having a strategy to create visibility for new items, seasonal offerings and flavor extensions.
IRi Liquid Panel Data, Latest 52 Weeks Ending 4/18/2021.
The same goes for impulse items. IRI found that items such as carbonated beverages, salty snacks and energy drinks significantly under index versus their in-store share. There are many fresh categories that benefit from impulse purchases, such as fruit, floral and baked goods, and driving impulse online in the same vein as inspiring unplanned purchases in-store will be crucial to maintain spending. Brand and retailers have room to close the lost impulse opportunity that IRI places between 0.5% and 1% of omnichannel food and beverage sales by partnering on building baskets to further push underdeveloped impulse categories online. The food industry also has a big opportunity to cross-merchandise online, much like is done in store for holidays such as Cinco de Mayo, Mother’s Day or everyday occasions.
The who
210 Analytics’ research shows that the core online grocery shopper are the older Millennials and younger Gen X-ers – shoppers right around age 40 who tend to be in their family-rearing and career-building years. Grocery e-commerce is best developed in urban areas in cities along the two coasts and is clustered among high-income households. That part is unchanged from pre-pandemic.
However, online shopping over the past year narrowed a lot of the demographic gaps, even though they still exist. Driven by concerns over the safety of shopping in store, older demographics started buying groceries online. Likewise, very young shoppers did too, right along with their online restaurant orders. Lower-income households started buying online, in part driven by many more states rapidly starting to accept SNAP (food stamp) dollars online. And shoppers in rural and small town communities also increasingly buy groceries online as local chains expanded their e-commerce capabilities.
With all the demographic changes, the items purchased online are changing too. Small and extra small brands hold a disproportionately large share of dollars in online baskets. While they only account for 14% (small brands) and 8% (very small brands) in IRI’s multi-outlet offline channels, they account for 27%, each in total ecommerce sales. Home shipment is a prime area for opportunity for niche brands. Additionally, the early adopters of grocery e-commerce had a high propensity for health and wellbeing, driving an above-average share of organic, grass-fed and other items consumers associate with health. And at the same time, their focus on saving time spurred above-average shares of convenience-focused items, such as value-added meat and produce. As a result of all of these buying tendencies, branded item sales in the fresh categories is higher online than offline, at +2% for fresh foods overall. The biggest difference is meat, where brands are 22% more likely to be in online versus offline baskets, followed by baked goods, at 16%.
Some crystal ball
While online grocery shopping isn’t for everyone, 79% of those currently doing curbside pick-up and 73% of those who order groceries for delivery expect they will continue to do so the same amount or even more often post-pandemic. This means some shifting back from online trips to in-store, which is precisely what the market has been experiencing in the past few months. But even so, 19% of all trips are still online — vastly higher than pre-pandemic. IRI is expecting continued e-commerce growth, albeit at a bit of a milder pace. IRI anticipates the share of online food and beverage dollars to reach 12% by the end of 2021, up from 9.5% in 2020.
Implications
Continue to invest with speed in digital capabilities to gain omnichannel share.
Strategize how to highlight new or seasonal items, especially ones with an impulse nature, to optimize the share in online baskets.
Consider tweaking promotional strategies to drive variety of purchase in addition to buying convenience and value. Leverage online as a way to test consumer taste.
Track and optimize digital marketing and trade/shopper spend. Inroads made by small manufacturers are a call-to-action for larger players. Likewise, online success signals an opportunity for successful distribution in-store for some of the small and very small players.
Food and beverage e-commerce is not just center-store and frozen any more. Fresh is gearing up fast and translating visual departments, such produce, and service-focused departments, such as meat, bakery and deli, to an online world is important.
Optimize the omni-channel supply chain to reduce shipping and warehouse costs.
Use targeted offers for products, solutions and services.
Build online experiences to encourage discovery, impulse and occasion-based purchases.
Anne-Marie Roerink is the President of 210 Analytics.