The pandemic in 2020 disrupted retail and foodservice demand for lettuce, and that will affect plantings in 2021.
A look at volume and pricing over the past several years shows a similar winter pattern.
Blue Book has teamed with Agtools Inc., BB #:355102 the data analytic service for the produce industry, to look how a fruit or vegetable fared in 2020 and what it should expect next year.
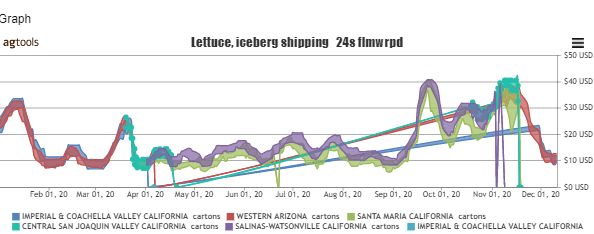
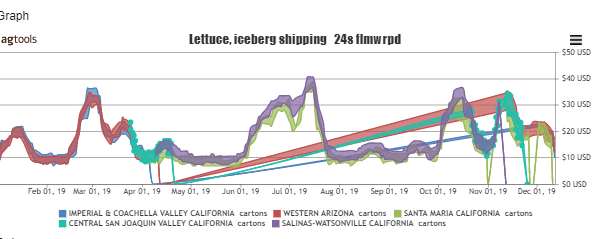
By looking at three graphs below, shipping prices in 2019 and 2020 are $10-40.
In 2019 there was a mid-year surge in shipping prices from June to August, but this spike disappeared in 2020. We can see that towards the end of the year from September to December shipping prices for all regions increase. It is fair to project that for 2021 first quarter prices will increase at the end of February and continue in March and April.
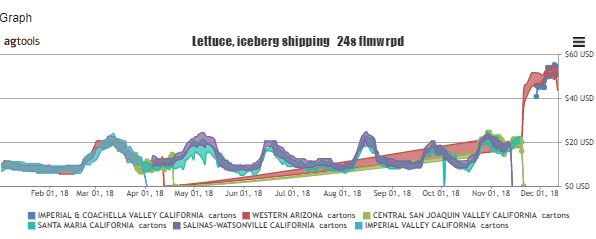
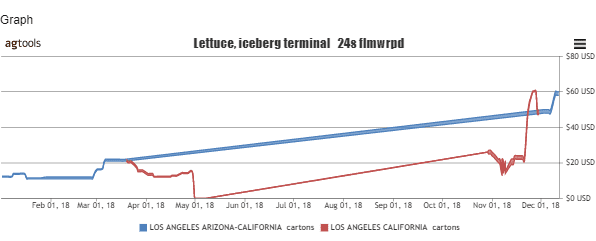
Lettuce Iceberg shipping FOB Prices 24 film wrapped January through December 12th, 2018-2020, 3 Graph comparison.
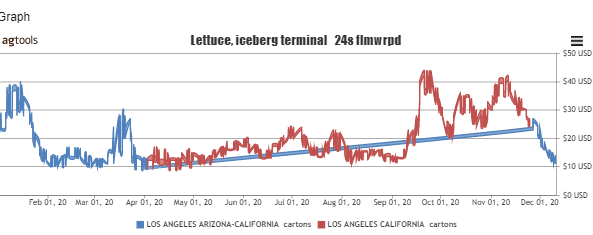
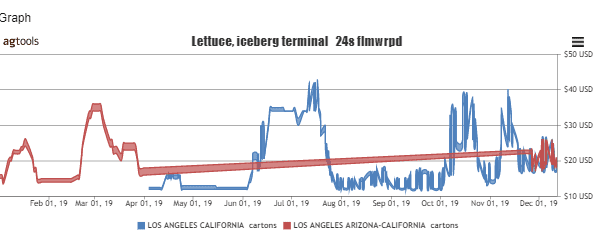
We can see from the graphs below that terminal prices have ranged greatly between $10 and $45 in 2019 and 2020. We see 2018 had a top price of $60 at the end of year.
It is fair to project that for the first quarter of 2021 prices will start high in January and decrease in February followed by a slight increase in March and April.
Lettuce Iceberg Los Angles Terminal Price 24 wrapped January 1st through December 12th Origin California and Arizona
Look at the Graphs below and we can see that California-Central Region is the leader, and it is gaining in market share from 60 percent in 2019 to 64 percent in 2020. Note that Arizona has taken second place but has decreased its production significantly. Mexico is steady in 3rd place.
Lettuce Iceberg Volume from January 1st through December 12th, 2020 vs 2019
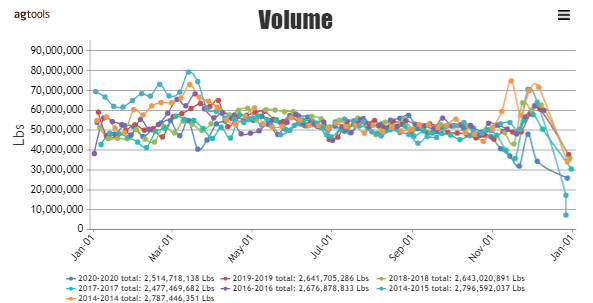
Lettuce Iceberg 7-year volume comparison January 1st to December 12th, 2014-2020
In the graph above we can observe the iceberg lettuce volume comparison in for the last 7 years 2014-2020 for the periods of January 1st to December 12th. It is interesting to observe in the graph above that total volume for the last three years has gradually decreased from 2018 to 2020.
In 2014 and 2015 the highest years in terms of volume with 2.787 billion pounds and 2.796 billion pounds respectively.
The pandemic in 2020 disrupted retail and foodservice demand for lettuce, and that will affect plantings in 2021.
A look at volume and pricing over the past several years shows a similar winter pattern.
Blue Book has teamed with Agtools Inc., BB #:355102 the data analytic service for the produce industry, to look how a fruit or vegetable fared in 2020 and what it should expect next year.
By looking at three graphs below, shipping prices in 2019 and 2020 are $10-40.
In 2019 there was a mid-year surge in shipping prices from June to August, but this spike disappeared in 2020. We can see that towards the end of the year from September to December shipping prices for all regions increase. It is fair to project that for 2021 first quarter prices will increase at the end of February and continue in March and April.
Lettuce Iceberg shipping FOB Prices 24 film wrapped January through December 12th, 2018-2020, 3 Graph comparison.
We can see from the graphs below that terminal prices have ranged greatly between $10 and $45 in 2019 and 2020. We see 2018 had a top price of $60 at the end of year.
It is fair to project that for the first quarter of 2021 prices will start high in January and decrease in February followed by a slight increase in March and April.
Lettuce Iceberg Los Angles Terminal Price 24 wrapped January 1st through December 12th Origin California and Arizona
Look at the Graphs below and we can see that California-Central Region is the leader, and it is gaining in market share from 60 percent in 2019 to 64 percent in 2020. Note that Arizona has taken second place but has decreased its production significantly. Mexico is steady in 3rd place.
Lettuce Iceberg Volume from January 1st through December 12th, 2020 vs 2019
Lettuce Iceberg 7-year volume comparison January 1st to December 12th, 2014-2020
In the graph above we can observe the iceberg lettuce volume comparison in for the last 7 years 2014-2020 for the periods of January 1st to December 12th. It is interesting to observe in the graph above that total volume for the last three years has gradually decreased from 2018 to 2020.
In 2014 and 2015 the highest years in terms of volume with 2.787 billion pounds and 2.796 billion pounds respectively.
David Wilson is executive vice president sales shippers Agtools. He has 20 years’ experience in the produce industry with all commodities and regions.