Brussels sprouts’ volume is up significantly from last year, but prices have shown no weakness.
F.O.B.s have been higher than last year since the start of summer, showing retail demand remains strong for this vegetable, as with many others.
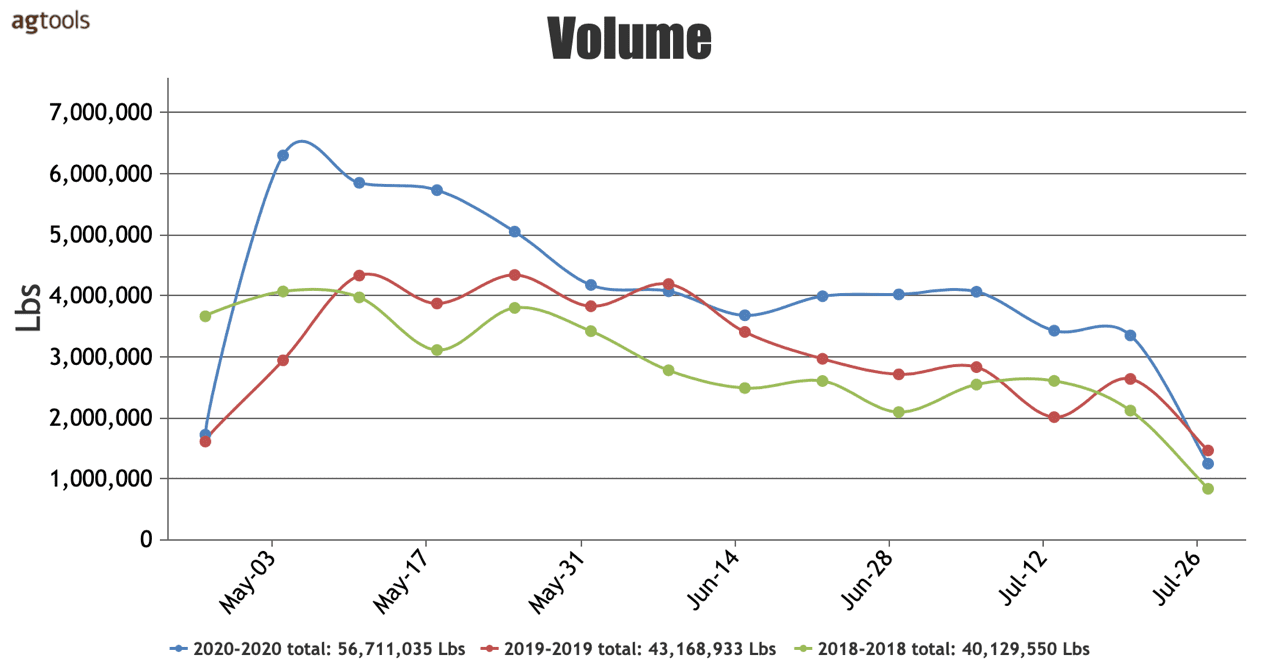
VOLUME TOTAL, BRUSSELS SPROUTS CONVENTIONAL FROM MAY 1ST THROUGH JULY 31TH
A comparison of 2020 volume with previous years, for the period between May to July 31, 2020, shows an increase of 31 percent over 2019 and an increase of 41 percent over 2018.
We can see that this is a product whose demand trend is upward, and this increase has occurred year over year in the last seven years, said Paola Ochoa, Program Manager of Agtools Inc. BB #:355102
Blue Book has teamed with Agtools Inc., the data analytic service for the produce industry, to look at a handful of crops and how they’re adjusting in the market during the pandemic.
Together, Mexico and California Central account for 91 percent of the U.S. consumption of Brussels sprouts, with Mexico the largest producer with 72 percent of total US volume.
The regions of California South, California Imperial Valley and Belgium are consistently the next group of producers into the U.S. in terms of volume. These five supplying regions are responsible for almost the entire U.S. volume.
F.O.B. PRICE IN SOUTH & CENTRAL CALIFORNIA AND MEXICO CROSSINGS THROUGH SOUTHERN CALIFORNIA AND SAN LUIS, ARIZONA BRUSSELS SPROUTS CONVENTIONAL SIZE MEDIUM FROM JUNE 1ST THROUGH JULY 31TH
Since the middle of June F.O.B. prices have been above those of 2019 and have followed a pattern very similar to those of 2018, Ochoa said. However, F.O.B. prices during 2019 had an almost inverse pattern when compared to 2018 and 2020.
NEW YORK TERMINAL PRICE FOR CONVENTIONAL MEXICAN BRUSSELS SPROUTS SIZE LARGE FROM JUNE 1ST THROUGH JULY 26TH
Moving from F.O.B. pricing to analyzing terminal pricing, in particular New York, we encounter a similar pattern with the highest prices this year during July, even doubling the prices that were reached in 2019, she said.
However, when supplies rise considerably, as they have from 2019 to 2020 (31 percent), terminal prices may be expected to decrease.
Yet, that is not the case for this commodity in 2020. The increase in demand for this commodity correlates with higher prices and is a testament to the increasing presence of this vegetable in the American diet.
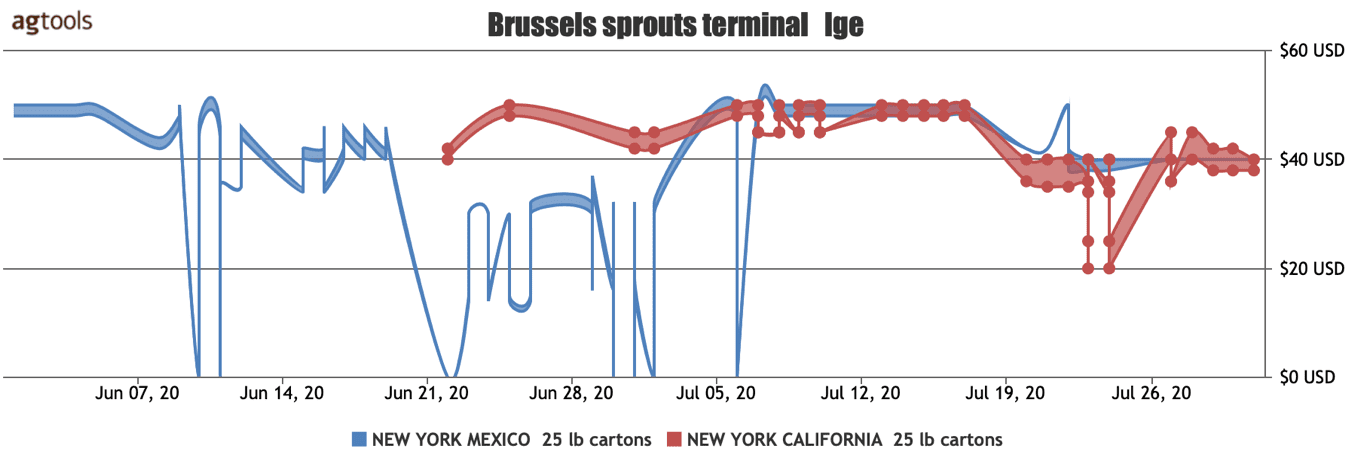
NEW YORK TERMINAL PRICE FOR CONVENTIONAL BRUSSELS SPROUTS SIZE LARGE FROM MEXICO VS CALIFORNIA JUNE 1ST THROUGH JULY 31TH
When comparing Brussels sprouts of Mexican and California origin in the New York market, we can see that, since the beginning of July, the price has been very similar, Ochoa said. This similarity isn’t always the case when comparing products from domestic and imported sources. For other commodities prices for domestic products tend to be higher than those of the imports.
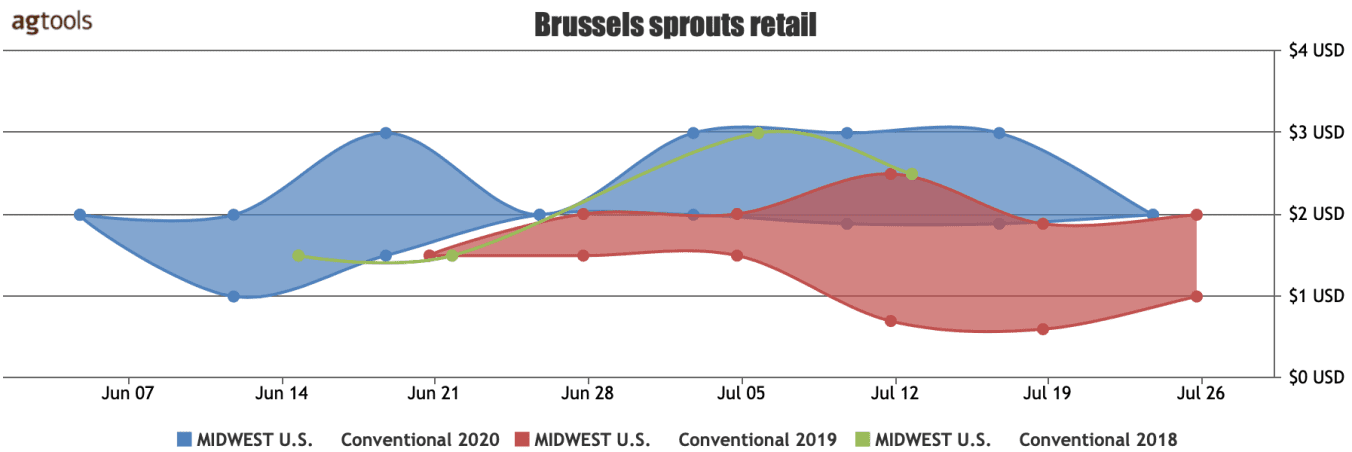
MIDWEST RETAIL PRICE FOR CONVENTIONAL LIMES FROM JUNE 1ST THROUGH JULY 31TH
When analyzing the retail price in the Midwest we can see a pattern similar to that found in F.O.B. prices and terminal prices. Retail prices for the last two months of 2020 have maintained levels above those of 2019. We will continue to observe the behavior of this product to further understand this commodity as we enter the second half of 2020, Ochoa said.
Brussels sprouts’ volume is up significantly from last year, but prices have shown no weakness.
F.O.B.s have been higher than last year since the start of summer, showing retail demand remains strong for this vegetable, as with many others.
VOLUME TOTAL, BRUSSELS SPROUTS CONVENTIONAL FROM MAY 1ST THROUGH JULY 31TH
A comparison of 2020 volume with previous years, for the period between May to July 31, 2020, shows an increase of 31 percent over 2019 and an increase of 41 percent over 2018.
We can see that this is a product whose demand trend is upward, and this increase has occurred year over year in the last seven years, said Paola Ochoa, Program Manager of Agtools Inc. BB #:355102
Blue Book has teamed with Agtools Inc., the data analytic service for the produce industry, to look at a handful of crops and how they’re adjusting in the market during the pandemic.
Together, Mexico and California Central account for 91 percent of the U.S. consumption of Brussels sprouts, with Mexico the largest producer with 72 percent of total US volume.
The regions of California South, California Imperial Valley and Belgium are consistently the next group of producers into the U.S. in terms of volume. These five supplying regions are responsible for almost the entire U.S. volume.
F.O.B. PRICE IN SOUTH & CENTRAL CALIFORNIA AND MEXICO CROSSINGS THROUGH SOUTHERN CALIFORNIA AND SAN LUIS, ARIZONA BRUSSELS SPROUTS CONVENTIONAL SIZE MEDIUM FROM JUNE 1ST THROUGH JULY 31TH
Since the middle of June F.O.B. prices have been above those of 2019 and have followed a pattern very similar to those of 2018, Ochoa said. However, F.O.B. prices during 2019 had an almost inverse pattern when compared to 2018 and 2020.
NEW YORK TERMINAL PRICE FOR CONVENTIONAL MEXICAN BRUSSELS SPROUTS SIZE LARGE FROM JUNE 1ST THROUGH JULY 26TH
Moving from F.O.B. pricing to analyzing terminal pricing, in particular New York, we encounter a similar pattern with the highest prices this year during July, even doubling the prices that were reached in 2019, she said.
However, when supplies rise considerably, as they have from 2019 to 2020 (31 percent), terminal prices may be expected to decrease.
Yet, that is not the case for this commodity in 2020. The increase in demand for this commodity correlates with higher prices and is a testament to the increasing presence of this vegetable in the American diet.
NEW YORK TERMINAL PRICE FOR CONVENTIONAL BRUSSELS SPROUTS SIZE LARGE FROM MEXICO VS CALIFORNIA JUNE 1ST THROUGH JULY 31TH
When comparing Brussels sprouts of Mexican and California origin in the New York market, we can see that, since the beginning of July, the price has been very similar, Ochoa said. This similarity isn’t always the case when comparing products from domestic and imported sources. For other commodities prices for domestic products tend to be higher than those of the imports.
MIDWEST RETAIL PRICE FOR CONVENTIONAL LIMES FROM JUNE 1ST THROUGH JULY 31TH
When analyzing the retail price in the Midwest we can see a pattern similar to that found in F.O.B. prices and terminal prices. Retail prices for the last two months of 2020 have maintained levels above those of 2019. We will continue to observe the behavior of this product to further understand this commodity as we enter the second half of 2020, Ochoa said.
Greg Johnson is Director of Media Development for Blue Book Services