

Grocery sales have trended above 2019 levels since the second week of March. Gains during non-holiday weeks had been experiencing some erosion in what seemed to be a slow march back to normal — only interrupted by big spikes during holiday weeks.
However, the mounting number of COVID-19 cases around the country is prompting many states to revert to stricter social distancing measures. In some cases, this includes closing in-restaurant dining altogether once more. In others, dine-in capacity restrictions have been sharpened. This resulted in retail food sales increasing 10.7% versus year ago during the second week of July, a point higher than the last non-holiday week in late June. 210 Analytics, IRI and PMA partnered to understand fresh produce sales at retail developments throughout the pandemic.
Elevated every day demand drove sales gains of 11.0% over year ago for fresh produce during the week ending July 12 — the highest in several weeks. Frozen and shelf-stable fruits and vegetables had higher percentage gains but off a smaller base, with particular strength for frozen, at +22.3%. Year-to-date, fresh produce sales are up 10.9% over the same time period in 2019. Frozen fruit and vegetables increased the most, up 27.9% year-to-date. This is in spite of limited assortment of frozen vegetables and fruit, down -6.2% in average items per store selling.

“We knew Independence Day was a tough bar to beat, so it was hard to say where everyday demand would land us in the non-holiday week,” said Joe Watson, VP of Membership and Engagement for the Produce Marketing Association (PMA). “I am pleased to see that everyday demand for fresh produce is strong, boosting sales gains back into double digits over year ago. But while the strong retail demand is a big plus for our industry, the reversal on opening in-restaurant dining is a devastating hit to foodservice produce sales. I am hopeful that the resilience and creativity of our industry during the early months of the pandemic will help optimize foodservice demand once more.”
Fresh Produce
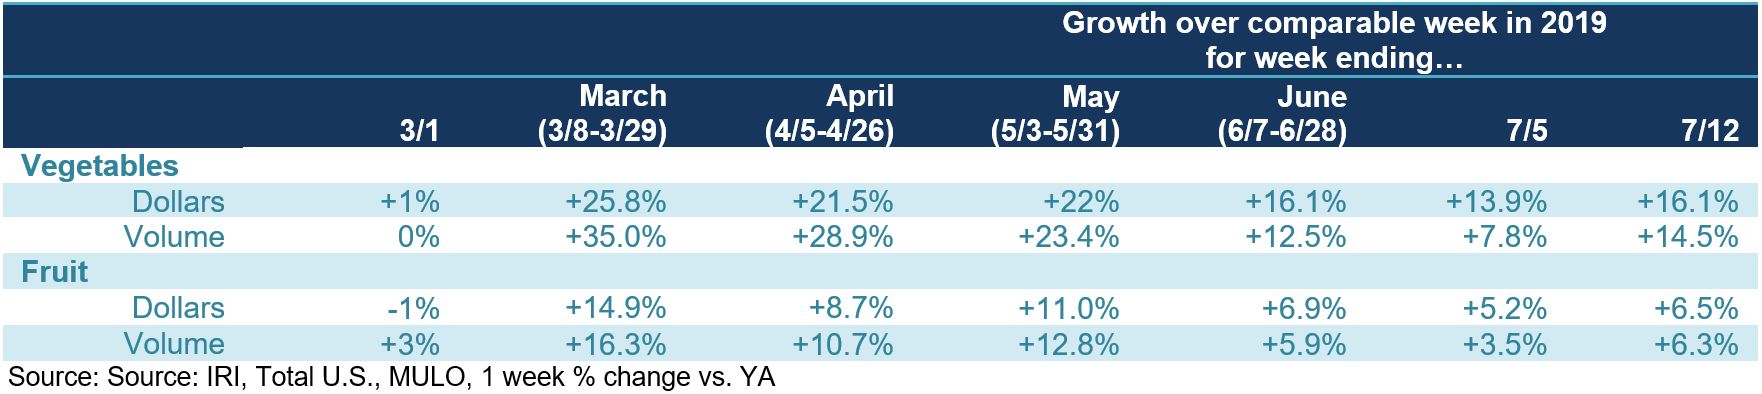
Fresh produce generated $1.39 billion in sales the week ending July 12 — an additional $138 million in fresh produce sales. Vegetables, up 16.1% from the prior year, had a 9.6 percentage point lead over fruit. Father’s Day excepted, fruit had its strongest week since mid June, at +6.5% over last year.

“The continued strength of vegetables is very telling,” said Jonna Parker, Team Lead, Fresh for IRI. “Fresh vegetables are supporting the continued at-home meal occasions that moved over from foodservice, particularly lunch and dinner. But at the same time, it is great to see that fruit had a strong week, and importantly, all sales measures were strong: dollars, volume and units. Unit purchases in fresh produce increased by 10.9% over the second week of July versus last year, while volume increased 9.5%. This to points to more, but smaller, packages sold during the non-holiday week as well. This affects pre-packaged produce and the types of promotions that will be effective in the current environment.”
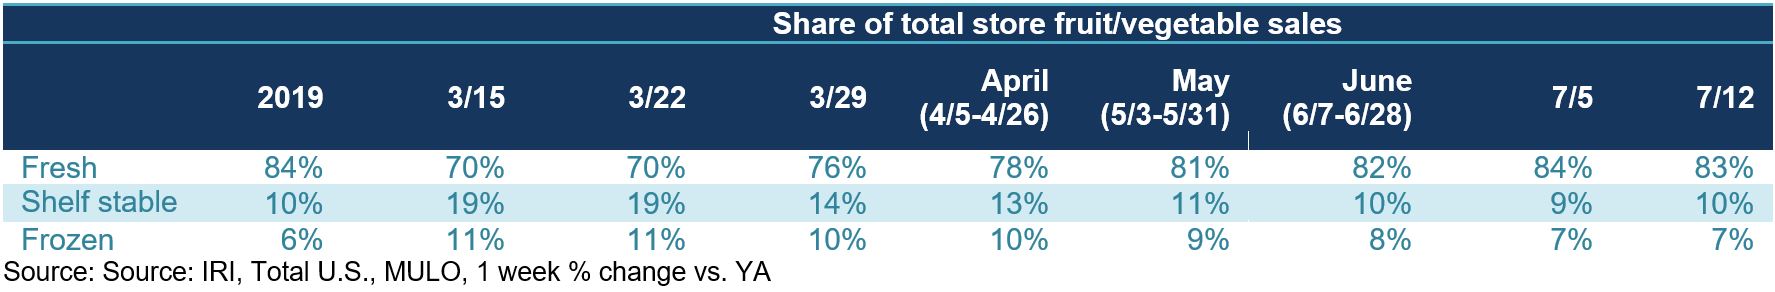
Fresh Share
Fresh produce had a big performance during Independence Day week, reaching its 2019 share of 84% for the first time since March. In the non-holiday week ending July 12, the share backslid slightly to 83%, with canned taking back a point. While percentage-wise, growth for fresh produce is outdone by frozen and canned, it is important to keep in mind the size of the markets. At $1.4 billion in sales during the week of July 12, fresh produce is significantly larger than shelf stable ($161 million) and frozen fruits and vegetables ($126 million). This means growth percentages for fresh produce are bound to be lower and not reflective of winners in absolute dollar gains or shares.
“Holding on to an 83% share of total produce dollars across the store is a great result,” said Watson. “Consumers have been mixing fresh with frozen and canned fruits and vegetables for years, but this behavior intensified during the stock-up weeks when shoppers wanted several weeks’ worth at home as a backup. Since the start of the pandemic we have been seeing consumers move to fresh items with longer shelf-life and educating consumers on how to pick items with different levels of ripeness and shelf life is a big opportunity to grow sales in weeks to come.”
Fresh Produce Dollars versus Volume
The volume/dollar gap narrowed significantly to just 1.5% — its lowest point in many weeks and much lower than many other areas around the store, particularly meat. Independence Day week, the gap was exactly 4 percentage points.
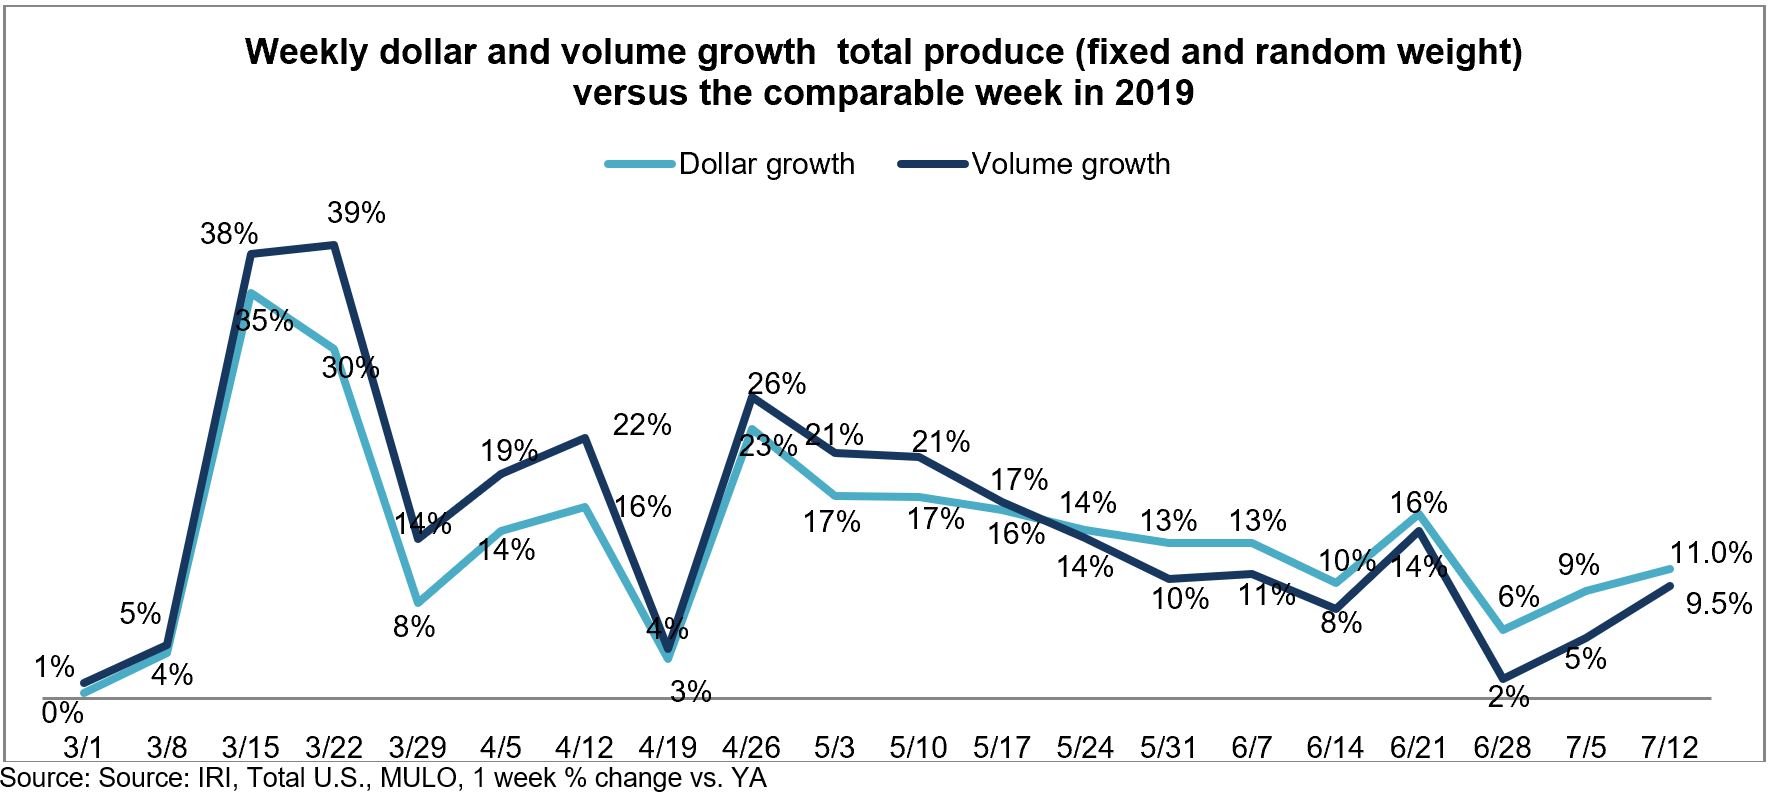
Both fruit and vegetables saw dollar sales gains track ahead of volume gains, but the gaps were minimal. Fruit volume gained 6.3% over the same week last year, just 0.2 percentage points behind the dollar growth. In vegetables, dollar gains also outpaced volume, at +16.1% versus +14.5%. The gap narrowed from 6.1 percentage points during Independence Day week to just 1.6 points the second week of July.
However, moving from total fruit and vegetables to the individual categories show that supply and demand is still significantly out of balance for many areas. Ample supply is driving higher volume than dollar gains for items such as avocados, peppers, celery, peaches and grapes. On the other hand, dollar gains are far outpacing volume for items such as cherries, corn, potatoes and greens.

Absolute Dollar Gains
Tomatoes contributed $15 million in new dollars the week of July 12 versus the comparable week in 2019. Lettuce and melons contributed $11 million, each. “It seems the top 10 contributors to absolute dollar gains change every single week,” said Watson. “You can see we are now fully in the summer cycle, with melons, corn and cherries all popping up in the top 10. This was the first week when mushrooms dropped just outside the top 10, despite a 24.2% increase in year-over-year sales, and oranges continue to deliver at nearly 50% versus last year.”

Fresh Fruit
“The first non-holiday week brought strong summer fruit sales,” said Parker. “Berries, melons and cherries make up the top three in total dollar sales. This is a great sign for the weeks to come. In other areas, such as peaches and avocados, consumer demand is certainly there but in a highly deflationary market, dollar sales trail volume sales by a wide margin.”
During the week of July 12, double-digit gains were reserved for melons, cherries and oranges, with the highest percentage growth yet again going to oranges, at +49.8%. Apples, grapes and avocados lost a little ground versus the same week in 2019, but all are affected by deflationary conditions and had volume increases even if dollars were down.

Fresh Vegetables
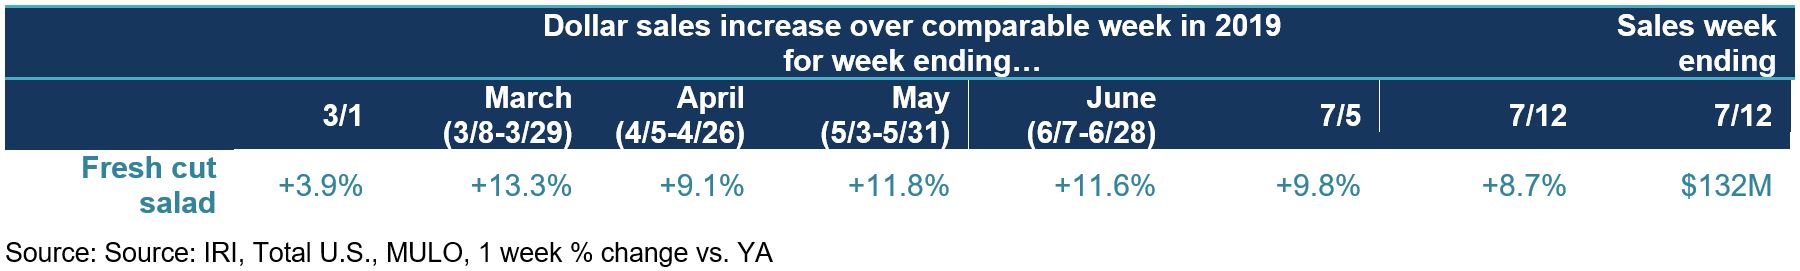
In contrast to fruit, all top 10 vegetables increased in dollar sales versus year ago and many did so with double-digit gains. Lettuce, which includes fresh cut salads, were the top sales category, followed by tomatoes and potatoes. The highest weekly gain percentage goes to corn, at +44.2%. Much of this increase was fueled by price increases, with volume up 17.9%.
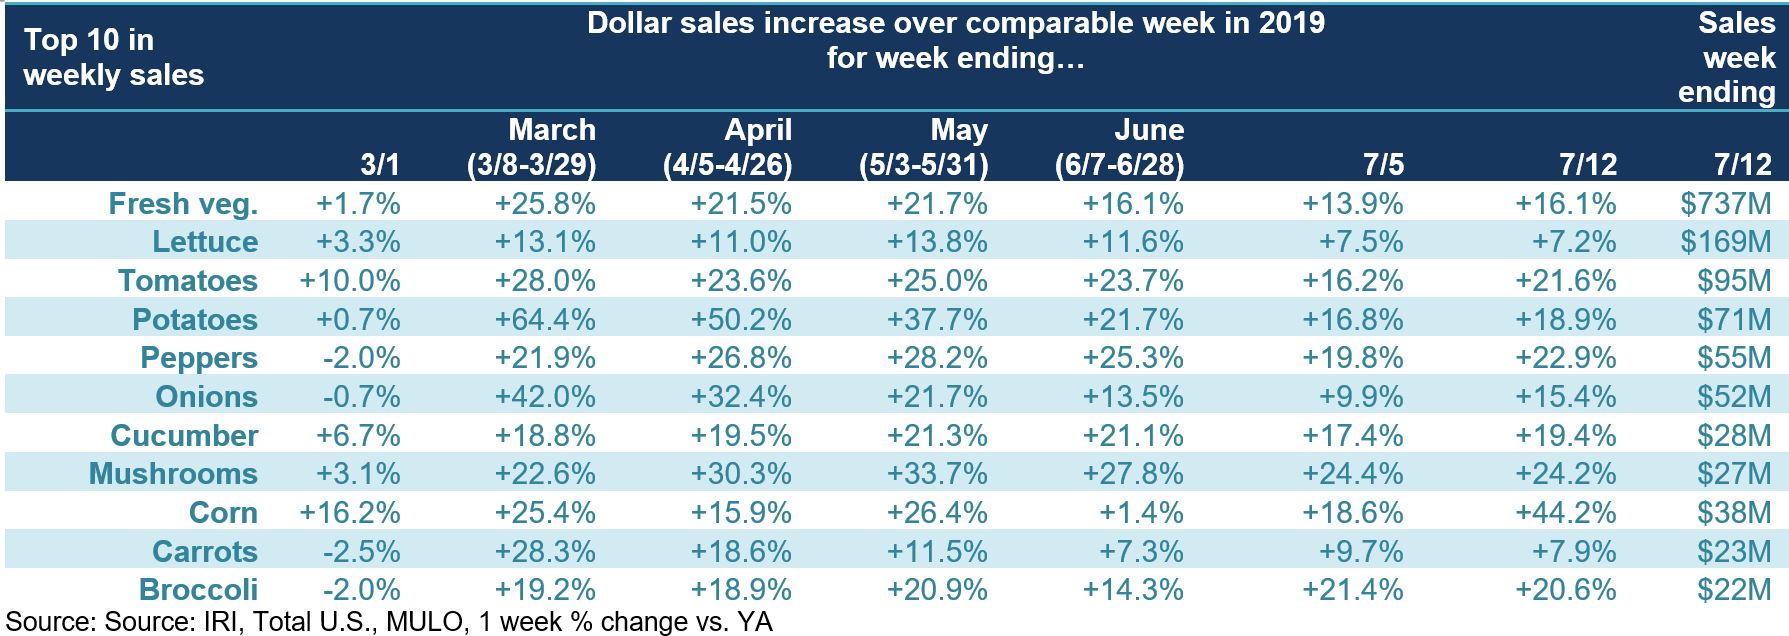
Fresh cut salad continued to be a strong performer over the week ending July 12, with a 8.7% increase in dollars and 4.5% increase in volume. This is one of the many examples across the store that consumers are still looking to mix and match items made from scratch with items that bring convenience and time saving.
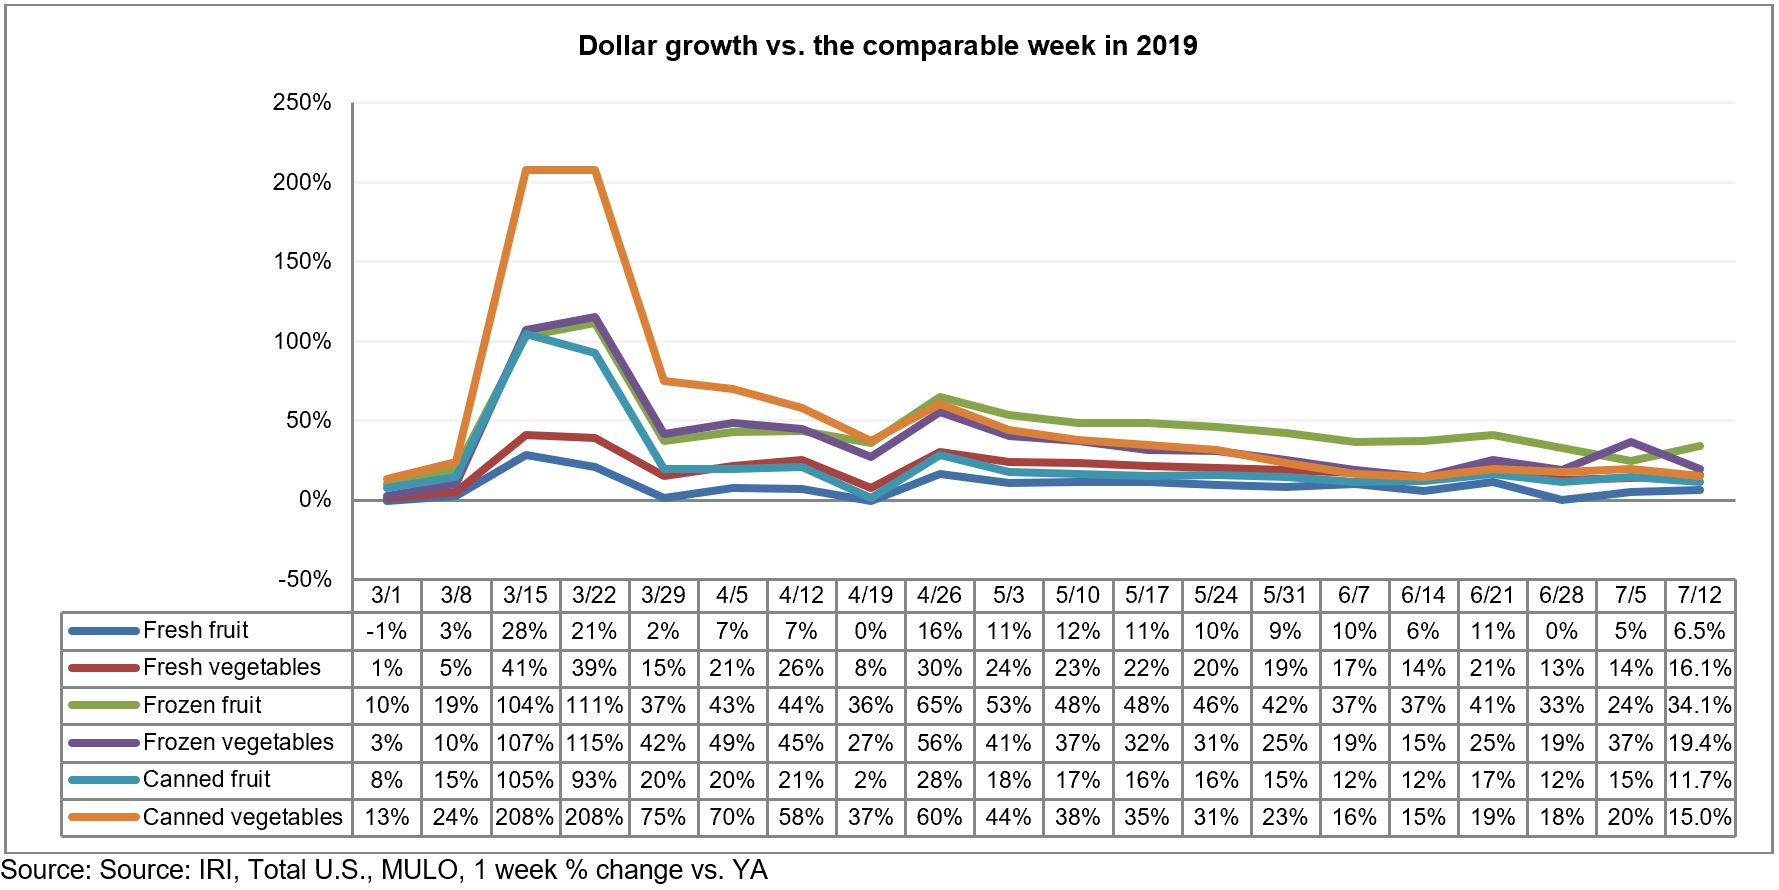
Fresh Versus Frozen and Shelf-Stable Fruits and Vegetables
All areas of fruit and vegetables had double-digit gains during the week of July 12, with the exception of fresh fruit. Frozen fruit had particularly high gains this week, at +34.1%. The continued strength of frozen fruits and vegetables is remarkable and goes hand-in-hand with strong frozen foods performance overall.
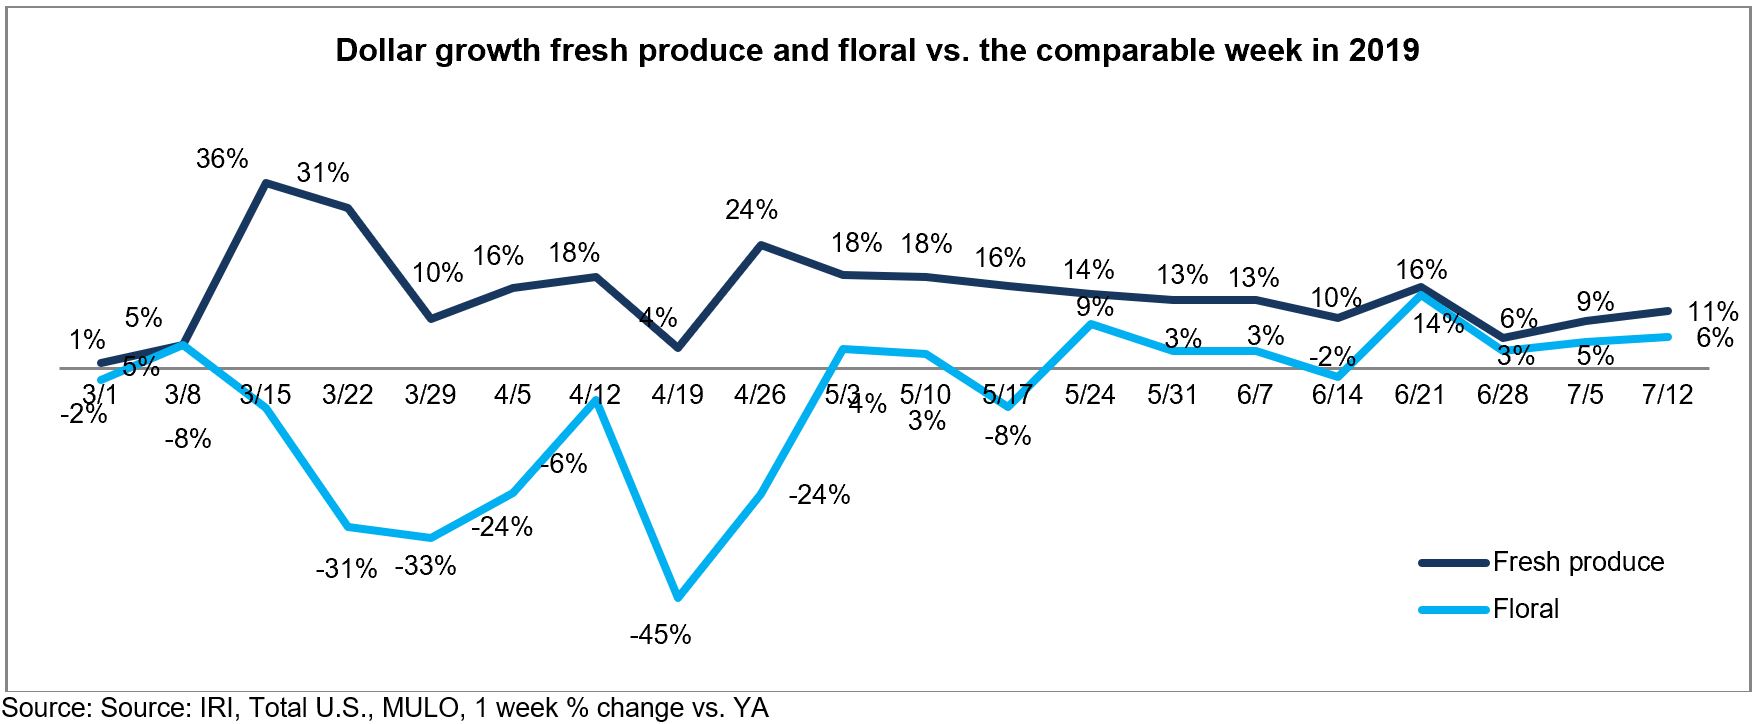
Floral
Floral sales at retail had another strong week, up 6% over the same week last year. With the exception of the week of June 14, sales have been in positive territory since the third week of May.
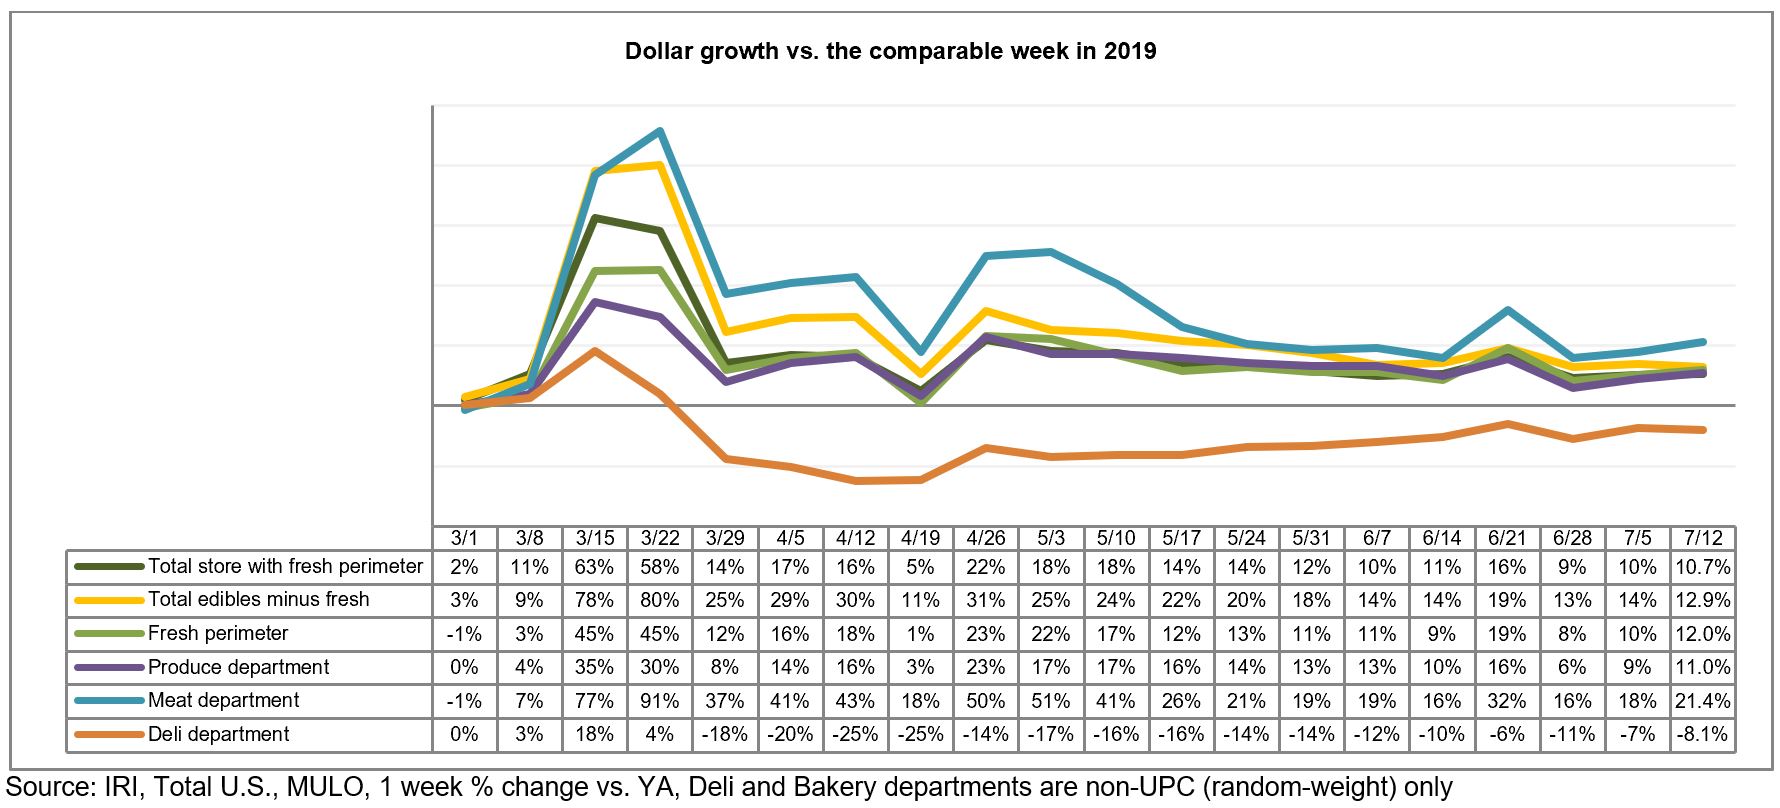
Perimeter Performance
The fresh perimeter did well during the non-holiday week with total gains of 12% versus the same week last year. Produce’s performance was right in line with the fresh average, that was pulled up by meat, at +21.4%. Center-store edible gains topped those of fresh and total store, at +12.9%.
What’s Next?
This was the first of eight non-holiday weeks until Labor Day in which everyday demand alone has to drive growth. As many states rolled back some of the reopening measures, foodservice demand for fresh produce may plateau once more. Several big grocery retailers have announced mandatory mask policies in the past week as shoppers flocked back to stores for their grocery needs. Between the rising COVID-19 concern among shoppers and the economic pressure, produce dollar sales are likely to track ahead of 2019 for the foreseeable future.
Please recognize the continued dedication of the entire grocery and produce supply chains, from farm to retailer, on keeping the produce supply flowing during these unprecedented times. #produce #joyoffresh #SupermarketSuperHeroes. 210 Analytics and IRI will continue to provide weekly updates as sales trends develop, made possible by PMA. We encourage you to contact Joe Watson, PMA’s Vice President of Membership and Engagement, at jwatson@pma.com with any questions or concerns.
