It was common for a fruit or vegetable to be having a good winter in terms of volume, pricing and demand, and then in mid-March, when lockdowns began, the item would see a sudden demand surge then crash.
No produce item shows this pandemic effect as clearly as potatoes, whose average F.O.B. price has been about half of what it was in early March, as demand has been significantly damaged by restaurant, school and institution closures.
IRI figures show potatoes up 33 percent in dollar growth and 21 percent in volume growth over 2019 at retail, but that can’t make up for the demand drop in foodservice for the item that serves a versatile role in all three meal occasions.
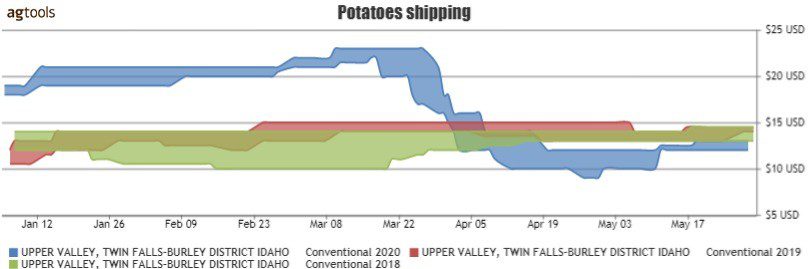
In contrast to the previous years, when the price was very steady and almost predictable, in the range of $10-15 per case, 2020 is a whole different story, said Raul Lopez, an agronomist with Agtools Inc.
Blue Book has teamed with Agtools Inc., the data analytic service for the produce industry, to look at a handful of crops and how they’re adjusting in the market during the pandemic.
F.O.B. prices in Idaho during this year reflect the pandemic effect. In January through mid-March, the price was in the range of $20+ per case, much higher than in 2019. When the lockdown started, the price dropped to $10. Now last week, we can observe a little recovery with an upward trend that may continue as the economy and restaurants reopen.
3 MAIN SUPPLYING REGIONS
Year to date, the total volume shows a 4 percent increase over 2019, however compared to 2018 the growth is barely marginal, Lopez said. The increase during 2020 was caused by the emergency buying in mid-March. The rest of the year, the market behavior has been very similar to the previous years.
Idaho is by far the main supplier, followed by Colorado. These two regions had the biggest impact in this year growth during the emergency buys. Canada shows a slight upward trend. Seems that this region is the winner of market share in the first five months of this year.
COMPARISION OF VOLUME THROUGH 2019 OF 4 BIG COMMODITIES. POTATOES, ONIONS, TOMATOES AND AVOCADOS
In 2019, the consumption of potatoes was almost steady, Lopez said. However we can observe a small decrease at the end of the summer and big increase in November due to the beginning of the holidays. The same effect can be observed in the onion market. Compared to the tomato market, potato volume is almost 3.5 times more.
NEW YORK TERMINAL MARKET PRICE
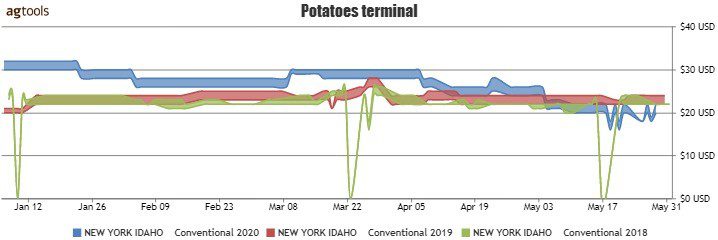
The price in the New York market has moved down by stages. Early in 2020, prices were higher than the previous years. It was in the range of $28-32, then by mid-April, it began a slight downward trend falling to the range just above $20 in early May, and it has been in that price all May, lower than 2019 and 2018.
The previous years were very steady, both in the range of $22-26. At this moment is the lowest price in this period of time in the last three years. It is expected that the price will recover, when the economy activates.
VOLUME REPORT YEAR-TO-DATE
Potatoes may be the most grown commodity in the United States. Year to date there are 18 different regions where it is grown, including Canada. In the following graph, are shown only the 10 most active regions during 2020. But the total volume represents all that has been traded. All varieties of conventional potatoes.
With a total volume of 3.9 billion pounds, Idaho represents 37.5 percent of the total supply, with Colorado, 15.3 percent; Canada 10 percent; Washington 7 percent; Wisconsin 6.3 percent; and Florida with 4.8 percent.
All these regions make 80 percent of the total market supply. Almost all the volume from Canada is growth, as last year this region only supplied 77 million pounds compared to the 387 million in 2020.
It was common for a fruit or vegetable to be having a good winter in terms of volume, pricing and demand, and then in mid-March, when lockdowns began, the item would see a sudden demand surge then crash.
No produce item shows this pandemic effect as clearly as potatoes, whose average F.O.B. price has been about half of what it was in early March, as demand has been significantly damaged by restaurant, school and institution closures.
IRI figures show potatoes up 33 percent in dollar growth and 21 percent in volume growth over 2019 at retail, but that can’t make up for the demand drop in foodservice for the item that serves a versatile role in all three meal occasions.
In contrast to the previous years, when the price was very steady and almost predictable, in the range of $10-15 per case, 2020 is a whole different story, said Raul Lopez, an agronomist with Agtools Inc.
Blue Book has teamed with Agtools Inc., the data analytic service for the produce industry, to look at a handful of crops and how they’re adjusting in the market during the pandemic.
F.O.B. prices in Idaho during this year reflect the pandemic effect. In January through mid-March, the price was in the range of $20+ per case, much higher than in 2019. When the lockdown started, the price dropped to $10. Now last week, we can observe a little recovery with an upward trend that may continue as the economy and restaurants reopen.
3 MAIN SUPPLYING REGIONS
Year to date, the total volume shows a 4 percent increase over 2019, however compared to 2018 the growth is barely marginal, Lopez said. The increase during 2020 was caused by the emergency buying in mid-March. The rest of the year, the market behavior has been very similar to the previous years.
Idaho is by far the main supplier, followed by Colorado. These two regions had the biggest impact in this year growth during the emergency buys. Canada shows a slight upward trend. Seems that this region is the winner of market share in the first five months of this year.
COMPARISION OF VOLUME THROUGH 2019 OF 4 BIG COMMODITIES. POTATOES, ONIONS, TOMATOES AND AVOCADOS
In 2019, the consumption of potatoes was almost steady, Lopez said. However we can observe a small decrease at the end of the summer and big increase in November due to the beginning of the holidays. The same effect can be observed in the onion market. Compared to the tomato market, potato volume is almost 3.5 times more.
NEW YORK TERMINAL MARKET PRICE
The price in the New York market has moved down by stages. Early in 2020, prices were higher than the previous years. It was in the range of $28-32, then by mid-April, it began a slight downward trend falling to the range just above $20 in early May, and it has been in that price all May, lower than 2019 and 2018.
The previous years were very steady, both in the range of $22-26. At this moment is the lowest price in this period of time in the last three years. It is expected that the price will recover, when the economy activates.
VOLUME REPORT YEAR-TO-DATE
Potatoes may be the most grown commodity in the United States. Year to date there are 18 different regions where it is grown, including Canada. In the following graph, are shown only the 10 most active regions during 2020. But the total volume represents all that has been traded. All varieties of conventional potatoes.
With a total volume of 3.9 billion pounds, Idaho represents 37.5 percent of the total supply, with Colorado, 15.3 percent; Canada 10 percent; Washington 7 percent; Wisconsin 6.3 percent; and Florida with 4.8 percent.
All these regions make 80 percent of the total market supply. Almost all the volume from Canada is growth, as last year this region only supplied 77 million pounds compared to the 387 million in 2020.
Greg Johnson is Director of Media Development for Blue Book Services