
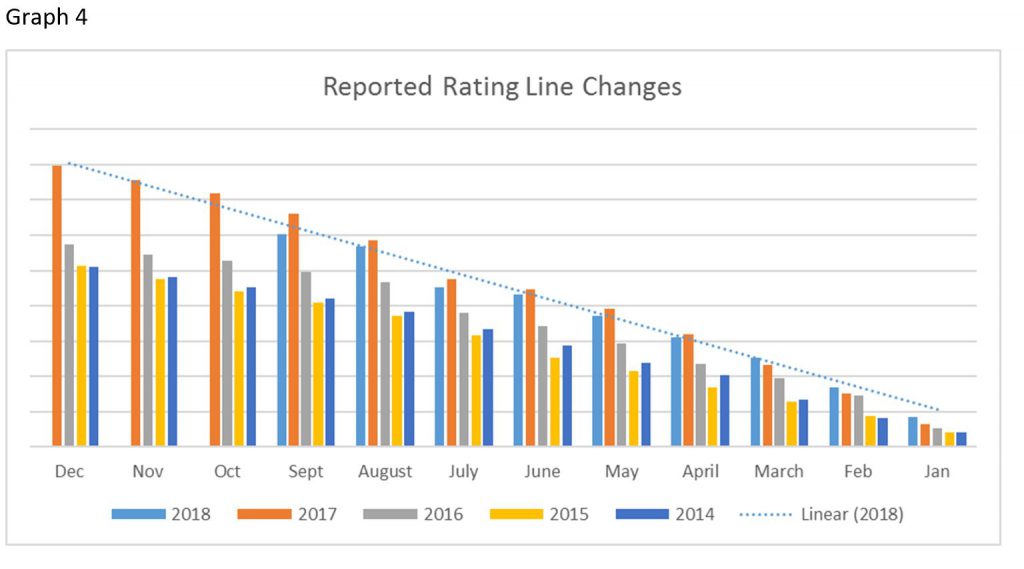
Though pay performance is relatively stable over time, rating changes are fluid and continue to be reported regularly. The Reported Rating Line Changes graph (Graph 4) depicts changes reported for the various periods shared.
Data includes changes tied to legal or Perishable Agricultural Commodities Act or Dispute Resolution Corporation actions, recalls, and closures, as well as Rating withdrawals. Greater data points and access have resulted in an increased number of changes year to year.
Understanding rating change directions may offer additional insight into certain industry subsectors and regions.
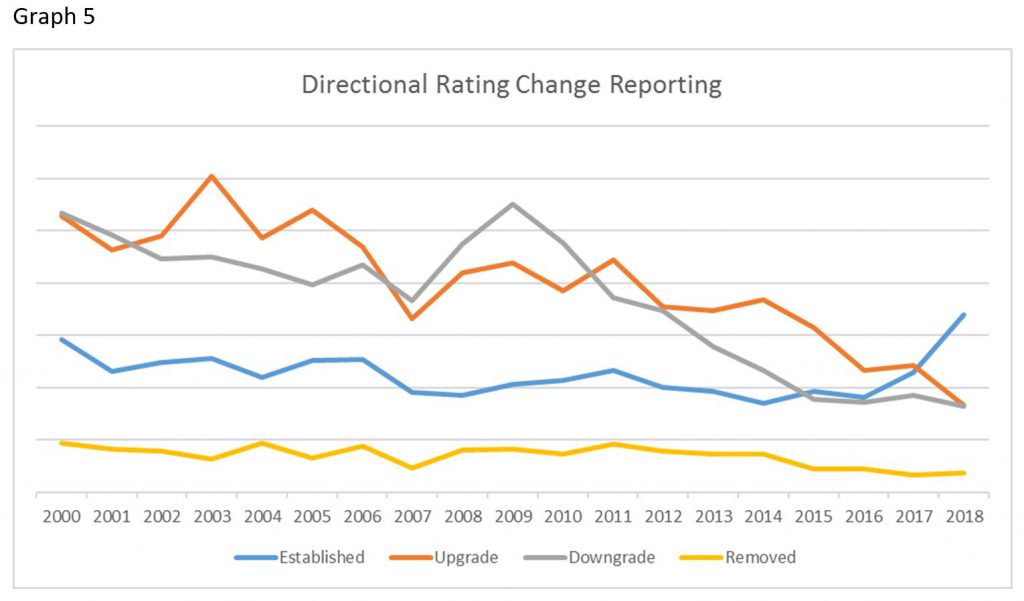
Upgrade and downgrade trends suggest a stable industry cash flow environment where companies are performing consistently. New established ratings—which can both positive and negative—and are for companies that did not previously carry a rating, have trended upward since 2016. As far as the removal of a rating, the general trend has been in decline since 2011.
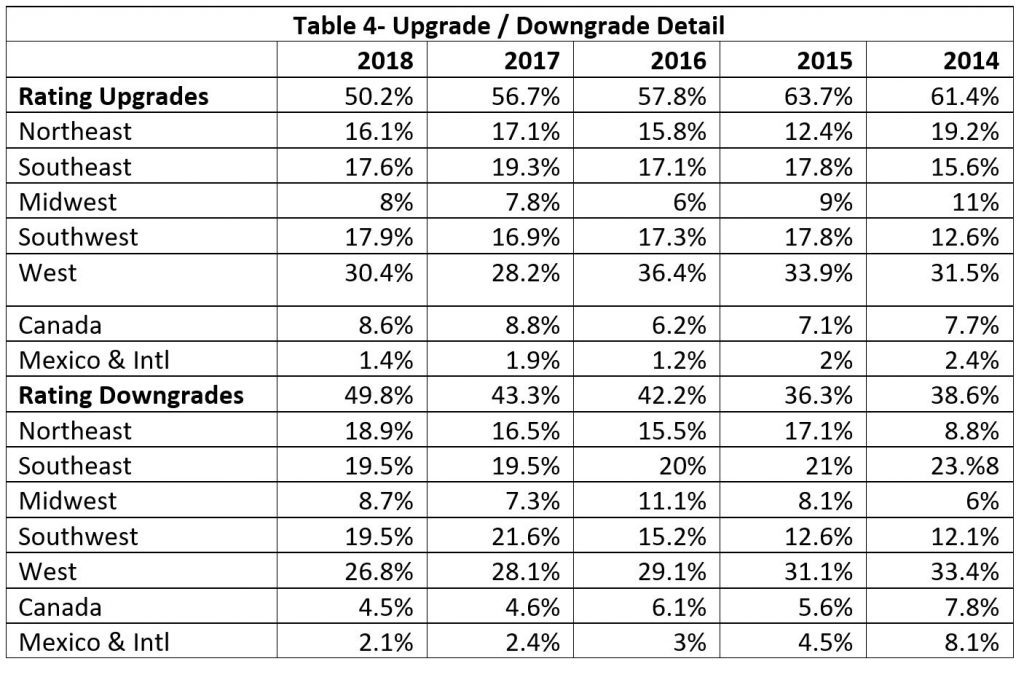
Table 4 provides upgrade and downgrade details since 2014 and geographic frequency. Details are only relative to each specific year; an increase from one year to the next may not be the result of an increased number reported, but rather a reduction in the same year of the opposite category.
Since 2014, upgrade and downgrade yearly reporting has shifted from two-thirds in upgrades and one-third in downgrades to a nearly 50/50 split as of 2018. Regional change frequency can be attributed to data collected and produce and/or transportation business density.
This is an excerpt from the most recent Produce Blueprints quarterly journal. Click here to read the full article.
